 🏗️ New Construction
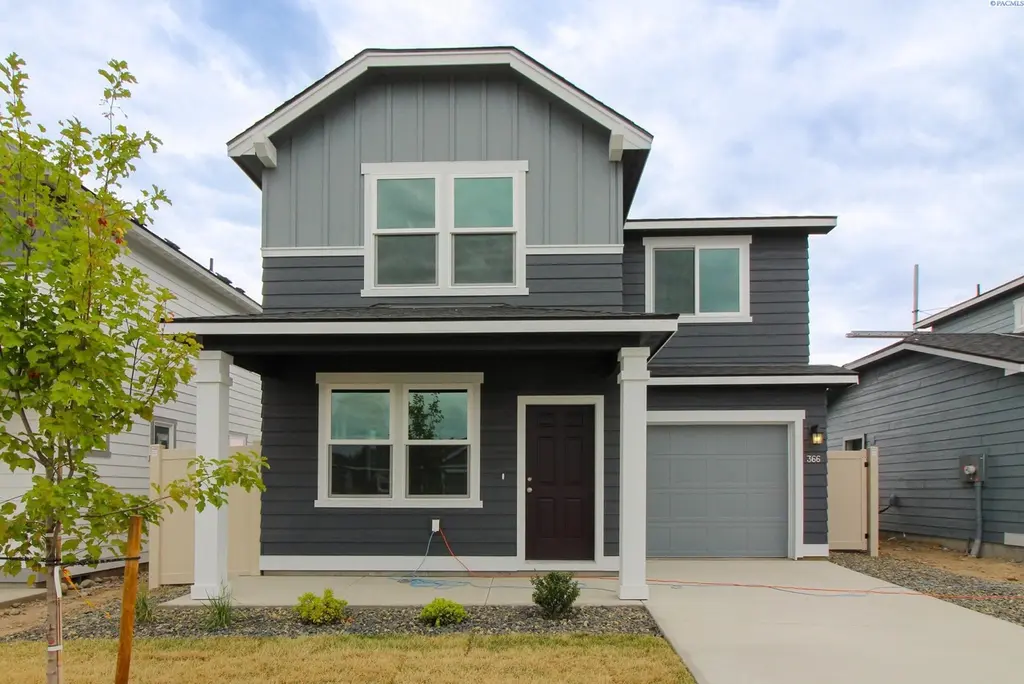
366 Aeon Dr · Prosser, WA
Flood risk No data
- FEMA flood zone
- —
- Chance of flooding over 30 yrs
- —
- Est. flood insurance / yr
- —
Fire risk No data
- Est. fire insurance / yr
- —
Heat risk No data
- Hot days now (above threshold)
- —
- Hot days in 30 yrs
- —
Wind risk No data
- Chance of severe wind over 30 yrs
- —
Air-quality risk No data
- Unhealthy air days now
- —
- Unhealthy air days in 30 yrs
- —
Risk factors via First Street. Map © Google.
Why this score? — see what drove the F grade
The composite is a weighted blend of 9 inputs, each scored 0–100. Each bar is that input's sub-score; the figure is the points it added to the 100-point composite (weight × sub-score).
- ARV discount +7.5/15.0
- Livability +4.0/5.0
- Schools +3.8/10.0
- Cash flow +3.7/30.0
- Rent growth +2.5/5.0
- Condition / age +2.5/5.0
- 1% rule +0.0/10.0
- DSCR +0.0/10.0
- Appreciation +0.0/10.0
$2,100
🖨 Deal sheet 📄 Offer letter ✓ Due diligence
Listing remarks
We do not accept 3rd party applications or viewing requests. 3 Bedroom, 2.5 Bath 1,200 sqft Home in Prosser Welcome home to this beautifully crafted home in Kennewick offering 3 bedrooms, 2.5 bathrooms, and 1,735 sqft of thoughtfully designed living space. The open-concept main floor features durable hard surface flooring, oversized windows that flood the home with natural light, and a cozy gas fireplace that creates the perfect gathering space. The modern kitchen is designed for both everyday living and entertaining with stainless steel appliances, sleek stone countertops, a spacious eat-at island, and a walk-in pantry for extra storage. A convenient half bath is also located on the main
Key facts
- Stone countertops
- Modern kitchen
- Oversized windows
Tags
Property features AI
Exterior
- Parking: 1 total parking space; 1 covered parking space; 1-car garage
- Home design: Single-family residence; New construction; Two levels (2 stories)
- Construction: Site-built on owned lot
- Exterior features: Lot approximately 2,700.72 square feet (0.062 acres); Zoned for single family residential; Subdivision: PROSSER
Interior
- Bathrooms: 1 full bathroom; 1 three-quarter bathroom; 1 half bathroom
- Interior features: No basement
Neighborhood map
What this means for you Summary
Snapshot
- This is a 3-bed/2.5-bath single-family listed at $2k.
Deal economics
- At list price, monthly cash flow is $-922 ($-11k/yr) — negative.
- The deal already cash-flows at list — no discount required.
- Meets the 1% rule at list price ($2k rent vs $2k).
Location & tenants
- Location reads 80/100 on livability (#91 in WA, #1,785 nationally) — a professional / high-income tenant draw. Strengths: commute A+, housing A+, health & safety A+; Watch: schools C-, amenities D+, employment D.
- Prosser School District (town): math 36% / reading 46% proficiency, ranked #208 of 291 in WA (top 72%) — families likely to look elsewhere, expect single-tenant / working-renter base with shorter leases.
- Market conditions: 231 active listings in the ZIP; 1,532 units permitted in Benton County in 2024 (389 in 5+ unit buildings).
Forward outlook
- Local home prices are declining (-3.0%/yr); year-one equity from $2k of loan paydown is wiped out by about $9k of value loss. Plan a longer hold.
- Benton County population projected at +32% by 2050 — long-run rental-demand tailwind backs the buy-and-hold thesis.
Negotiation context
- Only 14 days on market — expect competitive offers; lowballing is unlikely to land.
Risks & watch-outs
- Watch-outs: property tax is 224.6% of price.
Questions for the listing agent
- What do current leases actually rent for vs. the listed asking? Can we see a recent rent roll and the last 12 months of T-12 income?
- Property tax is high relative to price — has the assessment been appealed recently, and will the sale trigger a re-assessment?
- Is there a deadline driving the sale (1031 exchange, divorce, estate, relocation)? That informs how much negotiation room exists.
- The area grade is low — what's the realistic commute time and amenity access for the typical tenant pool here? Any planned neighborhood developments (good or bad) we should know about?
- What's the average days-on-market for RENTAL listings here right now (not sales)? A rising rental-DOM trend means longer vacancies and softer asking-rent achievability than the comps imply.
- What's the recent tenant-quality profile in this submarket — average credit score on applications, eviction rate, late-payment / NSF rate, and stable-employment percentage? A property-management company in the area should have these aggregated.
- How much new for-sale + rental construction is in the pipeline within 1–3 miles? Heavy new supply typically softens prices + rents 12–24 months out; constrained supply supports both.
Investment metrics
- 1% rule
- 0.50% ✗
- Cap rate
- 2.77%
- Cash-on-cash
- -12.57%
- DSCR
- 0.44
- GRM
- 16.6
CMA / ARV
- ARV (on-the-fly)
- $314,400
- Comps found
- 8
Show comp detail 8 sales within ~0.75 mi
| Address | Dist | Beds/Ba | Sqft | Sold | Price | $/sf | Match |
|---|---|---|---|---|---|---|---|
| 919 Brown St | 0.55mi | 3/2.0 | 1,192 (-1%) | 4mo | $360,000 | $302 | 68 |
| 1111 Sherman Ave | 0.27mi | 3/1.5 | 1,296 (+8%) | 9mo | $360,000 | $278 | 62 |
| 1424 Grant Ave | 0.34mi | 3/1.0 | 1,192 (-1%) | 21mo | $295,000 | $247 | 59 |
| 935 Court St | 0.56mi | 3/2.0 | 1,288 (+7%) | 1mo | $171,000 | $133 | 59 |
| 836 Main St | 0.41mi | 3/1.0 | 1,118 (-7%) | 9mo | $214,900 | $192 | 56 |
| 366 Aeon Ave | 0.75mi | 3/2.5 | 1,268 (+6%) | 1mo | $331,914 | $262 | 55 |
| 1825 Highland Dr | 0.48mi | 3/1.0 | 1,136 (-5%) | 13mo | $259,000 | $228 | 52 |
| 941 Florence St | 0.70mi | 4/1.5 (+1) | 1,153 (-4%) | 17mo | $317,000 | $275 | 38 |
Match score weights: distance 35% · size 25% · config 20% · recency 20%. Top-matched comps best support the ARV.
Projected returns pro-forma
-3.0% appreciation · 3.0% rent growth · sell at horizon
- IRR
- -39.6%
- Equity multiple
- -0.25×
- Total profit
- $-109,676
- Equity at exit
- $46,878
- IRR
- -62.4%
- Equity multiple
- -0.94×
- Total profit
- $-171,060
- Equity at exit
- $27,184
Cash invested: $88,032 (down + closing). Projections, not guarantees.
Landlord ↔ Tenant lean methodology
- Overall (STATE)
- 28 Tenant-Leaning
- State Washington
- 28 Tenant-Leaning · D+8
- County
- — inherits STATE
- City
- — inherits STATE
ZIP-level market 99350
- Home prices YoY
- -31.6%
- Active inventory
- 231
- Price-to-rent
- 0.1×
Monthly cashflow live
- Estimated rent
- $1,583 medium interval (Pro) →
- Mortgage (P&I)
- −$1,649
- Tax est. 1.5%
- −$393 /mo · $4,716/yr
- Insurance
- −$131
- HOA
- −$0
- Vacancy / Maint / Mgmt
- −$332
- Net cashflow
- $-922
Break-even live
UW: 25.0% down · 7.5% · 30yr · 1.5% tax · 5.0% vac · 8.0% maint · 8.0% mgmt
Financing live
Cash to close
- Down payment
- $78,600
- Closing costs
- $9,432
- Reserves months
- —
- Total cash needed
- —
Loan-product check · same deal, 3 products live
Conventional
25% down · 7.5% · 30yr
- Down + closing
- —
- Monthly P&I
- —
- Monthly cashflow
- —
- DSCR
- —
- Eligible?
- —
Personal DTI + credit; lowest rate.
DSCR
20% down · 8.5% · 30yr
- Down + closing
- —
- Monthly P&I
- —
- Monthly cashflow
- —
- DSCR
- —
- Eligible?
- —
No personal income docs; deal must DSCR.
Hard money
10% down · 12.0% · 12mo
- Down + closing
- —
- Monthly P&I
- —
- Monthly cashflow
- —
- DSCR
- —
- Eligible?
- —
Short-term bridge; refi at stabilization.
Listing history 12 events
-
2026-06-18days on market $2,100 Active 14 DOM
-
2026-06-17days on market $2,100 Active 13 DOM
-
2026-06-16days on market $2,100 Active 12 DOM
-
2026-06-15days on market $2,100 Active 11 DOM
-
2026-06-15days on market $2,100 Active 10 DOM
-
2026-06-13days on market $2,100 Active 9 DOM
-
2026-06-12days on market $2,100 Active 8 DOM
-
2026-06-09days on market $2,100 Active 5 DOM
-
2026-06-08days on market $2,100 Active 4 DOM
-
2026-06-08days on market $2,100 Active 3 DOM
-
2026-06-07remarks 699-char remark
-
2026-06-07$2,100 Active 2 DOM
ⓘ Source: listings_history table (triggers on properties + properties_extension) + one-shot
backfill from property_details.listing_events for pre-trigger history.
Nearby sold comps map
Loading sold comps map…
Walkable amenities ~0.75 mi
Loading nearby amenities…
Taxation est. · year 1
- Rental income
- $18,991
- − Mortgage interest
- −$17,611
- − Property taxes
- −$4,716
- − Insurance
- −$1,572
- − Repairs & maintenance
- −$1,519
- − Management
- −$1,519
- − Depreciation
- −$9,146
- Taxable loss
- −$17,093
- Est. tax savings @ 24.0%
- +$4,102
- After-tax cash flow
- $-6,967/yr
For passive investors: Depreciation is non-cash, so a rental often shows a tax loss while cash-flowing — sheltering income. Rental losses are passive: they offset passive income freely, and up to $25,000/yr can offset ordinary (W-2) income if you actively participate and your MAGI is under $100k (phasing out to $0 by $150k); unused losses carry forward. On sale, claimed depreciation is recaptured at up to 25%, and gains may owe capital-gains tax (a 1031 exchange can defer both). Figures are a year-1 estimate at your 24.0% rate — not tax advice; consult a CPA.
Schools (NCES district)
- District
- Prosser School District
- NCES district ID
- 5306900
- Math proficiency
- 36% ▼ -2.00%
- Reading proficiency
- 46% ▬ 0.00%
- Median HH income
- $52,089
- Composite
- 37.89/100
- National rank
- #8699
- State rank
- #208 of 291 in WA
Livability — Prosser
- Score
- 80/100
- State rank
- #91
- US rank
- #1785
Category grades
Schools grade is shown separately in the Schools card above.
Census & demographics
- Census place
- Prosser, WA
- Population (ZIP)
- 14,278
Population outlook (Benton County) Hauer SSP2
- Today (2025)
- 219,421 people
- By 2030
- 233,813 · +6.6%
- By 2040
- 262,134 · +19.5%
- By 2050
- 290,100 · +32.2%
- By 2075
- 363,525 · +65.7%
- By 2100
- 418,667 · +90.8%
Race, ethnicity, and origin ACS 2023
- Race & ethnicity
- White 50% Hispanic / Latino 46% Two or more races 17% Asian 2% Native American 1%
- Hispanic origin (detail)
- Mexican 43%
- Common ancestry
- Italian 3% Iranian 3% Slovak 2%
- Foreign-born
- 15% · Canada
- Languages at home
- 64% English-only · Spanish 34% Other Asian/Pacific 1%
Political lean MEDSL · Benton
- 2024 margin
- Strong R (+21.9) · D 37.7% · R 59.6% · Other 2.7%
- 2008→2024 swing
- +4.2pp toward D · 2008: -26.1pp · 2024: -21.9pp
- All cycles
- 2024: R+21.9 2020: R+21.0 2016: R+26.6 2012: R+27.0 2008: R+26.1
Not yet ingested
- Civics
- —
Market trends
- HPI YoY
- ▼ -118.73%
- Current HPI
- 256.9999
- Rent YoY
- —
- Metro
- —
- State GDP YoY
- ▲ 4.65%
- F500 in state
- 22
Industry mix (Fortune 500 HQ in WA)
| Industry | F500 HQs | Revenue |
|---|---|---|
| Retail | 2 | $269B |
|
||
| Technology / Retail | 1 | $638B |
|
||
| Technology | 1 | $245B |
|
||
| Telecommunications | 1 | $38B |
|
||
| Food / Beverage | 1 | $36B |
|
||
| Automotive / Trucks | 1 | $34B |
|
||
Price history
1 event — show timeline
- 2026-06-04 Listed $2,100 PACMLS
Cash-flow waterfall
monthlySold comps — $/sqft
last 12 mo · ≤1 miLoading sold comps…