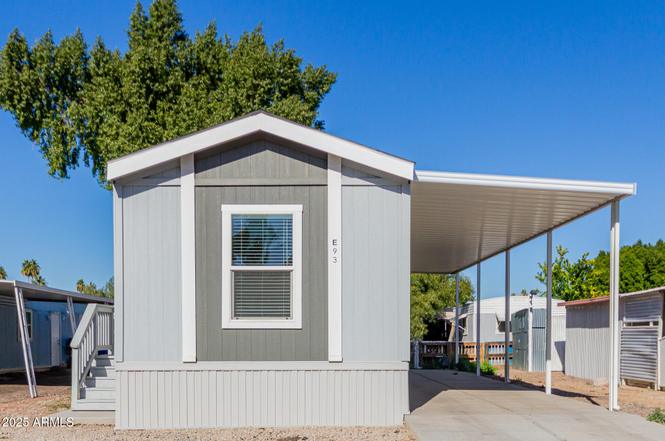
5201 W Camelback Rd Unit E093 · Phoenix, AZ
Flood risk 1/10 · Minimal
- FEMA flood zone
- X (shaded)
- Chance of flooding over 30 yrs
- 0.0%
- Est. flood insurance / yr
- $507 – $1,088
Fire risk 1/10 · Minimal
- Est. fire insurance / yr
- $610 – $1,132
Heat risk 9/10 · Severe
- Hot days now (above 112°F)
- 4 days/yr
- Hot days in 30 yrs
- 12 days/yr
Wind risk 1/10 · Minimal
- Chance of severe wind over 30 yrs
- —
Air-quality risk 2/10 · Minimal
- Unhealthy air days now
- 0 days/yr
- Unhealthy air days in 30 yrs
- 1 days/yr
Risk factors via First Street. Map © Google.
Why this score? — see what drove the B- grade
The composite is a weighted blend of 9 inputs, each scored 0–100. Each bar is that input's sub-score; the figure is the points it added to the 100-point composite (weight × sub-score).
- Cash flow +30.0/30.0
- 1% rule +10.0/10.0
- DSCR +10.0/10.0
- ARV discount +7.5/15.0
- Livability +3.8/5.0
- Rent growth +3.3/5.0
- Condition / age +2.5/5.0
- Schools +1.1/10.0
- Appreciation +0.0/10.0
$44,000
🖨 Deal sheet 📄 Offer letter ✓ Due diligence
Key facts
- 2 parking spots
- Community pool
- Built 2023
Property features AI
Finance
- Other: Directions: West on Camelback, south on G Street into park
- HOA & community: Land lease: $910 monthly; No association fees; Community pool; Community spa; Pickleball courts; Gated community; Community media room; Coin-operated laundry; Fitness center; Biking/walking path; Near bus stop
Exterior
- Parking: 2 covered parking spaces; 2 carport spaces
- Utilities: City water; Public sewer
- Home design: Mobile/manufactured home; Leasehold ownership
- Construction: Board & batten siding; Wood frame construction; Composition roof; Building area per builder
- Exterior features: Gravel/stone front yard; Gravel/stone backyard; No fencing
Interior
- Kitchen: Refrigerator; Dishwasher
- Bedrooms: Possible 2 bedrooms
- Bathrooms: 1 full bathroom
- Heating & cooling: Has heating; Central air conditioning
- Interior features: High speed internet; Eat-in kitchen; Full bathroom in primary bedroom
- Laundry & utility: Washer/Dryer hook-ups only
Neighborhood map
What this means for you Summary
Snapshot
- This is a 2-bed/1.0-bath manufactured listed at $44k.
Deal economics
- At list price, monthly cash flow is $769 ($9k/yr) — positive.
- The deal already cash-flows at list — no discount required.
- Meets the 1% rule at list price ($1k rent vs $44k).
- Recommended offer: $39k (12.0% below list) — sets the bar for market timing.
- Cap rate 27.3% vs local median 3.3% in Phoenix — top-decile yield for the area; either an underpriced asset or a hidden risk that comps aren't pricing in. Stress-test before assuming the spread holds.
Location & tenants
- Location reads 75/100 on livability (#16 in AZ, #3,924 nationally) — a middle-class / working-renter tenant base. Strengths: amenities A+, commute A+, housing A+; Watch: health & safety C-, crime F.
- Phoenix Union High School District (4286) (urban): math 10% / reading 15% proficiency, ranked #224 of 249 in AZ (top 90%) — low school quality limits family demand, transient renter base, plan for 1-2y turnover.
- Market conditions: Rents rising (+3.1%/yr); 70 active listings in the ZIP; 19 comparable units currently listed for rent nearby; rentals leasing fast (median 1d on market — plan ~1-2 weeks tenant-placement turnaround); 36,011 units permitted in Maricopa County in 2024 (12,801 in 5+ unit buildings).
Forward outlook
- Local home prices are declining (-3.0%/yr); year-one equity from $304 of loan paydown is wiped out by about $1k of value loss. Plan a longer hold.
- Maricopa County population projected at +38% by 2050 — long-run rental-demand tailwind backs the buy-and-hold thesis.
- At projected returns (-3.0% appreciation + 3.1% rent growth), your $12k cash investment doubles in ~2 years — after that, you're playing with house money.
Negotiation context
- It's been on market 187 days — a 12% lower offer ($39k) is reasonable based on typical stale-listing flexibility.
Risks & watch-outs
- Climate carrying-cost: extreme-heat days projected 4→12/yr by 2055 (HVAC capex compounding) — expect insurance premiums to compound above CPI over the hold.
Questions for the listing agent
- It's been on market 187 days. Have you received any prior offers? Is the seller open to a 12% concession, seller financing, or rate buy-down credit?
- Why hasn't it sold? Are there any deal-killer items the seller is aware of (foundation, flood, title, zoning, code violations)?
- Is there a deadline driving the sale (1031 exchange, divorce, estate, relocation)? That informs how much negotiation room exists.
- Crime grade is F in this area — have there been break-ins, vandalism, or insurance claims at this property in the last 3 years? What carrier currently insures it and at what premium?
- What's the average days-on-market for RENTAL listings here right now (not sales)? A rising rental-DOM trend means longer vacancies and softer asking-rent achievability than the comps imply.
- What's the recent tenant-quality profile in this submarket — average credit score on applications, eviction rate, late-payment / NSF rate, and stable-employment percentage? A property-management company in the area should have these aggregated.
- How much new for-sale + rental construction is in the pipeline within 1–3 miles? Heavy new supply typically softens prices + rents 12–24 months out; constrained supply supports both.
Investment metrics
- 1% rule
- 3.09% ✓
- Cap rate
- 27.27%
- Cash-on-cash
- 74.91%
- DSCR
- 4.33
- GRM
- 2.7
CMA / ARV
- ARV (on-the-fly)
- $18,960
- Comps found
- 3
Show comp detail 3 sales within ~0.75 mi
| Address | Dist | Beds/Ba | Sqft | Sold | Price | $/sf | Match |
|---|---|---|---|---|---|---|---|
| 5201 W Camelback Rd Unit F127 | 0.12mi | 2/1.5 | 660 (+4%) | 22mo | $20,000 | $30 | 67 |
| 5201 W Camelback Rd Unit A-168 | 0.10mi | 2/1.0 | 720 (+14%) | 20mo | $25,000 | $35 | 55 |
| 5201 W Camelback Rd Unit F122 | 0.12mi | 2/1.0 | 720 (+14%) | 22mo | $8,000 | $11 | 53 |
Match score weights: distance 35% · size 25% · config 20% · recency 20%. Top-matched comps best support the ARV.
Projected returns pro-forma
-3.0% appreciation · 3.09% rent growth · sell at horizon
- IRR
- 74.9%
- Equity multiple
- 4.41×
- Total profit
- $41,996
- Equity at exit
- $6,561
- IRR
- 78.6%
- Equity multiple
- 9.14×
- Total profit
- $100,232
- Equity at exit
- $3,804
Cash invested: $12,320 (down + closing). Projections, not guarantees.
Landlord ↔ Tenant lean methodology
- Overall (STATE)
- 87 Strongly Landlord-Friendly
- State Arizona
- 87 Strongly Landlord-Friendly · R+3
- County
- — inherits STATE
- City
- — inherits STATE
ZIP-level market 85031
- Home prices YoY
- -23.5%
- Rents YoY
- 3.1%
- Active inventory
- 70
- Price-to-rent
- 2.7×
Monthly cashflow live
- Estimated rent
- $1,358 high interval (Pro) →
- Mortgage (P&I)
- −$231
- Tax est. 1.5%
- −$55 /mo · $660/yr
- Insurance
- −$18
- HOA
- −$0
- Vacancy / Maint / Mgmt
- −$285
- Net cashflow
- $769
Break-even live
UW: 25.0% down · 7.5% · 30yr · 1.5% tax · 5.0% vac · 8.0% maint · 8.0% mgmt
Financing live
Cash to close
- Down payment
- $11,000
- Closing costs
- $1,320
- Reserves months
- —
- Total cash needed
- —
Loan-product check · same deal, 3 products live
Conventional
25% down · 7.5% · 30yr
- Down + closing
- —
- Monthly P&I
- —
- Monthly cashflow
- —
- DSCR
- —
- Eligible?
- —
Personal DTI + credit; lowest rate.
DSCR
20% down · 8.5% · 30yr
- Down + closing
- —
- Monthly P&I
- —
- Monthly cashflow
- —
- DSCR
- —
- Eligible?
- —
No personal income docs; deal must DSCR.
Hard money
10% down · 12.0% · 12mo
- Down + closing
- —
- Monthly P&I
- —
- Monthly cashflow
- —
- DSCR
- —
- Eligible?
- —
Short-term bridge; refi at stabilization.
Rent comps 19 comps
| Address | Beds | Baths | Sqft | Rent | $/sqft | DOM | Units | Dist |
|---|---|---|---|---|---|---|---|---|
| 5201 W Camelback Rd Lot FC200 Phoenix, AZ | 2.0 | 1.0 | 672 | $1,400 | $2.08 | 1d | 1 | 0.03mi |
| 5038 N 55th Ave Glendale, AZ | 1.0 | 1.0 | 404 | $1,200 | $2.97 | 1d | 22 | 0.49mi |
| 5190 N 55th Ave Glendale, AZ | 1.0–2.0 | 1.0–2.0 | 708 | $1,560 | $2.20 | 1d | 15 | 0.53mi |
| 5039 N 57th Ave Glendale, AZ | 1.0–2.0 | 1.0–2.0 | 800 | $2,403 | $3.00 | 1d | 15 | 0.60mi |
| 4337 N 53rd Ln Phoenix, AZ | 1.0 | 1.0 | 675 | $1,135 | $1.68 | 1d | 1 | 0.61mi |
| 4337 N 53rd Ln Unit A1 Phoenix, AZ | 1.0 | 1.0 | 675 | $1,185 | $1.76 | 1d | 1 | 0.62mi |
| 5631 W Colter St Glendale, AZ | 1.0–3.0 | 1.0–2.0 | 885 | $1,324 | $1.50 | 1d | 5 | 0.65mi |
| 5045 N 58th Ave Glendale, AZ | 1.0–2.0 | 1.0–2.0 | 821 | $1,399 | $1.70 | 1d | 1 | 0.73mi |
| 3810 N Maryvale Pkwy Phoenix, AZ | 1.0–2.0 | 1.0–2.0 | 804 | $1,100 | $1.37 | 1d | 2 | 1.09mi |
| 5755 N 59th Ave Glendale, AZ | 1.0 | 1.0 | 632 | $1,167 | $1.85 | 17d | 1 | 1.15mi |
| 4441 W Bethany Home Rd Glendale, AZ | 1.0 | 1.0 | 550 | $1,190 | $2.16 | 1d | 21 | 1.36mi |
| 4413 W Bethany Home Rd Glendale, AZ | 1.0 | 1.0 | 600 | $1,150 | $1.92 | 1d | 1 | 1.39mi |
| 5750 N 59th Ave Unit 1A Glendale, AZ | 1.0 | 1.0 | 500 | $854 | $1.71 | 1d | 1 | 1.39mi |
| 5750 N 59th Ave Unit 1B Glendale, AZ | 1.0 | 1.0 | 650 | $984 | $1.51 | 1d | 1 | 1.39mi |
| 4030 N 44th Ave Phoenix, AZ | 1.0 | 1.0 | 525 | $1,195 | $2.28 | 1d | 16 | 1.40mi |
| 5740 N 59th Ave Unit 1A Glendale, AZ | 1.0 | 1.0 | 545 | $876 | $1.61 | 1d | 1 | 1.40mi |
| 5740 N 59th Ave Unit 1B Glendale, AZ | 1.0 | 1.0 | 676 | $886 | $1.31 | 1d | 1 | 1.40mi |
| 4404 W Bethany Home Rd Glendale, AZ | 1.0–2.0 | 1.0 | 665 | $1,370 | $2.06 | 1d | 4 | 1.48mi |
| 6105 N 59th Ave Glendale, AZ | 1.0 | 1.0 | 475 | $899 | $1.89 | 1d | 1 | 1.50mi |
Listing history 16 events
-
2026-06-18days on market $44,000 Active 187 DOM
-
2026-06-17days on market $44,000 Active 186 DOM
-
2026-06-16days on market $44,000 Active 185 DOM
-
2026-06-15days on market $44,000 Active 184 DOM
-
2026-06-13days on market $44,000 Active 182 DOM
-
2026-06-13days on market $44,000 Active 181 DOM
-
2026-06-09days on market $44,000 Active 178 DOM
-
2026-06-08days on market $44,000 Active 177 DOM
-
2026-06-07days on market $44,000 Active 176 DOM
-
2026-06-04days on market $44,000 Active 173 DOM
-
2026-06-03days on market $44,000 Active 172 DOM
-
2026-06-02days on market $44,000 Active 171 DOM
-
2026-06-01days on market $44,000 Active 170 DOM
-
2026-05-31days on market $44,000 Active 169 DOM
-
2026-03-17price $44,000
-
2025-12-13$49,900 Active
ⓘ Source: listings_history table (triggers on properties + properties_extension) + one-shot
backfill from property_details.listing_events for pre-trigger history.
Climate risk First Street
- Flood 1/10 Low FEMA zone X (shaded) · 0% chance over 30 yrs
- Wildfire 1/10 Low
- Heat 9/10 Extreme 4 d/yr ≥112°F today · 12 d/yr by 30 yrs out
- Wind 1/10 Low
- Air quality 2/10 Low 0 unhealthy d/yr today · 1 by 30 yrs out
Nearby sold comps map
Loading sold comps map…
Walkable amenities ~0.75 mi
Loading nearby amenities…
Taxation est. · year 1
- Rental income
- $16,301
- − Mortgage interest
- −$2,465
- − Property taxes
- −$660
- − Insurance
- −$220
- − Repairs & maintenance
- −$1,304
- − Management
- −$1,304
- − Depreciation
- −$1,280
- Taxable income
- $9,068
- Est. tax owed @ 24.0%
- −$2,176
- After-tax cash flow
- $7,052/yr
For passive investors: Depreciation is non-cash, so a rental often shows a tax loss while cash-flowing — sheltering income. Rental losses are passive: they offset passive income freely, and up to $25,000/yr can offset ordinary (W-2) income if you actively participate and your MAGI is under $100k (phasing out to $0 by $150k); unused losses carry forward. On sale, claimed depreciation is recaptured at up to 25%, and gains may owe capital-gains tax (a 1031 exchange can defer both). Figures are a year-1 estimate at your 24.0% rate — not tax advice; consult a CPA.
Schools (NCES district)
- District
- Phoenix Union High School District (4286)
- NCES district ID
- 0406330
- Math proficiency
- 10% ▼ -27.00%
- Reading proficiency
- 15% ▼ -18.00%
- Median HH income
- $39,055
- Composite
- 10.63/100
- National rank
- #9773
- State rank
- #224 of 249 in AZ
Livability — Phoenix
- Score
- 75/100
- State rank
- #16
- US rank
- #3924
Category grades
Schools grade is shown separately in the Schools card above.
Census & demographics
- Census place
- Phoenix, AZ
- County
- Maricopa County · 4,537,380 people
- City population
- 1,500,198
- Metro
- Phoenix-Mesa-Chandler, AZ
- Population (ZIP)
- 31,191
- Household income
- $70,412
- Rent vs Own
- Severe rent burden
- 822.0
Population outlook (Maricopa County) Hauer SSP2
- Today (2025)
- 4,979,203 people
- By 2030
- 5,378,229 · +8.0%
- By 2040
- 6,156,598 · +23.6%
- By 2050
- 6,872,376 · +38.0%
- By 2075
- 8,401,270 · +68.7%
- By 2100
- 9,247,439 · +85.7%
Race, ethnicity, and origin ACS 2023
- Neighborhood character
- Predominantly Hispanic (79%)
- Race & ethnicity
- Hispanic / Latino 79% Two or more races 19% White 13% Black 5% Native American 1%
- Hispanic origin (detail)
- Mexican 74%
- Foreign-born
- 30% · Canada, United Kingdom
- Languages at home
- 37% English-only · Spanish 60%
Political lean MEDSL · Maricopa
- 2024 margin
- Toss-up / Even · D 47.7% · R 51.2% · Other 1.1%
- 2008→2024 swing
- +7.1pp toward D · 2008: -10.6pp · 2024: -3.5pp
- All cycles
- 2024: R+3.5 2020: D+2.2 2016: R+3.5 2012: R+12.0 2008: R+10.6
Not yet ingested
- Civics
- —
Market trends
- HPI YoY
- ▼ -139.76%
- Current HPI
- 456.0053
- Rent YoY
- ▲ 3.09%
- Metro
- Phoenix-Mesa-Chandler, AZ
- State GDP YoY
- ▲ 4.54%
- F500 in state
- 20
Industry mix (Fortune 500 HQ in AZ)
| Industry | F500 HQs | Revenue |
|---|---|---|
| Technology | 2 | $13B |
|
||
| Mining / Metals | 1 | $23B |
|
||
| Environmental Services | 1 | $16B |
|
||
| Metals / Steel | 1 | $14B |
|
||
| Technology Distribution | 1 | $9B |
|
||
| Homebuilding | 1 | $8B |
|
||
Price history
-11.8% since first listed2 events — show timeline
- 2026-03-17 Price Changed $44,000 ARMLS
- 2025-12-13 Listed $49,900 ARMLS
Cash-flow waterfall
monthlySold comps — $/sqft
last 12 mo · ≤1 miLoading sold comps…