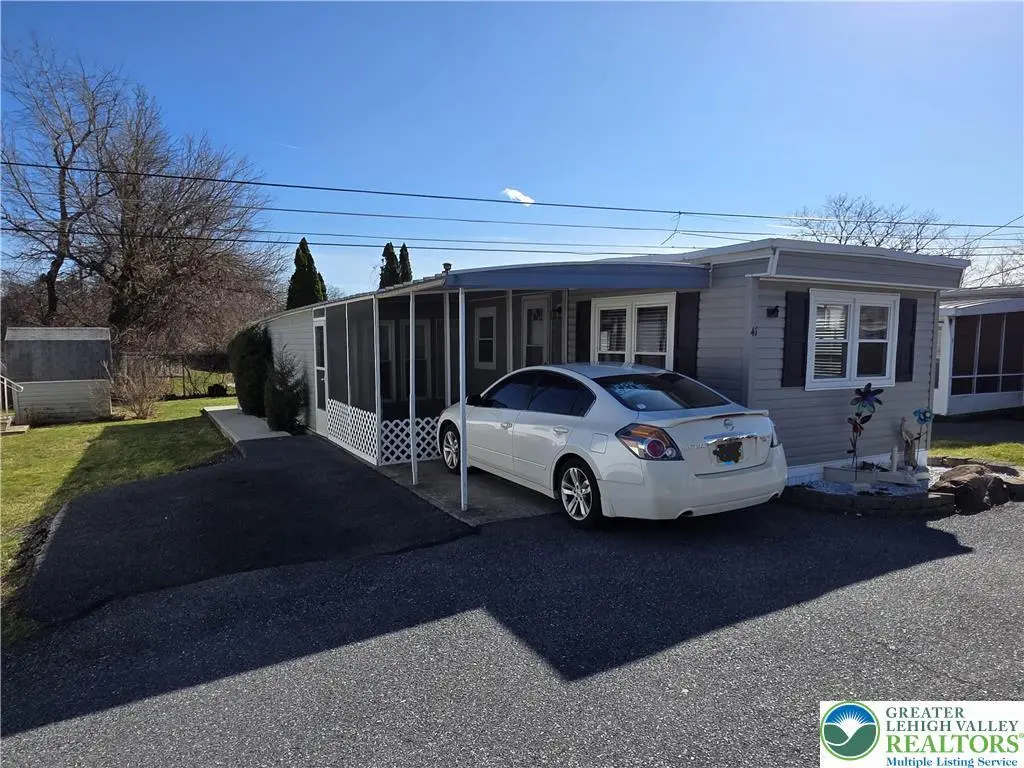
3350 Airport Rd · Hanover, PA
Flood risk 6/10 · Moderate
- FEMA flood zone
- X (unshaded)
- Chance of flooding over 30 yrs
- 0.72%
- Est. flood insurance / yr
- $473 – $860
Fire risk 1/10 · Minimal
- Est. fire insurance / yr
- $511 – $949
Heat risk 5/10 · Moderate
- Hot days now (above 99°F)
- 7 days/yr
- Hot days in 30 yrs
- 15 days/yr
Wind risk 4/10 · Minor
- Chance of severe wind over 30 yrs
- 15.0%
Air-quality risk 3/10 · Minor
- Unhealthy air days now
- 2 days/yr
- Unhealthy air days in 30 yrs
- 5 days/yr
Risk factors via First Street. Map © Google.
Why this score? — see what drove the B grade
The composite is a weighted blend of 9 inputs, each scored 0–100. Each bar is that input's sub-score; the figure is the points it added to the 100-point composite (weight × sub-score).
- Cash flow +30.0/30.0
- 1% rule +10.0/10.0
- DSCR +10.0/10.0
- ARV discount +7.5/15.0
- Rent growth +4.1/5.0
- Livability +3.8/5.0
- Schools +2.8/10.0
- Condition / age +2.5/5.0
- Appreciation +0.0/10.0
$60,000
🖨 Deal sheet 📄 Offer letter ✓ Due diligence
Listing remarks MLS
Welcome to 3350 #41 Airport Rd. , Located in Desirable Catasauqua School District! Quaintly Nestled in the Hanover Landings Community, This Lovingly Updated Mobile Home Features Two bedrooms, Full Bath, Spacious Living Room, Stunning Kitchen with Gleaming Counter Tops, and New LVP Floors Throughout! Need More Space? Move over to the Newly Added 270 Sq Ft Family Room with Walk Out Double Doors! Enjoy the Outdoors from the Privacy of your Screened in Front Patio! All Appliances Remain! Conveniently located with in minutes of Shopping Centers, Rt 22, and All Major Arteries. Easy to Show! Schedule Your Appointment Today!
Key facts
- 2,800 sq ft lot
- Parking
- Built 1995
Tags
Neighborhood map
What this means for you Summary
Snapshot
- This is a 2-bed/1.0-bath land listed at $60k.
Deal economics
- At list price, monthly cash flow is $318 ($4k/yr) — positive.
- The deal already cash-flows at list — no discount required.
- Meets the 1% rule at list price ($2k rent vs $60k).
- Recommended offer: $55k (9.0% below list) — sets the bar for market timing.
- Cap rate 12.6% vs local median 3.9% in Hanover — top-decile yield for the area; either an underpriced asset or a hidden risk that comps aren't pricing in. Stress-test before assuming the spread holds.
Location & tenants
- Location reads 76/100 on livability (#373 in PA, #3,295 nationally) — a middle-class / working-renter tenant base. Strengths: cost of living A+, housing A+, health & safety A+; Watch: amenities C-, employment D, commute F.
- Catasauqua Area SD (suburban): math 23% / reading 41% proficiency, ranked #431 of 539 in PA (top 80%) — families likely to look elsewhere, expect single-tenant / working-renter base with shorter leases.
- Market conditions: Rents rising fast (+6.6%/yr); 58 active listings in the ZIP; 7 comparable units currently listed for rent nearby; rentals at typical pace (median 14d on market — plan ~3-4 weeks tenant-placement turnaround); 765 units permitted in Lehigh County in 2024 (286 in 5+ unit buildings).
- This rent runs 36% of the median local income ($58k/yr) — at the standard rent-burdened threshold; future hikes will face affordability resistance.
Forward outlook
- Local home prices are declining (-3.0%/yr); year-one equity from $415 of loan paydown is wiped out by about $2k of value loss. Plan a longer hold.
- Lehigh County population projected at +21% by 2050 — long-run rental-demand tailwind backs the buy-and-hold thesis.
- At projected returns (-3.0% appreciation + 6.6% rent growth), your $17k cash investment doubles in ~5 years — after that, you're playing with house money.
Negotiation context
- It's been on market 94 days — a 9% lower offer ($55k) is reasonable based on typical stale-listing flexibility.
Risks & watch-outs
- Watch-outs: HOA is 41% of rent.
- Climate carrying-cost: major flood risk; extreme-heat days projected 7→15/yr by 2055 (HVAC capex compounding) — expect insurance premiums to compound above CPI over the hold.
Questions for the listing agent
- It's been on market 94 days. Have you received any prior offers? Is the seller open to a 9% concession, seller financing, or rate buy-down credit?
- What does the HOA fee cover, when was the last increase, and are there any pending special assessments or reserve-fund shortfalls?
- Why hasn't it sold? Are there any deal-killer items the seller is aware of (foundation, flood, title, zoning, code violations)?
- Is there a deadline driving the sale (1031 exchange, divorce, estate, relocation)? That informs how much negotiation room exists.
- What's the average days-on-market for RENTAL listings here right now (not sales)? A rising rental-DOM trend means longer vacancies and softer asking-rent achievability than the comps imply.
- What's the recent tenant-quality profile in this submarket — average credit score on applications, eviction rate, late-payment / NSF rate, and stable-employment percentage? A property-management company in the area should have these aggregated.
- How much new for-sale + rental construction is in the pipeline within 1–3 miles? Heavy new supply typically softens prices + rents 12–24 months out; constrained supply supports both.
Investment metrics
- 1% rule
- 2.92% ✓
- Cap rate
- 12.64%
- Cash-on-cash
- 22.68%
- DSCR
- 2.01
- GRM
- 2.9
CMA / ARV
No comps found within radius.
Projected returns pro-forma
-3.0% appreciation · 6.57% rent growth · sell at horizon
- IRR
- 23.2%
- Equity multiple
- 2.04×
- Total profit
- $17,449
- Equity at exit
- $8,946
- IRR
- 35.0%
- Equity multiple
- 5.27×
- Total profit
- $71,765
- Equity at exit
- $5,188
Cash invested: $16,800 (down + closing). Projections, not guarantees.
Landlord ↔ Tenant lean methodology
- Overall (STATE)
- 62 Landlord-Friendly
- State Pennsylvania
- 62 Landlord-Friendly · EVEN
- County
- — inherits STATE
- City
- — inherits STATE
ZIP-level market 18109
- Home prices YoY
- -21.9%
- Rents YoY
- 6.6%
- Active inventory
- 58
- Price-to-rent
- 2.9×
Monthly cashflow live
- Estimated rent
- $1,752 high interval (Pro) →
- Mortgage (P&I)
- −$315
- Tax from tax record
- −$17 /mo · $204/yr
- Insurance
- −$25
- HOA
- −$710
- Vacancy / Maint / Mgmt
- −$368
- Net cashflow
- $318
Break-even live
UW: 25.0% down · 7.5% · 30yr · 1.5% tax · 5.0% vac · 8.0% maint · 8.0% mgmt
Financing live
Cash to close
- Down payment
- $15,000
- Closing costs
- $1,800
- Reserves months
- —
- Total cash needed
- —
Loan-product check · same deal, 3 products live
Conventional
25% down · 7.5% · 30yr
- Down + closing
- —
- Monthly P&I
- —
- Monthly cashflow
- —
- DSCR
- —
- Eligible?
- —
Personal DTI + credit; lowest rate.
DSCR
20% down · 8.5% · 30yr
- Down + closing
- —
- Monthly P&I
- —
- Monthly cashflow
- —
- DSCR
- —
- Eligible?
- —
No personal income docs; deal must DSCR.
Hard money
10% down · 12.0% · 12mo
- Down + closing
- —
- Monthly P&I
- —
- Monthly cashflow
- —
- DSCR
- —
- Eligible?
- —
Short-term bridge; refi at stabilization.
Rent comps 7 comps
| Address | Beds | Baths | Sqft | Rent | $/sqft | DOM | Units | Dist |
|---|---|---|---|---|---|---|---|---|
| 2754 Suzanne Way Allentown, PA | 2.0 | 1.5 | 964 | $1,800 | $1.87 | 14d | 1 | 0.09mi |
| 2252 Catasauqua Rd Bethlehem, PA | 1.0–2.0 | 1.0 | 767 | $1,829 | $2.38 | 2d | 22 | 0.99mi |
| 2132 Pennsylvania Ave Unit 00 K- 7 Bethlehem, PA | 1.0 | 1.0 | 740 | $1,600 | $2.16 | 14d | 1 | 1.04mi |
| 2132 Pennsylvania Ave Unit 00 B- 7 Bethlehem, PA | 2.0 | 1.0 | 956 | $1,695 | $1.77 | 14d | 1 | 1.04mi |
| 1818 Catasauqua Rd Bethlehem, PA | 1.0–3.0 | 1.0–2.0 | 1007 | $2,259 | $2.24 | 43d | 9 | 1.31mi |
| 2104 Westgate Dr Bethlehem, PA | 1.0–2.0 | 1.0 | 795 | $1,620 | $2.04 | 2d | 5 | 1.45mi |
| 2010B Pinehurst Ct Allentown, PA | 1.0–2.0 | 1.0 | 844 | $1,850 | $2.19 | 2d | 6 | 1.45mi |
HOA detail
- Monthly dues
- $710 · $8,520/yr
Listing history 17 events
-
2026-06-18days on market $60,000 Active 94 DOM
-
2026-06-17days on market $60,000 Active 93 DOM
-
2026-06-16days on market $60,000 Active 92 DOM
-
2026-06-15days on market $60,000 Active 91 DOM
-
2026-06-14days on market $60,000 Active 89 DOM
-
2026-06-10days on market $60,000 Active 86 DOM
-
2026-06-09days on market $60,000 Active 85 DOM
-
2026-06-08days on market $60,000 Active 84 DOM
-
2026-06-07days on market $60,000 Active 83 DOM
-
2026-06-03days on market $60,000 Active 79 DOM
-
2026-06-02days on market $60,000 Active 78 DOM
-
2026-06-01days on market $60,000 Active 77 DOM
-
2026-05-31days on market $60,000 Active 76 DOM
-
2026-05-31days on market $60,000 Active 75 DOM
-
2026-05-15price $60,000 625-char remark
Show marketing remark (625 chars)
Welcome to 3350 #41 Airport Rd. , Located in Desirable Catasauqua School District! Quaintly Nestled in the Hanover Landings Community, This Lovingly Updated Mobile Home Features Two bedrooms, Full Bath, Spacious Living Room, Stunning Kitchen with Gleaming Counter Tops, and New LVP Floors Throughout! Need More Space? Move over to the Newly Added 270 Sq Ft Family Room with Walk Out Double Doors! Enjoy the Outdoors from the Privacy of your Screened in Front Patio! All Appliances Remain! Conveniently located with in minutes of Shopping Centers, Rt 22, and All Major Arteries. Easy to Show! Schedule Your Appointment Today!
-
2026-04-14price $70,000 625-char remark
Show marketing remark (625 chars)
Welcome to 3350 #41 Airport Rd. , Located in Desirable Catasauqua School District! Quaintly Nestled in the Hanover Landings Community, This Lovingly Updated Mobile Home Features Two bedrooms, Full Bath, Spacious Living Room, Stunning Kitchen with Gleaming Counter Tops, and New LVP Floors Throughout! Need More Space? Move over to the Newly Added 270 Sq Ft Family Room with Walk Out Double Doors! Enjoy the Outdoors from the Privacy of your Screened in Front Patio! All Appliances Remain! Conveniently located with in minutes of Shopping Centers, Rt 22, and All Major Arteries. Easy to Show! Schedule Your Appointment Today!
-
2026-03-16$75,000 Active 625-char remark
Show marketing remark (625 chars)
Welcome to 3350 #41 Airport Rd. , Located in Desirable Catasauqua School District! Quaintly Nestled in the Hanover Landings Community, This Lovingly Updated Mobile Home Features Two bedrooms, Full Bath, Spacious Living Room, Stunning Kitchen with Gleaming Counter Tops, and New LVP Floors Throughout! Need More Space? Move over to the Newly Added 270 Sq Ft Family Room with Walk Out Double Doors! Enjoy the Outdoors from the Privacy of your Screened in Front Patio! All Appliances Remain! Conveniently located with in minutes of Shopping Centers, Rt 22, and All Major Arteries. Easy to Show! Schedule Your Appointment Today!
ⓘ Source: listings_history table (triggers on properties + properties_extension) + one-shot
backfill from property_details.listing_events for pre-trigger history.
Tax reassessment forecast PA · Partial reset (capped growth)
- Current annual tax
- $204 · $17/mo
- Projected year-2 tax
- $576 · $48/mo
- Expected delta
- +$372/yr (+$31/mo · 181.9%)
ⓘ Screening estimate from a state-policy table — verify with the county assessor before closing.
Climate risk First Street
- Flood 6/10 Major FEMA zone X (unshaded) · 72% chance over 30 yrs
- Wildfire 1/10 Low
- Heat 5/10 Major 7 d/yr ≥99°F today · 15 d/yr by 30 yrs out
- Wind 4/10 Moderate 15% chance of damaging wind over 30 yrs
- Air quality 3/10 Moderate 2 unhealthy d/yr today · 5 by 30 yrs out
Nearby sold comps map
Loading sold comps map…
Walkable amenities ~0.75 mi
Loading nearby amenities…
Taxation est. · year 1
- Rental income
- $21,026
- − Mortgage interest
- −$3,361
- − Property taxes
- −$204
- − Insurance
- −$300
- − Repairs & maintenance
- −$1,682
- − Management
- −$1,682
- − HOA
- −$8,520
- − Depreciation
- −$1,745
- Taxable income
- $3,531
- Est. tax owed @ 24.0%
- −$848
- After-tax cash flow
- $2,963/yr
For passive investors: Depreciation is non-cash, so a rental often shows a tax loss while cash-flowing — sheltering income. Rental losses are passive: they offset passive income freely, and up to $25,000/yr can offset ordinary (W-2) income if you actively participate and your MAGI is under $100k (phasing out to $0 by $150k); unused losses carry forward. On sale, claimed depreciation is recaptured at up to 25%, and gains may owe capital-gains tax (a 1031 exchange can defer both). Figures are a year-1 estimate at your 24.0% rate — not tax advice; consult a CPA.
Schools (NCES district)
- District
- Catasauqua Area SD
- NCES district ID
- 4205160
- Math proficiency
- 23% ▼ -15.00%
- Reading proficiency
- 41% ▼ -21.00%
- Median HH income
- $53,073
- Composite
- 28.09/100
- National rank
- #6832
- State rank
- #431 of 539 in PA
Livability — Hanover
- Score
- 76/100
- State rank
- #373
- US rank
- #3295
Category grades
Schools grade is shown separately in the Schools card above.
Census & demographics
- County
- Lehigh County · 333,019 people
- City population
- 56,443
- Metro
- Allentown-Bethlehem-Easton, PA-NJ
- Population (ZIP)
- 18,446
- Household income
- $58,031
- Rent vs Own
- Severe rent burden
- 898.0
Population outlook (Lehigh County) Hauer SSP2
- Today (2025)
- 392,957 people
- By 2030
- 408,319 · +3.9%
- By 2040
- 440,007 · +12.0%
- By 2050
- 475,940 · +21.1%
- By 2075
- 590,448 · +50.3%
- By 2100
- 690,314 · +75.7%
Race, ethnicity, and origin ACS 2023
- Neighborhood character
- Diverse neighborhood (Simpson 0.59)
- Race & ethnicity
- Hispanic / Latino 55% White 33% Two or more races 15% Black 8% Asian 2%
- Hispanic origin (detail)
- Mexican 1% Puerto Rican 27% Cuban 1% Dominican 18%
- Common ancestry
- Hispanic 2% Romanian 1% Polish 1%
- Foreign-born
- 22% · Canada, Jamaica
- Languages at home
- 53% English-only · Spanish 37% Arabic 6% French/Haitian/Cajun 2%
Political lean MEDSL · Lehigh
- 2024 margin
- Toss-up / Even · D 50.7% · R 48.0% · Other 1.2%
- 2008→2024 swing
- -12.9pp toward R · 2008: 15.6pp · 2024: 2.7pp
- All cycles
- 2024: D+2.7 2020: D+7.6 2016: D+4.4 2012: D+7.5 2008: D+15.6
Not yet ingested
- Civics
- —
Market trends
- HPI YoY
- ▼ -96.00%
- Current HPI
- 342.9027
- Rent YoY
- ▲ 6.57%
- Metro
- Allentown-Bethlehem-Easton, PA-NJ
- State GDP YoY
- ▲ 1.68%
- F500 in state
- 34
Industry mix (Fortune 500 HQ in PA)
| Industry | F500 HQs | Revenue |
|---|---|---|
| Healthcare | 2 | $309B |
|
||
| Insurance | 2 | $27B |
|
||
| Telecommunications / Media | 1 | $124B |
|
||
| Industrial Distribution | 1 | $22B |
|
||
| Financial Services | 1 | $20B |
|
||
| Chemicals / Materials | 1 | $18B |
|
||
Price history
-20.0% since first listed3 events — show timeline
- 2026-05-15 Price Changed $60,000 GLVRMLS
- 2026-04-14 Price Changed $70,000 GLVRMLS
- 2026-03-16 Listed $75,000 GLVRMLS
Property tax history
+2.9%/yrLatest (2026): $204 · +5.3% YoY. Source: county tax records.
Cash-flow waterfall
monthlySold comps — $/sqft
last 12 mo · ≤1 miLoading sold comps…