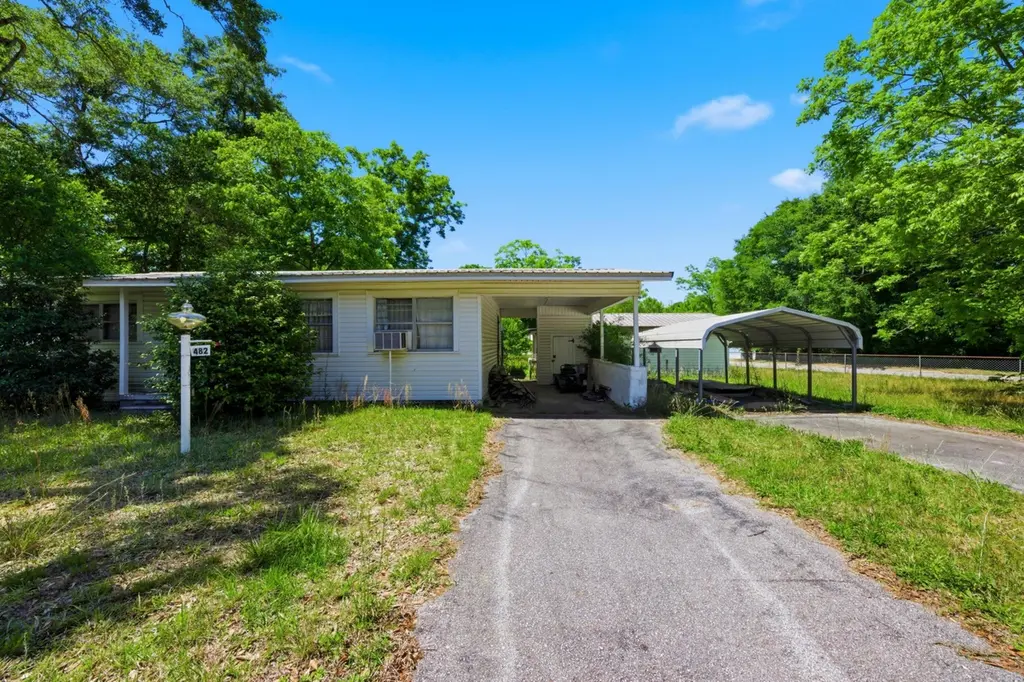
482 E Bowers Ave · Crestview, FL
Flood risk 1/10 · Minimal
- FEMA flood zone
- X (unshaded)
- Chance of flooding over 30 yrs
- 0.0%
- Est. flood insurance / yr
- $507 – $1,088
Fire risk 4/10 · Minor
- Est. fire insurance / yr
- $947 – $1,759
Heat risk 9/10 · Severe
- Hot days now (above 107°F)
- 7 days/yr
- Hot days in 30 yrs
- 20 days/yr
Wind risk 9/10 · Severe
- Chance of severe wind over 30 yrs
- 99.0%
Air-quality risk 2/10 · Minimal
- Unhealthy air days now
- 1 days/yr
- Unhealthy air days in 30 yrs
- 1 days/yr
Risk factors via First Street. Map © Google.
Why this score? — see what drove the B+ grade
The composite is a weighted blend of 9 inputs, each scored 0–100. Each bar is that input's sub-score; the figure is the points it added to the 100-point composite (weight × sub-score).
- Cash flow +30.0/30.0
- ARV discount +15.0/15.0
- 1% rule +10.0/10.0
- DSCR +10.0/10.0
- Schools +5.2/10.0
- Livability +3.8/5.0
- Rent growth +2.5/5.0
- Condition / age +2.5/5.0
- Appreciation +0.0/10.0
$89,999
🖨 Deal sheet (PDF) 📄 Offer letter ✓ Due diligence
Listing remarks
Charming opportunity in the heart of Crestview! Welcome to 482 E Bowers Ave--an ideal property for investors or buyers looking to add their personal touch. This home features solid potential with a functional layout and ample yard space with pecan tress and wild blackberries. Conveniently located near local schools, shopping, dining, and just a short drive to Eglin Air Force Base and the beautiful Emerald Coast beaches. Property is being sold as-is, with no repairs to be made by the seller. Buyer to verify all measurements, zoning, and property details. Don't miss this value-add opportunity in a desired area--come take a look today!
Key facts
- Functional layout
- Ample yard space
- Outdoor living
Tags
Property features AI
Finance
- Financial info: Seller will accept conventional financing and other financing types
Exterior
- Parking: Carport (1 space)
- Utilities: Electric service; Public water
- Home design: Detached single-family home; Residential property
- Construction: Built in 1959
- Exterior features: Level lot; Sidewalk; Lot dimensions approximately 265 x 60
Interior
- Kitchen: Refrigerator; Electric stove/oven
- Bedrooms: 3 bedrooms
- Bathrooms: 1 full bathroom
- Interior features: One-story layout; Refrigerator; Electric stove/oven
Neighborhood map
What this means for you Summary
Snapshot
- This is a 3-bed/1.0-bath single-family listed at $90k.
Deal economics
- At list price, monthly cash flow is $598 ($7k/yr) — positive.
- The deal already cash-flows at list — no discount required.
- Meets the 1% rule at list price ($2k rent vs $90k).
- Recommended offer: $87k (3.0% below list) — sets the bar for market timing.
- Cap rate 14.3% vs local median 4.4% in Crestview — top-decile yield for the area; either an underpriced asset or a hidden risk that comps aren't pricing in. Stress-test before assuming the spread holds.
Location & tenants
- Location reads 75/100 on livability (#252 in FL, #3,858 nationally) — a middle-class / working-renter tenant base. Strengths: cost of living A+, housing A+, health & safety A+; Watch: employment D, amenities F, commute F.
- Okaloosa (other): math 60% / reading 60% proficiency, ranked #12 of 73 in FL (top 16%) — acceptable for families but not a draw, mixed tenant base, ~2y average lease.
- Zoned schools: Northwood Elementary School (math 63% / reading 56%, grade B-, #690 of 2,144 statewide, top 34%, 828 students, 63% FRL); Shoal River Middle School (math 49% / reading 54%, grade C, #232 of 571 statewide, top 41%, 927 students, 55% FRL); Crestview High School (math 49% / reading 54%, grade D+, #167 of 667 statewide, top 25%, 2,315 students, 42% FRL) — zoned schools average 54% FRL vs 36% district-wide (18 pts higher); higher-poverty schools than district average — tighter screening recommended.
- Market conditions: Rents flat; 521 active listings in the ZIP; 17 comparable units currently listed for rent nearby; rentals lingering (median 44d on market — plan ~5-8 weeks vacancy on turnover, expect pricing pressure); 59% of comp listings sitting > 30 days — soft ceiling on asking rent; 1,268 units permitted in Okaloosa County in 2024 (175 in 5+ unit buildings).
Forward outlook
- Local home prices are declining (-3.0%/yr); year-one equity from $622 of loan paydown is wiped out by about $3k of value loss. Plan a longer hold.
- Okaloosa County population projected at +37% by 2050 — long-run rental-demand tailwind backs the buy-and-hold thesis.
- At projected returns (-3.0% appreciation + 0.1% rent growth), your $25k cash investment doubles in ~5 years — after that, you're playing with house money.
Negotiation context
- It's been on market 48 days — a 3% lower offer ($87k) is reasonable based on typical stale-listing flexibility.
- Current owner paid $20k; list at $90k implies a 350% gain — meaningful room to come down on a strong offer.
Risks & watch-outs
- Watch-outs: built in 1959 — expect roof / HVAC / electrical / plumbing capex.
- Climate carrying-cost: severe wind risk, 99% chance of damaging wind over 30y; extreme-heat days projected 7→20/yr by 2055 (HVAC capex compounding) — expect insurance premiums to compound above CPI over the hold.
Questions for the listing agent
- It's been on market 48 days. Have you received any prior offers? Is the seller open to a 3% concession, seller financing, or rate buy-down credit?
- Built in 1959 — when were the roof, HVAC, electrical panel, plumbing, and water heater last replaced?
- Is there a deadline driving the sale (1031 exchange, divorce, estate, relocation)? That informs how much negotiation room exists.
- Schools are B-rated — typically a magnet for longer-tenancy family renters. What's the average tenant stay here, and is there a school-zone premium baked into asking?
- What's the average days-on-market for RENTAL listings here right now (not sales)? A rising rental-DOM trend means longer vacancies and softer asking-rent achievability than the comps imply.
- What's the recent tenant-quality profile in this submarket — average credit score on applications, eviction rate, late-payment / NSF rate, and stable-employment percentage? A property-management company in the area should have these aggregated.
- How much new for-sale + rental construction is in the pipeline within 1–3 miles? Heavy new supply typically softens prices + rents 12–24 months out; constrained supply supports both.
Investment metrics
- 1% rule
- 1.69% ✓
- Cap rate
- 14.27%
- Cash-on-cash
- 28.49%
- DSCR
- 2.27
- GRM
- 4.9
CMA / ARV
- ARV (median comp)
- $127,090
- List price
- $89,999
- Delta
- -29.18%
- Verdict
- UNDERPRICED
- Comps
- 20 within 1.0 mi
Show comp detail 12 sales within ~0.75 mi
| Address | Dist | Beds/Ba | Sqft | Sold | Price | $/sf | Match |
|---|---|---|---|---|---|---|---|
| 552 Reed Ave | 0.23mi | 3/1.0 | 960 (+3%) | 1mo | $79,900 | $83 | 84 |
| 228 Cross Dr | 0.53mi | 3/1.0 | 888 (-5%) | 2mo | $37,500 | $42 | 65 |
| 503 Tall Pines St | 0.33mi | 3/2.0 | 1,070 (+14%) | 3mo | $150,000 | $140 | 54 |
| 504 Tall Pines St | 0.35mi | 3/1.0 | 1,025 (+10%) | 16mo | $180,000 | $176 | 54 |
| 204 Amellia Pl | 0.70mi | 3/1.5 | 950 (+2%) | 14mo | $205,000 | $216 | 51 |
| 1018 S Wilson St | 0.49mi | 3/1.0 | 1,032 (+10%) | 11mo | $60,000 | $58 | 51 |
| 406 Cooper St | 0.75mi | 3/1.0 | 952 (+2%) | 18mo | $224,900 | $236 | 47 |
| 393 Crossland St | 0.52mi | 3/2.0 | 1,030 (+10%) | 10mo | $202,000 | $196 | 47 |
| 520 E Williams Ave | 0.61mi | 3/2.0 | 1,024 (+9%) | 8mo | $199,900 | $195 | 46 |
| 812 E Edney Ave | 0.67mi | 3/1.0 | 1,024 (+9%) | 14mo | $69,900 | $68 | 42 |
| 271 N Booker St | 0.72mi | 2/1.0 (-1) | 884 (-6%) | 20mo | $54,900 | $62 | 36 |
| 115 Lea Pl | 0.69mi | 3/2.0 | 1,068 (+14%) | 16mo | $193,500 | $181 | 27 |
Match score weights: distance 35% · size 25% · config 20% · recency 20%. Top-matched comps best support the ARV.
Projected returns pro-forma
-3.0% appreciation · 0.12% rent growth · sell at horizon
- IRR
- 19.5%
- Equity multiple
- 1.76×
- Total profit
- $19,245
- Equity at exit
- $13,419
- IRR
- 25.8%
- Equity multiple
- 2.95×
- Total profit
- $49,257
- Equity at exit
- $7,781
Cash invested: $25,200 (down + closing). Projections, not guarantees.
Landlord ↔ Tenant lean methodology
- Overall (STATE)
- 87 Strongly Landlord-Friendly
- State Florida
- 87 Strongly Landlord-Friendly · R+3
- County
- — inherits STATE
- City
- — inherits STATE
ZIP-level market 32539
- Home prices YoY
- -17.8%
- Rents YoY
- 0.1%
- Active inventory
- 521
- Price-to-rent
- 4.9×
Monthly cashflow live
- Estimated rent
- $1,523 high interval (Pro) →
- Mortgage (P&I)
- −$472
- Tax from tax record
- −$96 /mo · $1,147/yr
- Insurance
- −$37
- HOA
- −$0
- Vacancy / Maint / Mgmt
- −$320
- Net cashflow
- $598
Break-even live
Sensitivity live
| Price | -10% $649 | -5% $624 | +0% $598 | +5% $573 | +10% $547 |
|---|---|---|---|---|---|
| Rent | -10% $478 | -5% $538 | +0% $598 | +5% $658 | +10% $719 |
| Rate | -1.0pp $644 | -0.5pp $621 | base $598 | +0.5pp $575 | +1.0pp $551 |
UW: 25.0% down · 7.5% · 30yr · 1.5% tax · 5.0% vac · 8.0% maint · 8.0% mgmt
Financing live
Cash to close
- Down payment
- $22,500
- Closing costs
- $2,700
- Reserves months
- —
- Total cash needed
- —
Loan-product check · same deal, 3 products live
Conventional
25% down · 7.5% · 30yr
- Down + closing
- —
- Monthly P&I
- —
- Monthly cashflow
- —
- DSCR
- —
- Eligible?
- —
Personal DTI + credit; lowest rate.
DSCR
20% down · 8.5% · 30yr
- Down + closing
- —
- Monthly P&I
- —
- Monthly cashflow
- —
- DSCR
- —
- Eligible?
- —
No personal income docs; deal must DSCR.
Hard money
10% down · 12.0% · 12mo
- Down + closing
- —
- Monthly P&I
- —
- Monthly cashflow
- —
- DSCR
- —
- Eligible?
- —
Short-term bridge; refi at stabilization.
Rent comps 17 comps
| Address | Beds | Baths | Sqft | Rent | $/sqft | DOM | Units | Dist |
|---|---|---|---|---|---|---|---|---|
| 408 Church St Crestview, FL | 2.0 | 2.0 | 1086 | $1,200 | $1.10 | 44d | 1 | 0.53mi |
| 401 S Booker St Crestview, FL | 3.0 | 1.5 | 1040 | $1,225 | $1.18 | 44d | 1 | 0.55mi |
| 503 W Griffith Ave Crestview, FL | 3.0 | 1.0 | 962 | $1,395 | $1.45 | 44d | 1 | 0.57mi |
| 812 E Edney Ave Crestview, FL | 2.0 | 2.0 | 1024 | $1,400 | $1.37 | 45d | 1 | 0.66mi |
| 812 E Edney Ave Crestview, FL | 2.0 | 2.0 | 1024 | $1,400 | $1.37 | 21d | 1 | 0.66mi |
| 650 Blakely Ave Crestview, FL | 2.0 | 1.0 | 648 | $1,000 | $1.54 | 14d | 1 | 0.91mi |
| 475 Aplin Rd Crestview, FL | 1.0–2.0 | 1.0–2.0 | 764 | $999 | $1.31 | 44d | 5 | 0.91mi |
| 107 Hampton Dr Crestview, FL | 2.0 | 1.5 | 972 | $1,300 | $1.34 | 21d | 1 | 0.93mi |
| 122 Hampton Dr Unit 1 Crestview, FL | 2.0 | 2.0 | 1080 | $1,195 | $1.11 | 44d | 1 | 0.94mi |
| 122 Hampton Dr Crestview, FL | 2.0 | 1.5 | 1080 | $1,195 | $1.11 | 44d | 1 | 0.94mi |
| 124 Hampton Dr Crestview, FL | 2.0 | 1.5 | 952 | $1,195 | $1.26 | 21d | 1 | 0.94mi |
| 124 Hampton Dr Unit 1 Crestview, FL | 2.0 | 1.5 | 952 | $1,195 | $1.26 | 44d | 1 | 0.94mi |
| 498 North Ave E Unit A Crestview, FL | 2.0 | 2.0 | 1081 | $1,450 | $1.34 | 44d | 1 | 1.17mi |
| 168 Cabana Way Crestview, FL | 3.0 | 2.0 | 1100 | $1,700 | $1.55 | 21d | 1 | 1.25mi |
| 720 Arbor Lake Dr Crestview, FL | 2.0 | 2.5 | 1100 | $1,400 | $1.27 | 44d | 1 | 1.31mi |
| 720 Arbor Lake Dr Crestview, FL | 2.0 | 2.5 | 1100 | $1,375 | $1.25 | 21d | 1 | 1.31mi |
| 301 E Redstone Ave Crestview, FL | 1.0–3.0 | 1.0–2.0 | 1100 | $2,202 | $2.00 | 14d | 20 | 1.36mi |
Listing history 19 events
-
2026-06-18days on market $89,999 Active 48 DOM
-
2026-06-17days on market $89,999 Active 47 DOM
-
2026-06-16days on market $89,999 Active 46 DOM
-
2026-06-15days on market $89,999 Active 45 DOM
-
2026-06-14days on market $89,999 Active 43 DOM
-
2026-06-13days on market $89,999 Active 42 DOM
-
2026-06-10days on market $89,999 Active 40 DOM
-
2026-06-09days on market $89,999 Active 39 DOM
-
2026-06-08days on market $89,999 Active 38 DOM
-
2026-06-07days on market $89,999 Active 37 DOM
-
2026-06-05days on market $89,999 Active 34 DOM
-
2026-06-02days on market $89,999 Active 32 DOM
-
2026-06-01days on market $89,999 Active 31 DOM
-
2026-05-31days on market $89,999 Active 30 DOM
-
2026-05-30days on market $89,999 Active 29 DOM
-
2026-05-12price $94,999 642-char remark
-
2026-05-01$99,999 Active 642-char remark
-
1997-10-23soldstatus $20,000
-
1979-07-01soldstatus $17,500
ⓘ Source: listings_history table (triggers on properties + properties_extension) + one-shot
backfill from property_details.listing_events for pre-trigger history.
Tax reassessment forecast FL · Resets to sale price
- Current annual tax
- $1,147 · $96/mo
- Projected year-2 tax
- $1,147 · $96/mo
- Expected delta
- $0/yr ($0/mo · 0.0%)
ⓘ Screening estimate from a state-policy table — verify with the county assessor before closing.
Climate risk First Street
- Flood 1/10 Low FEMA zone X (unshaded) · 0% chance over 30 yrs
- Wildfire 4/10 Moderate
- Heat 9/10 Extreme 7 d/yr ≥107°F today · 20 d/yr by 30 yrs out
- Wind 9/10 Extreme 99% chance of damaging wind over 30 yrs
- Air quality 2/10 Low 1 unhealthy d/yr today · 1 by 30 yrs out
Nearby sold comps map
Loading sold comps map…
Walkable amenities ~0.75 mi
Loading nearby amenities…
Taxation est. · year 1
- Rental income
- $18,278
- − Mortgage interest
- −$5,041
- − Property taxes
- −$1,147
- − Insurance
- −$450
- − Repairs & maintenance
- −$1,462
- − Management
- −$1,462
- − Depreciation
- −$2,618
- Taxable income
- $6,098
- Est. tax owed @ 24.0%
- −$1,463
- After-tax cash flow
- $5,716/yr
For passive investors: Depreciation is non-cash, so a rental often shows a tax loss while cash-flowing — sheltering income. Rental losses are passive: they offset passive income freely, and up to $25,000/yr can offset ordinary (W-2) income if you actively participate and your MAGI is under $100k (phasing out to $0 by $150k); unused losses carry forward. On sale, claimed depreciation is recaptured at up to 25%, and gains may owe capital-gains tax (a 1031 exchange can defer both). Figures are a year-1 estimate at your 24.0% rate — not tax advice; consult a CPA.
Schools (NCES district)
- District
- Okaloosa
- NCES district ID
- 1201380
- Math proficiency
- 60% ▼ -12.00%
- Reading proficiency
- 60% ▼ -4.00%
- Median HH income
- $55,601
- Composite
- 51.62/100
- National rank
- #1705
- State rank
- #12 of 73 in FL
Livability — Crestview
- Score
- 75/100
- State rank
- #252
- US rank
- #3858
Category grades
Schools grade is shown separately in the Schools card above.
Census & demographics
- Census place
- Crestview, FL
- County
- Okaloosa County · 194,352 people
- City population
- 58,889
- Metro
- Crestview-Fort Walton Beach-Destin, FL
- Population (ZIP)
- 33,290
- Household income
- $74,369
- Rent vs Own
- Severe rent burden
- 371.0
Population outlook (Okaloosa County) Hauer SSP2
- Today (2025)
- 235,133 people
- By 2030
- 253,483 · +7.8%
- By 2040
- 289,537 · +23.1%
- By 2050
- 322,954 · +37.3%
- By 2075
- 399,624 · +70.0%
- By 2100
- 425,311 · +80.9%
Race, ethnicity, and origin ACS 2023
- Neighborhood character
- Predominantly White (73%)
- Race & ethnicity
- White 73% Black 12% Two or more races 8% Hispanic / Latino 7% Asian 1%
- Hispanic origin (detail)
- Mexican 3% Puerto Rican 2%
- Common ancestry
- Lithuanian 4% Iranian 2% Romanian 2%
- Foreign-born
- 3% · Canada
- Languages at home
- 94% English-only · Spanish 3% Russian/Polish/Slavic 1% Other Asian/Pacific 1%
Political lean MEDSL · Okaloosa
- 2024 margin
- Solid R (+42.4) · D 28.2% · R 70.7% · Other 1.1%
- 2008→2024 swing
- +2.5pp toward D · 2008: -44.9pp · 2024: -42.4pp
- All cycles
- 2024: R+42.4 2020: R+39.1 2016: R+47.8 2012: R+49.4 2008: R+44.9
Not yet ingested
- Civics
- —
Market trends
- HPI YoY
- ▼ -56.52%
- Current HPI
- 261.1557
- Rent YoY
- ▲ 0.12%
- Metro
- Crestview-Fort Walton Beach-Destin, FL
- State GDP YoY
- ▲ 3.28%
- F500 in state
- 36
Industry mix (Fortune 500 HQ in FL)
| Industry | F500 HQs | Revenue |
|---|---|---|
| Industrial Technology | 2 | $29B |
|
||
| Insurance | 2 | $17B |
|
||
| Retail | 1 | $60B |
|
||
| Technology Distribution | 1 | $58B |
|
||
| Homebuilding | 1 | $35B |
|
||
| Technology Manufacturing | 1 | $35B |
|
||
Price history
+414.3% since first listed5 events — show timeline
- 2026-05-25 Price Changed $89,999 NAMLS
- 2026-05-12 Price Changed $94,999 NAMLS
- 2026-05-01 Listed $99,999 NAMLS
- 1997-10-23 Sold (Public Records) $20,000 Public Records
- 1979-07-01 Sold (Public Records) $17,500 Public Records
Property tax history
+27.0%/yrLatest (2025): $1,147 · +10.2% YoY. Source: county tax records.
Cash-flow waterfall
monthlySold comps — $/sqft
last 12 mo · ≤1 miLoading sold comps…