 🏗️ New Construction
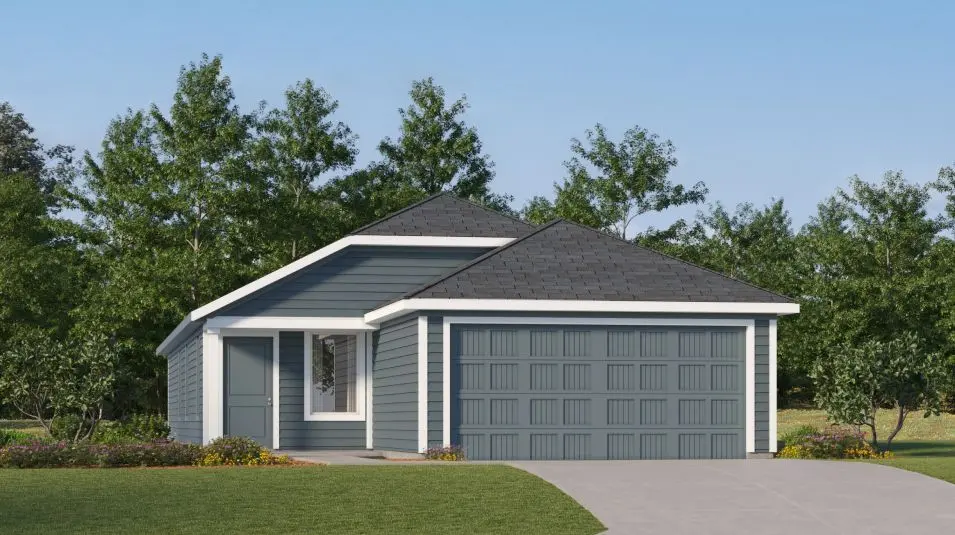
Sentosa Plan · New Braunfels, TX
Flood risk No data
- FEMA flood zone
- —
- Chance of flooding over 30 yrs
- —
- Est. flood insurance / yr
- —
Fire risk No data
- Est. fire insurance / yr
- —
Heat risk No data
- Hot days now (above threshold)
- —
- Hot days in 30 yrs
- —
Wind risk No data
- Chance of severe wind over 30 yrs
- —
Air-quality risk No data
- Unhealthy air days now
- —
- Unhealthy air days in 30 yrs
- —
Risk factors via First Street. Map © Google.
Why this score? — see what drove the F grade
The composite is a weighted blend of 9 inputs, each scored 0–100. Each bar is that input's sub-score; the figure is the points it added to the 100-point composite (weight × sub-score).
- ARV discount +7.5/15.0
- Cash flow +5.9/30.0
- Schools +5.2/10.0
- Livability +4.2/5.0
- Condition / age +2.5/5.0
- Rent growth +1.9/5.0
- 1% rule +1.3/10.0
- DSCR +0.3/10.0
- Appreciation +0.0/10.0
$240,999
🖨 Deal sheet 📄 Offer letter ✓ Due diligence
Listing remarks
This new home offers simple living with a convenient single-level layout. An open-concept floorplan combines the kitchen, living and dining areas for simple entertaining and multitasking. Three secondary bedrooms are tucked away to the side of the home, and the owner's suite is nestled into a private rear corner, offering access to a spa-inspired bathroom and walk-in closet.
Key facts
- 2 garage spots
- Listed 40 days
Property features AI
Finance
- Other: Address: New Braunfels, TX (Sentosa Plan)
- Financial info: List price $240,999
Exterior
- Parking: 2 covered garage spaces (total 2 parking spaces)
- Home design: New construction plan named Sentosa; Single-family plan (model): Sentosa
- Exterior features: Living area approximately 1,575
Interior
- Bedrooms: 4 bedrooms
- Bathrooms: 2 full bathrooms
- Interior features: Open living area (plan model)
Neighborhood map
What this means for you Summary
Snapshot
- This is a 4-bed/2.0-bath single-family listed at $241k.
Deal economics
- At list price, monthly cash flow is $-548 ($-7k/yr) — negative.
- To cash-flow at today's rent, offer at most $204k (15.4% below list).
- To meet the 1% rule (rent ≥ 1% of price), the offer needs to be $178k (26.0% below list).
- Recommended offer: $178k (26.0% below list) — sets the bar for 1% rule.
Location & tenants
- Location reads 83/100 on livability (#9 in TX, #925 nationally) — a professional / high-income tenant draw. Strengths: amenities A+, housing A+, health & safety A+; Watch: commute F.
- Comal ISD (rural): math 57% / reading 59% proficiency, ranked #58 of 826 in TX (top 7%) — acceptable for families but not a draw, mixed tenant base, ~2y average lease.
- Market conditions: Rents soft (-2.3%/yr); 1096 active listings in the ZIP; 40 comparable units currently listed for rent nearby; rentals at typical pace (median 24d on market — plan ~3-4 weeks tenant-placement turnaround); high-income renter base; 3,420 units permitted in Comal County in 2024 (1,164 in 5+ unit buildings).
- This rent is only 16% of the median local income ($135k/yr) — well below the 30% rent-burden line; pricing power to push rent on renewal without tenant pushback.
Forward outlook
- Local home prices are declining (-3.0%/yr); year-one equity from $2k of loan paydown is wiped out by about $8k of value loss. Plan a longer hold.
- Comal County population projected at +70% by 2050 — long-run rental-demand tailwind backs the buy-and-hold thesis.
Negotiation context
- It's been on market 41 days — a 3% lower offer ($234k) is reasonable based on typical stale-listing flexibility.
Questions for the listing agent
- What do current leases actually rent for vs. the listed asking? Can we see a recent rent roll and the last 12 months of T-12 income?
- It's been on market 41 days. Have you received any prior offers? Is the seller open to a 26% concession, seller financing, or rate buy-down credit?
- Is there a deadline driving the sale (1031 exchange, divorce, estate, relocation)? That informs how much negotiation room exists.
- Schools are B-rated — typically a magnet for longer-tenancy family renters. What's the average tenant stay here, and is there a school-zone premium baked into asking?
- The area grade is low — what's the realistic commute time and amenity access for the typical tenant pool here? Any planned neighborhood developments (good or bad) we should know about?
- What's the average days-on-market for RENTAL listings here right now (not sales)? A rising rental-DOM trend means longer vacancies and softer asking-rent achievability than the comps imply.
- What's the recent tenant-quality profile in this submarket — average credit score on applications, eviction rate, late-payment / NSF rate, and stable-employment percentage? A property-management company in the area should have these aggregated.
- How much new for-sale + rental construction is in the pipeline within 1–3 miles? Heavy new supply typically softens prices + rents 12–24 months out; constrained supply supports both.
Investment metrics
- 1% rule
- 0.63% ✗
- Cap rate
- 3.97%
- Cash-on-cash
- -8.30%
- DSCR
- 0.63
- GRM
- 13.2
CMA / ARV
- ARV (median comp)
- $283,264
- List price
- $240,999
- Delta
- -14.92%
- Verdict
- UNDERPRICED
- Comps
- 20 within 1.0 mi
Show comp detail 12 sales within ~0.75 mi
| Address | Dist | Beds/Ba | Sqft | Sold | Price | $/sf | Match |
|---|---|---|---|---|---|---|---|
| 3828 Swift Fox Rd | 0.49mi | 4/2.0 | 1,575 (0%) | 2mo | $215,000 | $137 | 75 |
| 3777 Swift Fox Rd | 0.42mi | 4/2.0 | 1,600 (+2%) | 4mo | $214,990 | $134 | 74 |
| 3785 Swift Fox Rd | 0.43mi | 4/2.0 | 1,600 (+2%) | 4mo | $210,000 | $131 | 74 |
| 3825 Swift Fox Rd | 0.48mi | 4/2.0 | 1,600 (+2%) | 2mo | $210,000 | $131 | 73 |
| 3845 Swift Fox Rd | 0.53mi | 4/2.0 | 1,575 (0%) | 4mo | $234,999 | $149 | 72 |
| 724 Horsetail Ln | 0.48mi | 3/2.0 (-1) | 1,634 (+4%) | 6mo | $250,000 | $153 | 62 |
| 744 Horsetail Ln | 0.47mi | 3/2.0 (-1) | 1,474 (-6%) | 0mo | $214,000 | $145 | 62 |
| 3636 Tilden | 0.24mi | 3/2.0 (-1) | 1,379 (-12%) | 2mo | $229,500 | $166 | 62 |
| 3769 Swift Fox Rd | 0.40mi | 3/2.0 (-1) | 1,402 (-11%) | 4mo | $204,990 | $146 | 54 |
| 3824 Swift Fox Rd | 0.48mi | 3/2.0 (-1) | 1,402 (-11%) | 4mo | $215,000 | $153 | 51 |
| 3841 Swift Fox Rd | 0.52mi | 3/2.0 (-1) | 1,402 (-11%) | 5mo | $226,999 | $162 | 48 |
| 911 High Plns | 0.68mi | 3/2.0 (-1) | 1,786 (+13%) | 6mo | $330,000 | $185 | 36 |
Match score weights: distance 35% · size 25% · config 20% · recency 20%. Top-matched comps best support the ARV.
Projected returns pro-forma
-3.0% appreciation · 0.0% rent growth · sell at horizon
- IRR
- -34.2%
- Equity multiple
- -0.08×
- Total profit
- $-86,031
- Equity at exit
- $42,236
- IRR
- -66.1%
- Equity multiple
- -0.76×
- Total profit
- $-139,985
- Equity at exit
- $24,492
Cash invested: $79,314 (down + closing). Projections, not guarantees.
Landlord ↔ Tenant lean methodology
- Overall (STATE)
- 87 Strongly Landlord-Friendly
- State Texas
- 87 Strongly Landlord-Friendly · R+5
- County
- — inherits STATE
- City
- — inherits STATE
ZIP-level market 78132
- Rents YoY
- -2.3%
- Active inventory
- 1096
- Price-to-rent
- 11.3×
Monthly cashflow live
- Estimated rent
- $1,784 high interval (Pro) →
- Mortgage (P&I)
- −$1,485
- Tax est. 1.5%
- −$354 /mo · $4,249/yr
- Insurance
- −$118
- HOA
- −$0
- Vacancy / Maint / Mgmt
- −$375
- Net cashflow
- $-548
Break-even live
UW: 25.0% down · 7.5% · 30yr · 1.5% tax · 5.0% vac · 8.0% maint · 8.0% mgmt
Financing live
Cash to close
- Down payment
- $70,816
- Closing costs
- $8,498
- Reserves months
- —
- Total cash needed
- —
Loan-product check · same deal, 3 products live
Conventional
25% down · 7.5% · 30yr
- Down + closing
- —
- Monthly P&I
- —
- Monthly cashflow
- —
- DSCR
- —
- Eligible?
- —
Personal DTI + credit; lowest rate.
DSCR
20% down · 8.5% · 30yr
- Down + closing
- —
- Monthly P&I
- —
- Monthly cashflow
- —
- DSCR
- —
- Eligible?
- —
No personal income docs; deal must DSCR.
Hard money
10% down · 12.0% · 12mo
- Down + closing
- —
- Monthly P&I
- —
- Monthly cashflow
- —
- DSCR
- —
- Eligible?
- —
Short-term bridge; refi at stabilization.
Rent comps 40 comps
| Address | Beds | Baths | Sqft | Rent | $/sqft | DOM | Units | Dist |
|---|---|---|---|---|---|---|---|---|
| 751 Bullsnake Trl New Braunfels, TX | 3.0 | 2.0 | 1440 | $1,650 | $1.15 | 23d | 1 | 0.08mi |
| 722 Killdeer Trl New Braunfels, TX | 3.0 | 2.0 | 1273 | $3,200 | $2.51 | 43d | 1 | 0.09mi |
| 713 Killdeer Trl New Braunfels, TX | 4.0 | 2.0 | 1668 | $1,700 | $1.02 | 43d | 1 | 0.10mi |
| 740 Bullsnake Trl New Braunfels, TX | 3.0 | 2.0 | 1440 | $1,650 | $1.15 | 43d | 1 | 0.12mi |
| 3645 Swift Fox Rd New Braunfels, TX | 4.0 | 2.0 | 1600 | $1,695 | $1.06 | 43d | 1 | 0.20mi |
| 742 Tower Hill Vw New Braunfels, TX | 3.0 | 2.0 | 1266 | $1,545 | $1.22 | 2d | 1 | 0.28mi |
| 754 Tower Hill Vw New Braunfels, TX | 3.0 | 2.0 | 1402 | $1,650 | $1.18 | 2d | 1 | 0.28mi |
| 3738 Swift Fox Rd New Braunfels, TX | 3.0 | 2.0 | 1266 | $1,545 | $1.22 | 14d | 1 | 0.34mi |
| 3707 Moon Hill Rd Marion, TX | 3.0 | 2.0 | 1354 | $1,550 | $1.14 | 4d | 1 | 0.35mi |
| 3729 Wentz Hill Dr New Braunfels, TX | 3.0 | 2.0 | 1550 | $1,595 | $1.03 | 16d | 1 | 0.35mi |
| 755 Wonderland Trl New Braunfels, TX | 3.0 | 2.5 | 1937 | $1,699 | $0.88 | 16d | 1 | 0.50mi |
| 755 Wonderland Trl New Braunfels, TX | 3.0 | 2.5 | 1937 | $1,699 | $0.88 | 4d | 1 | 0.50mi |
| 3889 Northhaven Trl Santa Clara, TX | 3.0 | 2.5 | 1920 | $1,680 | $0.88 | 43d | 1 | 0.55mi |
| 3200 Falconhead New Braunfels, TX | 3.0 | 2.5 | 2076 | $2,500 | $1.20 | 1d | 1 | 0.58mi |
| 3967 Cherokee Blvd New Braunfels, TX | 3.0 | 2.0 | 1425 | $1,695 | $1.19 | 23d | 1 | 0.70mi |
| 772 Vista Pkwy New Braunfels, TX | 4.0 | 2.0 | 1536 | $1,750 | $1.14 | 23d | 1 | 0.93mi |
| 2960 Nicholas Cv New Braunfels, TX | 3.0 | 2.0 | 2000 | $2,000 | $1.00 | 1d | 1 | 0.93mi |
| 4171 River Legacy Marion, TX | 3.0 | 2.0 | 1305 | $1,570 | $1.20 | 23d | 1 | 0.99mi |
| 2700 Farm to Market Road 1044 Unit 3-3x New Braunfels, TX | 3.0 | 2.5 | 1490 | $1,611 | $1.08 | 4d | 1 | 1.08mi |
| 2700 Farm to Market Road 1044 Unit 4x New Braunfels, TX | 4.0 | 3.5 | 1776 | $1,780 | $1.00 | 4d | 1 | 1.08mi |
| 2744 Farm to Market Road 1044 New Braunfels, TX | 3.0 | 2.0 | 1176 | $1,295 | $1.10 | 12d | 1 | 1.12mi |
| 2754 Farm to Market Road 1044 Unit 2754 New Braunfels, TX | 3.0 | 2.0 | 1176 | $1,295 | $1.10 | 43d | 1 | 1.14mi |
| 2754 Farm to Market Road 1044 New Braunfels, TX | 3.0 | 2.0 | 1176 | $1,295 | $1.10 | 17d | 1 | 1.14mi |
| 3143 Douglas Fir Dr New Braunfels, TX | 3.0 | 2.0 | 1373 | $1,325 | $0.97 | 14d | 1 | 1.14mi |
| 2764 Farm to Market Road 1044 Unit 2764 New Braunfels, TX | 3.0 | 2.0 | 1100 | $1,295 | $1.18 | 43d | 1 | 1.15mi |
| 363 Copper Mtn New Braunfels, TX | 3.0 | 2.0 | 1180 | $1,695 | $1.44 | 4d | 1 | 1.16mi |
| 410 S Water Ln New Braunfels, TX | 4.0 | 2.0 | 1963 | $1,900 | $0.97 | 43d | 1 | 1.17mi |
| 3027 Pine Valley Dr New Braunfels, TX | 3.0 | 2.0 | 1406 | $1,500 | $1.07 | 43d | 1 | 1.21mi |
| 2018 Reserve Way New Braunfels, TX | 4.0 | 2.0 | 2023 | $2,795 | $1.38 | 16d | 1 | 1.23mi |
| 3032 Douglas Fir Dr New Braunfels, TX | 3.0 | 2.0 | 1335 | $1,650 | $1.24 | 43d | 1 | 1.24mi |
| 3028 Douglas Fir Dr New Braunfels, TX | 3.0 | 2.0 | 1214 | $1,395 | $1.15 | 43d | 1 | 1.25mi |
| 340 Untermaier St Canyon Lake, TX | 3.0 | 2.5 | 1380 | $1,495 | $1.08 | 43d | 1 | 1.27mi |
| 3008 Pine Valley Dr New Braunfels, TX | 3.0 | 2.0 | 1206 | $1,450 | $1.20 | 43d | 1 | 1.28mi |
| 341 Untermaier St New Braunfels, TX | 3.0 | 2.5 | 1380 | $1,475 | $1.07 | 23d | 1 | 1.29mi |
| 320 Untermaier St Canyon Lake, TX | 3.0 | 2.5 | 1380 | $1,495 | $1.08 | 43d | 1 | 1.29mi |
| 3012 Douglas Fir Dr New Braunfels, TX | 3.0 | 2.0 | 1447 | $1,475 | $1.02 | 19d | 1 | 1.31mi |
| 419 Aaron Ln New Braunfels, TX | 4.0 | 2.0 | 1940 | $1,750 | $0.90 | 23d | 1 | 1.31mi |
| 3011 Lodgepole Ln New Braunfels, TX | 3.0 | 2.0 | 1335 | $1,425 | $1.07 | 43d | 1 | 1.33mi |
| 2997 Rosenholz St New Braunfels, TX | 3.0 | 2.5 | 1350 | $1,695 | $1.26 | 4d | 8 | 1.36mi |
| 1920 Bonelli Eagle New Braunfels, TX | 4.0 | 3.0 | 2142 | $2,045 | $0.95 | 11d | 1 | 1.36mi |
Listing history 14 events
-
2026-06-18days on market $240,999 Active 41 DOM
-
2026-06-17days on market $240,999 Active 40 DOM
-
2026-06-16days on market $240,999 Active 39 DOM
-
2026-06-15days on market $240,999 Active 38 DOM
-
2026-06-13days on market $240,999 Active 36 DOM
-
2026-06-09days on market $240,999 Active 32 DOM
-
2026-06-08days on market $240,999 Active 31 DOM
-
2026-06-07days on market $240,999 Active 30 DOM
-
2026-06-04days on market $240,999 Active 27 DOM
-
2026-06-03days on market $240,999 Active 26 DOM
-
2026-06-02days on market $240,999 Active 25 DOM
-
2026-06-02days on market $240,999 Active 24 DOM
-
2026-05-31days on market $240,999 Active 23 DOM
-
2026-05-08$240,999 Active 377-char remark
ⓘ Source: listings_history table (triggers on properties + properties_extension) + one-shot
backfill from property_details.listing_events for pre-trigger history.
Nearby sold comps map
Loading sold comps map…
Walkable amenities ~0.75 mi
Loading nearby amenities…
Taxation est. · year 1
- Rental income
- $21,405
- − Mortgage interest
- −$15,867
- − Property taxes
- −$4,249
- − Insurance
- −$1,416
- − Repairs & maintenance
- −$1,712
- − Management
- −$1,712
- − Depreciation
- −$8,240
- Taxable loss
- −$11,793
- Est. tax savings @ 24.0%
- +$2,830
- After-tax cash flow
- $-3,751/yr
For passive investors: Depreciation is non-cash, so a rental often shows a tax loss while cash-flowing — sheltering income. Rental losses are passive: they offset passive income freely, and up to $25,000/yr can offset ordinary (W-2) income if you actively participate and your MAGI is under $100k (phasing out to $0 by $150k); unused losses carry forward. On sale, claimed depreciation is recaptured at up to 25%, and gains may owe capital-gains tax (a 1031 exchange can defer both). Figures are a year-1 estimate at your 24.0% rate — not tax advice; consult a CPA.
Schools (NCES district)
- District
- Comal ISD
- NCES district ID
- 4814730
- Math proficiency
- 57% ▼ -9.00%
- Reading proficiency
- 59% ▼ -2.00%
- Median HH income
- $74,792
- Composite
- 51.79/100
- National rank
- #1671
- State rank
- #58 of 826 in TX
Livability — New Braunfels
- Score
- 83/100
- State rank
- #9
- US rank
- #925
Category grades
Schools grade is shown separately in the Schools card above.
Census & demographics
- County
- Comal County · 206,262 people
- City population
- 144,962
- Metro
- San Antonio-New Braunfels, TX
- Population (ZIP)
- 40,953
- Household income
- $135,315
- Rent vs Own
- Severe rent burden
- 264.0
Population outlook (Comal County) Hauer SSP2
- Today (2025)
- 175,637 people
- By 2030
- 199,911 · +13.8%
- By 2040
- 249,436 · +42.0%
- By 2050
- 299,430 · +70.5%
- By 2075
- 423,857 · +141.3%
- By 2100
- 512,048 · +191.5%
Race, ethnicity, and origin ACS 2023
- Neighborhood character
- Predominantly White (71%)
- Race & ethnicity
- White 71% Hispanic / Latino 21% Two or more races 13% Black 2% Asian 2%
- Hispanic origin (detail)
- Mexican 16% Puerto Rican 1%
- Common ancestry
- Slovak 4% Italian 3% Serbian 3%
- Foreign-born
- 6% · Canada
- Languages at home
- 89% English-only · Spanish 9% Other Indo-European 1%
Political lean MEDSL · Comal
- 2024 margin
- Solid R (+45.5) · D 26.8% · R 72.2%
- 2008→2024 swing
- +1.9pp toward D · 2008: -47.4pp · 2024: -45.5pp
- All cycles
- 2024: R+45.5 2020: R+42.7 2016: R+50.1 2012: R+54.1 2008: R+47.4
Not yet ingested
- Civics
- —
Market trends
- HPI YoY
- ▼ -139.57%
- Current HPI
- 202.432
- Rent YoY
- ▼ -2.32%
- Metro
- San Antonio-New Braunfels, TX
- State GDP YoY
- ▲ 3.95%
- F500 in state
- 110
Industry mix (Fortune 500 HQ in TX)
| Industry | F500 HQs | Revenue |
|---|---|---|
| Energy | 16 | $1,198B |
|
||
| Technology | 5 | $198B |
|
||
| Engineering / Construction | 4 | $72B |
|
||
| Energy Services | 3 | $60B |
|
||
| Utilities | 3 | $41B |
|
||
| Healthcare | 2 | $330B |
|
||
Cash-flow waterfall
monthlySold comps — $/sqft
last 12 mo · ≤1 miLoading sold comps…