 Multi-family
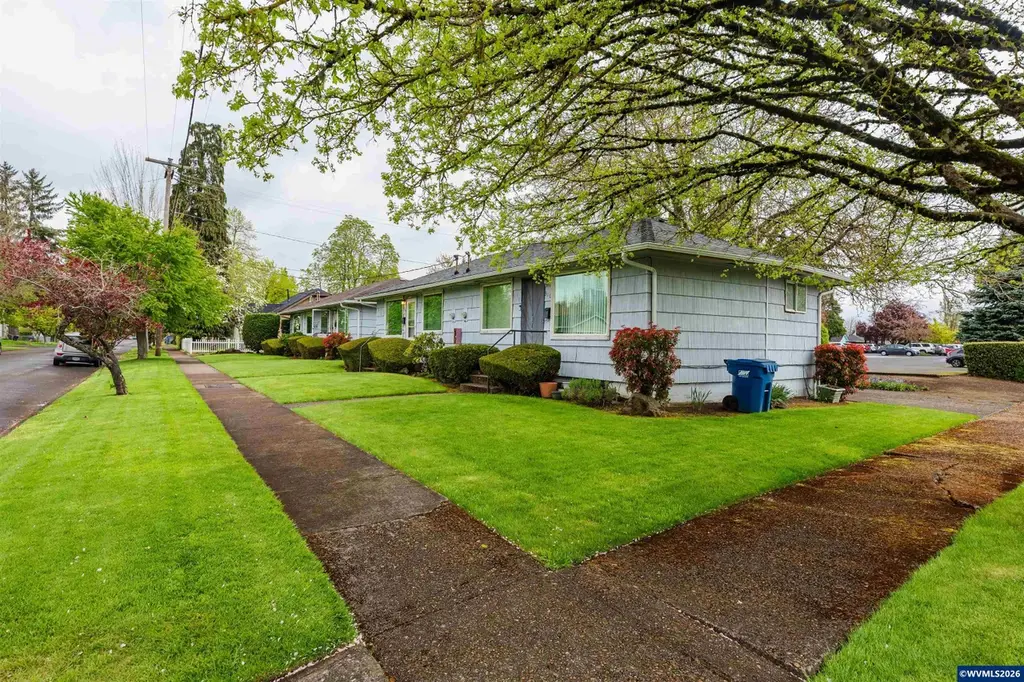
310 McNary Ave NW · Salem, OR
Flood risk 6/10 · Moderate
- FEMA flood zone
- X (shaded)
- Chance of flooding over 30 yrs
- 0.64%
- Est. flood insurance / yr
- $507 – $1,088
Fire risk 1/10 · Minimal
- Est. fire insurance / yr
- $498 – $926
Heat risk 4/10 · Minor
- Hot days now (above 92°F)
- 7 days/yr
- Hot days in 30 yrs
- 15 days/yr
Wind risk 1/10 · Minimal
- Chance of severe wind over 30 yrs
- —
Air-quality risk 9/10 · Severe
- Unhealthy air days now
- 11 days/yr
- Unhealthy air days in 30 yrs
- 11 days/yr
Risk factors via First Street. Map © Google.
Why this score? — see what drove the C+ grade
The composite is a weighted blend of 9 inputs, each scored 0–100. Each bar is that input's sub-score; the figure is the points it added to the 100-point composite (weight × sub-score).
- Cash flow +25.9/30.0
- DSCR +8.7/10.0
- ARV discount +7.5/15.0
- 1% rule +6.2/10.0
- Livability +4.0/5.0
- Schools +3.7/10.0
- Rent growth +3.0/5.0
- Condition / age +2.5/5.0
- Appreciation +0.0/10.0
$570,000
🖨 Deal sheet 📄 Offer letter ✓ Due diligence
Multi-family units
County records classify this as Multi-Family (2-4 Unit). Listing-text estimate: 1 unit. estimate disagrees with records
Listing remarks MLS
Nice investment property!! 4-plex in convenient location. 2 duplexes on 1 lot. Each unit is an efficient 1 bdrm, 1 bath w/ 550± SF on the main floor, PLUS a 500± SF basement area that has washer/dryer hook-ups & lots of storage room. Unit 310 also has a 2nd finished bdrm downstairs w/carpet & heat. Good rent & return for an investment in the price range. Some updated windows.
Key facts
- Corner positioning
- Employment centers
- 0.51 acre lot
Tags
Property features AI
Finance
- Other: Property marketed as a multifamily redevelopment opportunity with existing in-place income and potential for additional multifamily density (subject to buyer verification); Known as 'McNary' property; Located across two tax lots
- Financial info: Water/sewer expenses reported at $6,075; Maintenance expenses reported at $2,000
Exterior
- Parking: On-site paved parking
- Home design: Multifamily property (4-unit); Light blue exterior
- Construction: Built in 1936
- Exterior features: Corner lot location; Paved parking field; Approximately 0.51-acre site
Interior
- Bedrooms: Four 1-bedroom units (each unit has 1 bedroom)
- Bathrooms: Four 1-bath units (each unit has 1 bathroom)
- Interior features: Unfinished basement
Neighborhood map
What this means for you Summary
Snapshot
- This is a 2-bed/2.0-bath multifamily listed at $570k.
Deal economics
- At list price, monthly cash flow is $1k ($17k/yr) — positive.
- The deal already cash-flows at list — no discount required.
- Meets the 1% rule at list price ($6k rent vs $570k).
- Cap rate 9.2% vs local median 2.9% in Salem — top-decile yield for the area; either an underpriced asset or a hidden risk that comps aren't pricing in. Stress-test before assuming the spread holds.
Location & tenants
- Location reads 79/100 on livability (#59 in OR, #2,084 nationally) — a middle-class / working-renter tenant base. Strengths: amenities A+, commute A+, housing A+; Watch: crime F.
- Salem-Keizer SD 24J (urban): math 34% / reading 47% proficiency, ranked #103 of 183 in OR (top 56%) — families likely to look elsewhere, expect single-tenant / working-renter base with shorter leases.
- Zoned schools: Harritt Elementary School (469 students, 73% FRL); West Salem High School (1,733 students, 86% FRL) — zoned schools average 79% FRL vs 53% district-wide (27 pts higher); higher-poverty schools than district average — tighter screening recommended.
- Market conditions: Rents rising (+2.0%/yr); 261 active listings in the ZIP; 40 comparable units currently listed for rent nearby; rentals at typical pace (median 21d on market — plan ~3-4 weeks tenant-placement turnaround); high-income renter base; 177 units permitted in Polk County in 2024 (14 in 5+ unit buildings).
- At $6,358/mo this rent would consume 51% of the median local household income ($149k/yr) (locally 774% of renters already pay >50% of income on rent) — very limited rent-growth headroom before tenants either downsize or default.
Forward outlook
- Local home prices are declining (-3.0%/yr); year-one equity from $4k of loan paydown is wiped out by about $17k of value loss. Plan a longer hold.
- Polk County population projected at +25% by 2050 — long-run rental-demand tailwind backs the buy-and-hold thesis.
Negotiation context
- Only 7 days on market — expect competitive offers; lowballing is unlikely to land.
- 5 sale attempts since 16y ago with the ask held roughly flat each time — persistent listings suggest the price (not the market) is what's stuck; bring a comps-based counter.
- Current owner paid $214k; list at $570k implies a 166% gain — meaningful room to come down on a strong offer.
Risks & watch-outs
- Watch-outs: built in 1936 — expect roof / HVAC / electrical / plumbing capex.
- Climate carrying-cost: major flood risk — expect insurance premiums to compound above CPI over the hold.
Questions for the listing agent
- Built in 1936 — when were the roof, HVAC, electrical panel, plumbing, and water heater last replaced?
- Is there a deadline driving the sale (1031 exchange, divorce, estate, relocation)? That informs how much negotiation room exists.
- Schools are D-rated, which usually means shorter tenancies and higher turnover. Who's the typical renter profile here, and what's been the actual vacancy rate?
- Crime grade is F in this area — have there been break-ins, vandalism, or insurance claims at this property in the last 3 years? What carrier currently insures it and at what premium?
- What's the average days-on-market for RENTAL listings here right now (not sales)? A rising rental-DOM trend means longer vacancies and softer asking-rent achievability than the comps imply.
- What's the recent tenant-quality profile in this submarket — average credit score on applications, eviction rate, late-payment / NSF rate, and stable-employment percentage? A property-management company in the area should have these aggregated.
- How much new apartment / multifamily construction is in the pipeline within 1–3 miles? Heavy new supply (>2% of stock underway) typically softens rents 12–24 months out; light construction supports rent growth.
Investment metrics
- 1% rule
- 1.12% ✓
- Cap rate
- 9.25%
- Cash-on-cash
- 10.55%
- DSCR
- 1.47
- GRM
- 7.5
CMA / ARV
No comps found within radius.
Projected returns pro-forma
-3.0% appreciation · 2.03% rent growth · sell at horizon
- IRR
- -1.5%
- Equity multiple
- 0.94×
- Total profit
- $-9,258
- Equity at exit
- $84,989
- IRR
- 7.1%
- Equity multiple
- 1.51×
- Total profit
- $81,856
- Equity at exit
- $49,283
Cash invested: $159,600 (down + closing). Projections, not guarantees.
Landlord ↔ Tenant lean methodology
- Overall (STATE)
- 28 Tenant-Leaning
- State Oregon
- 28 Tenant-Leaning · D+6
- County
- — inherits STATE
- City
- — inherits STATE
ZIP-level market 97034
- Rents YoY
- 2.0%
- Active inventory
- 261
- Price-to-rent
- 29.9×
Monthly cashflow live
- Estimated rent
- $6,358 medium interval (Pro) →
- Mortgage (P&I)
- −$2,989
- Tax from tax record
- −$393 /mo · $4,719/yr
- Insurance
- −$238
- HOA
- −$0
- Vacancy / Maint / Mgmt
- −$1,335
- Net cashflow
- $1,403
Break-even live
4-unit breakdown (identical units grouped — click to expand)
| Units | Beds | Baths | Est. rent |
|---|---|---|---|
| 4× units | 1 | 1 | $6,356 |
| #1 | 1 | 1 | $1,589 |
| #2 | 1 | 1 | $1,589 |
| #3 | 1 | 1 | $1,589 |
| #4 | 1 | 1 | $1,589 |
| Total (4 units) | $6,358 | ||
UW: 25.0% down · 7.5% · 30yr · 1.5% tax · 5.0% vac · 8.0% maint · 8.0% mgmt
Financing live
Cash to close
- Down payment
- $142,500
- Closing costs
- $17,100
- Reserves months
- —
- Total cash needed
- —
Loan-product check · same deal, 3 products live
Conventional
25% down · 7.5% · 30yr
- Down + closing
- —
- Monthly P&I
- —
- Monthly cashflow
- —
- DSCR
- —
- Eligible?
- —
Personal DTI + credit; lowest rate.
DSCR
20% down · 8.5% · 30yr
- Down + closing
- —
- Monthly P&I
- —
- Monthly cashflow
- —
- DSCR
- —
- Eligible?
- —
No personal income docs; deal must DSCR.
Hard money
10% down · 12.0% · 12mo
- Down + closing
- —
- Monthly P&I
- —
- Monthly cashflow
- —
- DSCR
- —
- Eligible?
- —
Short-term bridge; refi at stabilization.
Rent comps 40 comps
| Address | Beds | Baths | Sqft | Rent | $/sqft | DOM | Units | Dist |
|---|---|---|---|---|---|---|---|---|
| 521 Gerth Ave NW Salem, OR | 2.0 | 1.0 | 750 | $1,495 | $1.99 | 13d | 1 | 0.18mi |
| 665 Patterson St NW Salem, OR | 2.0 | 1.0 | 716 | $1,595 | $2.23 | 43d | 1 | 0.26mi |
| 1311 6th St NW Unit 1317 Salem, OR | 2.0 | 1.0 | 850 | $1,225 | $1.44 | 43d | 1 | 0.33mi |
| 650 Rosemont Ave NW Salem, OR | 2.0 | 1.0 | 732 | $1,795 | $2.45 | 13d | 1 | 0.35mi |
| 1255 8th St NW Salem, OR | 2.0 | 1.0 | 720 | $1,200 | $1.67 | 43d | 1 | 0.36mi |
| 321 Magnolia Ct NW Salem, OR | 2.0 | 1.0 | 708 | $1,795 | $2.54 | 43d | 1 | 0.39mi |
| 791 Rosemont Ave NW Salem, OR | 2.0 | 1.0 | 712 | $1,750 | $2.46 | 43d | 1 | 0.41mi |
| 341 Senate St NW Salem, OR | 1.0–2.0 | 1.0 | 742 | $1,195 | $1.61 | 13d | 4 | 0.46mi |
| 441 Senate St NW Salem, OR | 2.0 | 1.0 | 825 | $1,195 | $1.45 | 13d | 1 | 0.48mi |
| 673 Piedmont Ave NW Salem, OR | 3.0 | 2.0 | 1369 | $1,995 | $1.46 | 13d | 1 | 0.51mi |
| 673 Piedmont Ave NW Unit 1 Salem, OR | 3.0 | 1.5 | 1369 | $1,995 | $1.46 | 21d | 1 | 0.51mi |
| 540 Wallace Rd NW Salem, OR | 2.0 | 1.0 | 986 | $1,362 | $1.38 | 13d | 2 | 0.56mi |
| 637 Glen Creek Rd NW Salem, OR | 1.0 | 1.0 | 750 | $1,295 | $1.73 | 23d | 1 | 0.56mi |
| 1094 Cascade Dr NW Salem, OR | 3.0 | 2.0 | 1300 | $3,400 | $2.62 | 13d | 1 | 0.57mi |
| 660 Taybin Rd NW Unit D Salem, OR | 2.0 | 1.0 | 895 | $1,295 | $1.45 | 13d | 1 | 0.58mi |
| 664 Taybin Rd NW Salem, OR | 2.0 | 1.0 | 895 | $1,295 | $1.45 | 13d | 1 | 0.60mi |
| 642 Taybin Rd NW Unit D Salem, OR | 1.0 | 1.0 | 775 | $1,175 | $1.52 | 43d | 1 | 0.64mi |
| 671-687 Taybin Rd NW Unit 681 Salem, OR | 2.0 | 1.5 | 1100 | $1,395 | $1.27 | 43d | 1 | 0.66mi |
| 351 Glen Creek Rd NW Unit 76 Salem, OR | 3.0 | 1.0 | 1040 | $1,575 | $1.51 | 21d | 1 | 0.72mi |
| 1250 Wallace Rd NW Apt 77 Salem, OR | 2.0 | 1.0 | 756 | $1,125 | $1.49 | 21d | 1 | 0.74mi |
| 1304 Wallace Rd NW Unit 127-51 Salem, OR | 2.0 | 1.0 | 875 | $1,375 | $1.57 | 13d | 1 | 0.77mi |
| 1390 Overlook Ave NW Salem, OR | 2.0 | 2.0 | 1231 | $2,300 | $1.87 | 13d | 1 | 0.79mi |
| 315 Commercial St SE Salem, OR | 3.0 | 1.0–2.0 | 970 | $2,457 | $2.53 | 43d | 11 | 0.80mi |
| 315 Commercial St SE Salem, OR | 3.0 | 1.0–2.0 | 988 | $2,584 | $2.62 | 13d | 17 | 0.80mi |
| 1392 Overlook Ave NW Salem, OR | 2.0 | 2.0 | 1231 | $2,300 | $1.87 | 13d | 1 | 0.80mi |
| 1394 Overlook Ave NW Salem, OR | 2.0 | 2.0 | 1231 | $2,300 | $1.87 | 13d | 1 | 0.81mi |
| 1396 Overlook Ave NW Salem, OR | 2.0 | 2.0 | 1100 | $2,300 | $2.09 | 13d | 1 | 0.81mi |
| 1399 Parkway Dr NW Salem, OR | 3.0 | 2.0 | 1288 | $2,300 | $1.79 | 13d | 1 | 0.88mi |
| 777 Commercial St SE Salem, OR | 1.0–3.0 | 1.0–2.0 | 1178 | $2,252 | $1.91 | 13d | 10 | 0.89mi |
| 160 Mission St S Salem, OR | 2.0 | 1.0 | 1288 | $1,945 | $1.51 | 43d | 1 | 0.91mi |
| 249 Liberty St NE Unit PY252 Salem, OR | 1.0 | 1.0 | 721 | $1,400 | $1.94 | 43d | 1 | 0.92mi |
| 249 Liberty St NE Unit PY236 Salem, OR | 1.0 | 1.0 | 937 | $1,600 | $1.71 | 23d | 1 | 0.92mi |
| 160 Liberty St NE Unit 204 Salem, OR | 1.0 | 1.0 | 997 | $1,495 | $1.50 | 43d | 1 | 0.93mi |
| 160 Liberty St NE Apt 305 Salem, OR | 1.0 | 2.0 | 1225 | $1,845 | $1.51 | 43d | 1 | 0.93mi |
| 357 Owens St S Unit 375-68 Salem, OR | 3.0 | 1.0 | 1030 | $1,650 | $1.60 | 43d | 1 | 0.96mi |
| 357 Owens St S Unit 375-75 Salem, OR | 3.0 | 1.0 | 1030 | $1,800 | $1.75 | 23d | 1 | 0.96mi |
| 807 Liberty St SE Unit 881 Salem, OR | 2.0 | 1.0 | 800 | $999 | $1.25 | 23d | 1 | 1.00mi |
| 807 Liberty St SE Unit 883 Salem, OR | 2.0 | 1.0 | 800 | $1,099 | $1.37 | 23d | 1 | 1.00mi |
| 807 Liberty St SE Unit 857 Salem, OR | 2.0 | 1.0 | 800 | $950 | $1.19 | 23d | 1 | 1.00mi |
| 120 Bush St S Salem, OR | 2.0 | 1.0 | 575 | $1,850 | $3.22 | 13d | 11 | 1.04mi |
Listing history 6 events
-
2026-06-09status $570,000 Pending 7 DOM
-
2026-06-08days on market $570,000 Active 7 DOM
-
2026-06-07days on market $570,000 Active 6 DOM
-
2026-06-03days on market $570,000 Active 2 DOM
-
2026-06-02remarks 699-char remark
-
2026-06-02$570,000 Active 1 DOM
ⓘ Source: listings_history table (triggers on properties + properties_extension) + one-shot
backfill from property_details.listing_events for pre-trigger history.
Tax reassessment forecast OR · Resets to sale price
- Current annual tax
- $4,719 · $393/mo
- Projected year-2 tax
- $5,529 · $461/mo
- Expected delta
- +$810/yr (+$68/mo · 17.2%)
ⓘ Screening estimate from a state-policy table — verify with the county assessor before closing.
Climate risk First Street
- Flood 6/10 Major FEMA zone X (shaded) · 64% chance over 30 yrs
- Wildfire 1/10 Low
- Heat 4/10 Moderate 7 d/yr ≥92°F today · 15 d/yr by 30 yrs out
- Wind 1/10 Low
- Air quality 9/10 Extreme 11 unhealthy d/yr today · 11 by 30 yrs out
Nearby sold comps map
Loading sold comps map…
Walkable amenities ~0.75 mi
Loading nearby amenities…
Taxation est. · year 1
- Rental income
- $76,296
- − Mortgage interest
- −$31,929
- − Property taxes
- −$4,719
- − Insurance
- −$2,850
- − Repairs & maintenance
- −$6,104
- − Management
- −$6,104
- − Depreciation
- −$16,582
- Taxable income
- $8,009
- Est. tax owed @ 24.0%
- −$1,922
- After-tax cash flow
- $14,913/yr
For passive investors: Depreciation is non-cash, so a rental often shows a tax loss while cash-flowing — sheltering income. Rental losses are passive: they offset passive income freely, and up to $25,000/yr can offset ordinary (W-2) income if you actively participate and your MAGI is under $100k (phasing out to $0 by $150k); unused losses carry forward. On sale, claimed depreciation is recaptured at up to 25%, and gains may owe capital-gains tax (a 1031 exchange can defer both). Figures are a year-1 estimate at your 24.0% rate — not tax advice; consult a CPA.
Schools (NCES district)
- District
- Salem-Keizer SD 24J
- NCES district ID
- 4110820
- Math proficiency
- 34% ▼ -1.00%
- Reading proficiency
- 47% ▼ -2.00%
- Median HH income
- $48,632
- Composite
- 37.16/100
- National rank
- #9017
- State rank
- #103 of 183 in OR
Livability — Salem
- Score
- 79/100
- State rank
- #59
- US rank
- #2084
Category grades
Schools grade is shown separately in the Schools card above.
Census & demographics
- Census place
- Salem, OR
- County
- Clackamas County · 361,406 people
- City population
- 193,601
- Metro
- Portland-Vancouver-Hillsboro, OR-WA
- Population (ZIP)
- 21,331
- Household income
- $149,236
- Rent vs Own
- Severe rent burden
- 774.0
Population outlook (Polk County) Hauer SSP2
- Today (2025)
- 88,594 people
- By 2030
- 93,209 · +5.2%
- By 2040
- 101,942 · +15.1%
- By 2050
- 110,395 · +24.6%
- By 2075
- 131,091 · +48.0%
- By 2100
- 141,746 · +60.0%
Race, ethnicity, and origin ACS 2023
- Neighborhood character
- Predominantly White (80%)
- Race & ethnicity
- White 80% Two or more races 11% Asian 7% Hispanic / Latino 4%
- Common ancestry
- Lithuanian 4% Italian 4% Portuguese 4%
- Foreign-born
- 9% · China, Canada
- Languages at home
- 90% English-only · Spanish 2% Other Indo-European 2% Chinese 2%
Political lean MEDSL · Polk
- 2024 margin
- Toss-up / Even · D 46.6% · R 50.4% · Other 3.0%
- 2008→2024 swing
- -3.3pp toward R · 2008: -0.5pp · 2024: -3.8pp
- All cycles
- 2024: R+3.8 2020: R+1.7 2016: R+7.0 2012: R+4.8 2008: R+0.5
Not yet ingested
- Civics
- —
Market trends
- HPI YoY
- ▼ -704.97%
- Current HPI
- 304.824
- Rent YoY
- ▲ 2.03%
- Metro
- Portland-Vancouver-Hillsboro, OR-WA
- State GDP YoY
- ▲ 2.05%
- F500 in state
- 2
Industry mix (Fortune 500 HQ in OR)
| Industry | F500 HQs | Revenue |
|---|---|---|
| Consumer Goods | 1 | $51B |
|
||
Price history
+555.2% since first listed15 events — show timeline
- 2026-06-01 Listed $570,000 WVMLS
- 2022-04-23 Price Changed $925 RENT.
- 2010-05-28 Listing Removed — WVMLS
- 2010-05-27 Sold (Public Records) $214,000 Public Records
- 2010-05-27 Sold (MLS) $214,000 WVMLS
- 2010-05-27 Sold (MLS) $214,000 RMLS
- 2010-05-05 Contingent — WVMLS
- 2010-05-04 Pending — RMLS
- 2010-04-24 Relisted — RMLS
- 2010-04-23 Relisted — WVMLS
- 2010-04-13 Contingent — WVMLS
- 2010-04-09 Pending — RMLS
- 2010-03-11 Listed $225,000 RMLS
- 2010-03-03 Listed $225,000 WVMLS
- 1993-03-30 Sold (Public Records) $87,000 Public Records
Property tax history
+3.4%/yrLatest (2025): $4,719 · +8.0% YoY. Source: county tax records.
Cash-flow waterfall
monthlySold comps — $/sqft
last 12 mo · ≤1 miLoading sold comps…