 Duplex
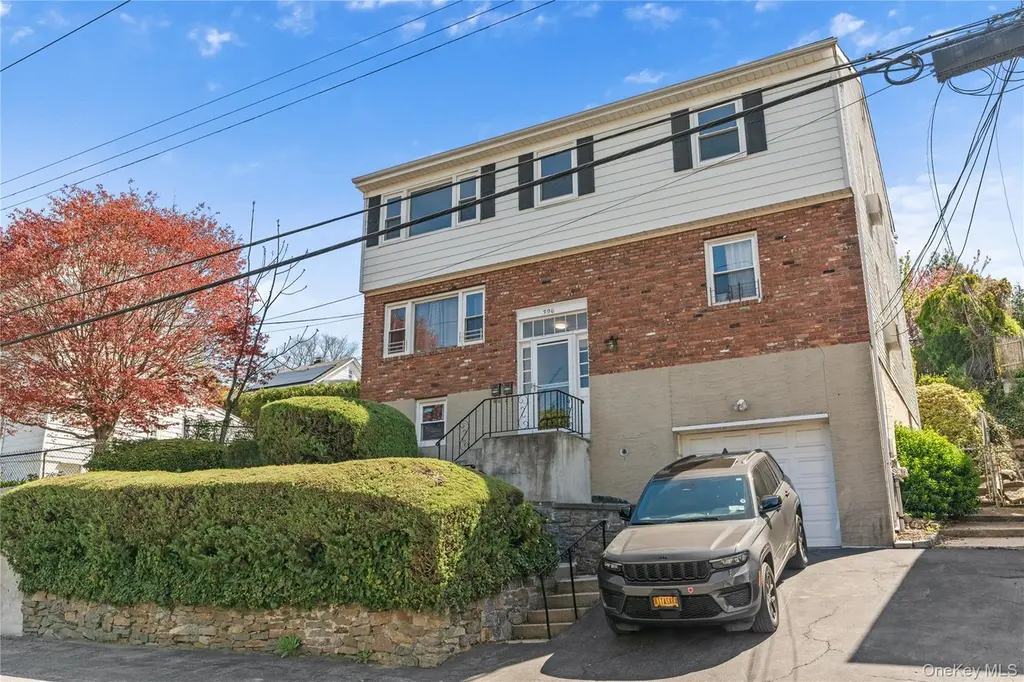
396 Columbus Ave · Tuckahoe, NY
Flood risk 1/10 · Minimal
- FEMA flood zone
- X (unshaded)
- Chance of flooding over 30 yrs
- 0.0%
- Est. flood insurance / yr
- $507 – $1,088
Fire risk 1/10 · Minimal
- Est. fire insurance / yr
- $691 – $1,283
Heat risk 6/10 · Moderate
- Hot days now (above 99°F)
- 7 days/yr
- Hot days in 30 yrs
- 15 days/yr
Wind risk 6/10 · Moderate
- Chance of severe wind over 30 yrs
- 27.0%
Air-quality risk 4/10 · Minor
- Unhealthy air days now
- 3 days/yr
- Unhealthy air days in 30 yrs
- 5 days/yr
Risk factors via First Street. Map © Google.
Why this score? — see what drove the D grade
The composite is a weighted blend of 9 inputs, each scored 0–100. Each bar is that input's sub-score; the figure is the points it added to the 100-point composite (weight × sub-score).
- ARV discount +15.0/15.0
- Cash flow +7.8/30.0
- Schools +7.2/10.0
- Livability +4.0/5.0
- Rent growth +2.5/5.0
- Condition / age +2.5/5.0
- 1% rule +2.3/10.0
- DSCR +1.9/10.0
- Appreciation +0.0/10.0
$1,290,000
🖨 Deal sheet (PDF) 📄 Offer letter ✓ Due diligence
Multi-family units
County records classify this as Multi-Family (2-4 Unit). Listing-text estimate: 2 units. confirmed
Listing remarks MLS
If you’re looking for convenient access to NYC while enjoying a suburban, small-town feel, look no further! This two-family home is ideally located just down the street from the Metro-North train station—only a 1-minute drive or a 5-minute walk to Crestwood, with an approximately 44-minute ride to Grand Central Terminal. The home features a 3-bedroom, 1-bath unit over a second 3-bedroom, 1-bath unit, both with functional and well-designed layouts. Upon entering each unit, you’ll find the kitchen to the front left of you, complete with an adjoining dining area. Wrap around the kitchen & dining area into the living room - it sits just beyond the dining space, while the right side of the unit offers three bedrooms and a full bath. Both units share the same layout, with the first-floor unit offering patio doors that lead to the backyard. The outdoor space, while quaint, is perfect for a grill, table, and seating—ideal for relaxing or entertaining. Additional features include a 1–2 car garage, a driveway with space for an additional vehicle, and a basement currently used for storage but offering great potential to be finished for recreation, a home office, or a workout area. Live in one unit and enjoy the yard, basement, and garage, while renting out the other unit to help offset expenses. Although the home is located in Tuckahoe, it is zoned for the Eastchester school district. Schedule your private showing today!
Key facts
- 3,485 sq ft lot
- 2 garage spots
- Built 1964
Tags
Neighborhood map
What this means for you Summary
Snapshot
- This is a 2 × 3-bed/1-bath units multifamily listed at $1.29M.
Deal economics
- At list price, monthly cash flow is $-1k ($-17k/yr) — negative. Per door: $-720/mo.
- To cash-flow at today's rent, offer at most $1.04M (19.7% below list).
- To meet the 1% rule (rent ≥ 1% of price), the offer needs to be $937k (27.3% below list).
- Recommended offer: $937k (27.3% below list) — sets the bar for 1% rule.
- Cap rate 5.0% vs local median 2.9% in Tuckahoe — top-decile yield for the area; either an underpriced asset or a hidden risk that comps aren't pricing in. Stress-test before assuming the spread holds.
Location & tenants
- Location reads 79/100 on livability (#125 in NY, #2,013 nationally) — a middle-class / working-renter tenant base. Strengths: crime A+, commute A+, employment A+; Watch: amenities C-, cost of living F.
- Eastchester Union Free School District (suburban): math 79% / reading 80% proficiency, ranked #42 of 590 in NY (top 7%) — strong family-tenant draw, lease renewals of 3-5y typical; only 2% free/reduced lunch — higher-income household profile.
- Zoned schools: Eastchester Middle School (math 56% / reading 76%, grade A-, #118 of 729 statewide, top 16%, 694 students, 0% FRL); Eastchester Senior High School (math 100% / reading 84%, grade A+, #171 of 1,100 statewide, top 18%, 976 students, 0% FRL) — zoned schools at 0% FRL track the district average.
- Market conditions: 44 active listings in the ZIP; 1 comparable units currently listed for rent nearby; high-income renter base; 954 units permitted in Westchester County in 2024 (649 in 5+ unit buildings).
- At $9,374/mo this rent would consume 86% of the median local household income ($131k/yr) (locally 363% of renters already pay >50% of income on rent) — very limited rent-growth headroom before tenants either downsize or default.
Forward outlook
- Local home prices are declining (-3.0%/yr); year-one equity from $9k of loan paydown is wiped out by about $39k of value loss. Plan a longer hold.
- Westchester County population projected at +10% by 2050 — modest demand growth; plan on rents tracking national, not racing it.
Negotiation context
- It's been on market 75 days — a 6% lower offer ($1.21M) is reasonable based on typical stale-listing flexibility.
- 8 sale attempts since 21y ago; this cycle's ask has dropped $105k (8%) from the opening price — seller is motivated, your offer sets the floor, not the list.
- Current owner paid $269k; list at $1.29M implies a 380% gain — meaningful room to come down on a strong offer.
Risks & watch-outs
- Climate carrying-cost: major wind risk, 27% chance of damaging wind over 30y; extreme-heat days projected 7→15/yr by 2055 (HVAC capex compounding) — expect insurance premiums to compound above CPI over the hold.
Questions for the listing agent
- What do current leases actually rent for vs. the listed asking? Can we see a recent rent roll and the last 12 months of T-12 income?
- It's been on market 75 days. Have you received any prior offers? Is the seller open to a 27% concession, seller financing, or rate buy-down credit?
- Can we see the unit-by-unit rent roll, current vacancy, and any below-market leases? What's the average tenancy length?
- What capital expenditures (roof, boiler, parking lot, exteriors) have been made in the last 5 years, and what's planned in the next 2?
- Built in 1964 — when were the roof, HVAC, electrical panel, plumbing, and water heater last replaced?
- Why hasn't it sold? Are there any deal-killer items the seller is aware of (foundation, flood, title, zoning, code violations)?
- Is there a deadline driving the sale (1031 exchange, divorce, estate, relocation)? That informs how much negotiation room exists.
- Schools are A-rated — typically a magnet for longer-tenancy family renters. What's the average tenant stay here, and is there a school-zone premium baked into asking?
- The area grade is low — what's the realistic commute time and amenity access for the typical tenant pool here? Any planned neighborhood developments (good or bad) we should know about?
- What's the average days-on-market for RENTAL listings here right now (not sales)? A rising rental-DOM trend means longer vacancies and softer asking-rent achievability than the comps imply.
- What's the recent tenant-quality profile in this submarket — average credit score on applications, eviction rate, late-payment / NSF rate, and stable-employment percentage? A property-management company in the area should have these aggregated.
- How much new apartment / multifamily construction is in the pipeline within 1–3 miles? Heavy new supply (>2% of stock underway) typically softens rents 12–24 months out; light construction supports rent growth.
Investment metrics
- 1% rule
- 0.73% ✗
- Cap rate
- 4.95%
- Cash-on-cash
- -4.78%
- DSCR
- 0.79
- GRM
- 11.5
CMA / ARV
- ARV (median comp)
- $1,771,022
- List price
- $1,290,000
- Delta
- -27.16%
- Verdict
- UNDERPRICED
- Comps
- 20 within 1.0 mi
Show comp detail 3 sales within ~0.75 mi
| Address | Dist | Beds/Ba | Sqft | Sold | Price | $/sf | Match |
|---|---|---|---|---|---|---|---|
| 364 Columbus Ave | 0.08mi | 6/2.0 | — | 10mo | $1,230,000 | — | 75 |
| 56 Fisher Ave | 0.33mi | 6/2.0 | 3,000 | 13mo | $1,100,000 | $367 | 62 |
| 42 Glen Rd | 0.49mi | 6/3.0 | — | 5mo | $1,069,000 | — | 60 |
Match score weights: distance 35% · size 25% · config 20% · recency 20%. Top-matched comps best support the ARV.
Projected returns pro-forma
-3.0% appreciation · 3.0% rent growth · sell at horizon
- IRR
- -24.4%
- Equity multiple
- 0.17×
- Total profit
- $-300,619
- Equity at exit
- $192,343
- IRR
- -19.8%
- Equity multiple
- -0.05×
- Total profit
- $-379,430
- Equity at exit
- $111,536
Cash invested: $361,200 (down + closing). Projections, not guarantees.
Landlord ↔ Tenant lean methodology
- Overall (STATE)
- 15 Strongly Tenant-Friendly
- State New York
- 15 Strongly Tenant-Friendly · D+10
- County
- — inherits STATE
- City
- — inherits STATE
ZIP-level market 10707
- Active inventory
- 44
- Price-to-rent
- 22.9×
Monthly cashflow live
- Estimated rent
- $9,374 high interval (Pro) →
- Mortgage (P&I)
- −$6,765
- Tax from tax record
- −$1,543 /mo · $18,511/yr
- Insurance
- −$538
- HOA
- −$0
- Vacancy / Maint / Mgmt
- −$1,969
- Net cashflow
- $-1,439
Break-even live
Sensitivity live
| Price | -10% $-709 | -5% $-1,074 | +0% $-1,439 | +5% $-1,805 | +10% $-2,170 |
|---|---|---|---|---|---|
| Rent | -10% $-2,180 | -5% $-1,810 | +0% $-1,439 | +5% $-1,069 | +10% $-699 |
| Rate | -1.0pp $-790 | -0.5pp $-1,111 | base $-1,439 | +0.5pp $-1,774 | +1.0pp $-2,114 |
2-unit breakdown (identical units grouped — click to expand)
| Units | Beds | Baths | Est. rent |
|---|---|---|---|
| 2× units | 3 | 1 | $9,374 |
| #1 | 3 | 1 | $4,687 |
| #2 | 3 | 1 | $4,687 |
| Total (2 units) | $9,374 | ||
UW: 25.0% down · 7.5% · 30yr · 1.5% tax · 5.0% vac · 8.0% maint · 8.0% mgmt
Financing live
Cash to close
- Down payment
- $322,500
- Closing costs
- $38,700
- Reserves months
- —
- Total cash needed
- —
Loan-product check · same deal, 3 products live
Conventional
25% down · 7.5% · 30yr
- Down + closing
- —
- Monthly P&I
- —
- Monthly cashflow
- —
- DSCR
- —
- Eligible?
- —
Personal DTI + credit; lowest rate.
DSCR
20% down · 8.5% · 30yr
- Down + closing
- —
- Monthly P&I
- —
- Monthly cashflow
- —
- DSCR
- —
- Eligible?
- —
No personal income docs; deal must DSCR.
Hard money
10% down · 12.0% · 12mo
- Down + closing
- —
- Monthly P&I
- —
- Monthly cashflow
- —
- DSCR
- —
- Eligible?
- —
Short-term bridge; refi at stabilization.
Rent comps 1 comps
| Address | Beds | Baths | Sqft | Rent | $/sqft | DOM | Units | Dist |
|---|---|---|---|---|---|---|---|---|
| 26 Latimer Ln Bronxville, NY | 5.0 | 4.0 | 3200 | $13,995 | $4.37 | 0d | 1 | 1.49mi |
Listing history 31 events
-
2026-06-21days on market $1,290,000 Active 75 DOM
-
2026-06-18days on market $1,290,000 Active 72 DOM
-
2026-06-17days on market $1,290,000 Active 71 DOM
-
2026-06-16days on market $1,290,000 Active 70 DOM
-
2026-06-15days on market $1,290,000 Active 69 DOM
-
2026-06-13days on market $1,290,000 Active 67 DOM
-
2026-06-09days on market $1,290,000 Active 63 DOM
-
2026-06-08days on market $1,290,000 Active 62 DOM
-
2026-06-07days on market $1,290,000 Active 61 DOM
-
2026-06-04days on market $1,290,000 Active 58 DOM
-
2026-06-03days on market $1,290,000 Active 57 DOM
-
2026-06-02days on market $1,290,000 Active 56 DOM
-
2026-06-01days on market $1,290,000 Active 55 DOM
-
2026-05-31days on market $1,290,000 Active 54 DOM
-
2026-05-16price $1,290,000 1470-char remark
Show marketing remark (1470 chars)
If you’re looking for convenient access to NYC while enjoying a suburban, small-town feel, look no further! This two-family home is ideally located just down the street from the Metro-North train station—only a 1-minute drive or a 5-minute walk to Crestwood, with an approximately 44-minute ride to Grand Central Terminal. The home features a 3-bedroom, 1-bath unit over a second 3-bedroom, 1-bath unit, both with functional and well-designed layouts. Upon entering each unit, you’ll find the kitchen to the front left of you, complete with an adjoining dining area. Wrap around the kitchen & dining area into the living room - it sits just beyond the dining space, while the right side of the unit offers three bedrooms and a full bath. Both units share the same layout, with the first-floor unit offering patio doors that lead to the backyard. The outdoor space, while quaint, is perfect for a grill, table, and seating—ideal for relaxing or entertaining. Additional features include a 1–2 car garage, a driveway with space for an additional vehicle, and a basement currently used for storage but offering great potential to be finished for recreation, a home office, or a workout area. Live in one unit and enjoy the yard, basement, and garage, while renting out the other unit to help offset expenses. Although the home is located in Tuckahoe, it is zoned for the Eastchester school district. Schedule your private showing today!
-
2026-04-05$1,395,000 Active 1470-char remark
Show marketing remark (1470 chars)
If you’re looking for convenient access to NYC while enjoying a suburban, small-town feel, look no further! This two-family home is ideally located just down the street from the Metro-North train station—only a 1-minute drive or a 5-minute walk to Crestwood, with an approximately 44-minute ride to Grand Central Terminal. The home features a 3-bedroom, 1-bath unit over a second 3-bedroom, 1-bath unit, both with functional and well-designed layouts. Upon entering each unit, you’ll find the kitchen to the front left of you, complete with an adjoining dining area. Wrap around the kitchen & dining area into the living room - it sits just beyond the dining space, while the right side of the unit offers three bedrooms and a full bath. Both units share the same layout, with the first-floor unit offering patio doors that lead to the backyard. The outdoor space, while quaint, is perfect for a grill, table, and seating—ideal for relaxing or entertaining. Additional features include a 1–2 car garage, a driveway with space for an additional vehicle, and a basement currently used for storage but offering great potential to be finished for recreation, a home office, or a workout area. Live in one unit and enjoy the yard, basement, and garage, while renting out the other unit to help offset expenses. Although the home is located in Tuckahoe, it is zoned for the Eastchester school district. Schedule your private showing today!
-
2010-11-21historical
-
2010-05-21Active
-
2008-07-12historical
-
2007-08-09
-
2007-02-26historical
-
2006-09-19
-
2006-09-01historical
-
2006-04-17
-
2006-04-14historical
-
2006-02-15
-
2005-12-31historical
-
2005-11-14
-
2005-10-19historical
-
2005-07-19
-
1997-06-26soldstatus $269,000
ⓘ Source: listings_history table (triggers on properties + properties_extension) + one-shot
backfill from property_details.listing_events for pre-trigger history.
Tax reassessment forecast NY · Partial reset (capped growth)
- Current annual tax
- $18,511 · $1,543/mo
- Projected year-2 tax
- $20,156 · $1,680/mo
- Expected delta
- +$1,645/yr (+$137/mo · 8.9%)
ⓘ Screening estimate from a state-policy table — verify with the county assessor before closing.
Climate risk First Street
- Flood 1/10 Low FEMA zone X (unshaded) · 0% chance over 30 yrs
- Wildfire 1/10 Low
- Heat 6/10 Major 7 d/yr ≥99°F today · 15 d/yr by 30 yrs out
- Wind 6/10 Major 27% chance of damaging wind over 30 yrs
- Air quality 4/10 Moderate 3 unhealthy d/yr today · 5 by 30 yrs out
Nearby sold comps map
Loading sold comps map…
Walkable amenities ~0.75 mi
Loading nearby amenities…
Taxation est. · year 1
- Rental income
- $112,488
- − Mortgage interest
- −$72,260
- − Property taxes
- −$18,511
- − Insurance
- −$6,450
- − Repairs & maintenance
- −$8,999
- − Management
- −$8,999
- − Depreciation
- −$37,527
- Taxable loss
- −$40,258
- Est. tax savings @ 24.0%
- +$9,662
- After-tax cash flow
- $-7,612/yr
For passive investors: Depreciation is non-cash, so a rental often shows a tax loss while cash-flowing — sheltering income. Rental losses are passive: they offset passive income freely, and up to $25,000/yr can offset ordinary (W-2) income if you actively participate and your MAGI is under $100k (phasing out to $0 by $150k); unused losses carry forward. On sale, claimed depreciation is recaptured at up to 25%, and gains may owe capital-gains tax (a 1031 exchange can defer both). Figures are a year-1 estimate at your 24.0% rate — not tax advice; consult a CPA.
Schools (NCES district)
- District
- Eastchester Union Free School District
- NCES district ID
- 3610080
- Math proficiency
- 79% ▲ 1.00%
- Reading proficiency
- 80% ▲ 9.00%
- Median HH income
- $96,944
- Composite
- 71.74/100
- National rank
- #216
- State rank
- #42 of 590 in NY
Livability — Tuckahoe
- Score
- 79/100
- State rank
- #125
- US rank
- #2013
Category grades
Schools grade is shown separately in the Schools card above.
Census & demographics
- Census place
- Tuckahoe, NY
- County
- Westchester County · 709,332 people
- City population
- 9,688
- Metro
- New York-Newark-Jersey City, NY-NJ-PA
- Population (ZIP)
- 9,688
- Household income
- $130,957
- Rent vs Own
- Severe rent burden
- 363.0
Population outlook (Westchester County) Hauer SSP2
- Today (2025)
- 1,028,035 people
- By 2030
- 1,051,636 · +2.3%
- By 2040
- 1,098,520 · +6.9%
- By 2050
- 1,136,044 · +10.5%
- By 2075
- 1,196,925 · +16.4%
- By 2100
- 1,175,147 · +14.3%
Race, ethnicity, and origin ACS 2023
- Neighborhood character
- Majority White (64%)
- Race & ethnicity
- White 64% Hispanic / Latino 17% Asian 12% Two or more races 7% Black 4%
- Hispanic origin (detail)
- Mexican 7% Puerto Rican 4% Dominican 1%
- Common ancestry
- Romanian 4% Scotch-Irish 3%
- Foreign-born
- 21% · Canada, South Korea
- Languages at home
- 69% English-only · Spanish 13% Korean 5% Other Indo-European 5%
Political lean MEDSL · Westchester
- 2024 margin
- Strong D (+26.3) · D 63.1% · R 36.9%
- 2008→2024 swing
- -1.3pp toward R · 2008: 27.6pp · 2024: 26.3pp
- All cycles
- 2024: D+26.3 2020: D+36.3 2016: D+32.8 2012: D+22.2 2008: D+27.6
Not yet ingested
- Civics
- —
Market trends
- HPI YoY
- ▼ -479.55%
- Current HPI
- 261.5898
- Rent YoY
- —
- Metro
- New York-Newark-Jersey City, NY-NJ-PA
- State GDP YoY
- ▲ 2.60%
- F500 in state
- 92
Industry mix (Fortune 500 HQ in NY)
| Industry | F500 HQs | Revenue |
|---|---|---|
| Financial Services | 10 | $950B |
|
||
| Consumer Goods | 9 | $162B |
|
||
| Insurance | 4 | $225B |
|
||
| Telecommunications | 2 | $144B |
|
||
| Pharmaceuticals | 2 | $112B |
|
||
| Media / Entertainment | 2 | $69B |
|
||
Price history
+379.6% since first listed17 events — show timeline
- 2026-05-16 Price Changed $1,290,000 OneKey® MLS as Distributed by MLS Grid
- 2026-04-05 Listed $1,395,000 OneKey® MLS as Distributed by MLS Grid
- 2010-11-21 Delisted — HGMLS
- 2010-05-21 Listed — HGMLS
- 2008-07-12 Delisted — HGMLS
- 2007-08-09 Listed — HGMLS
- 2007-02-26 Delisted — HGMLS
- 2006-09-19 Listed — HGMLS
- 2006-09-01 Delisted — HGMLS
- 2006-04-17 Listed — HGMLS
- 2006-04-14 Delisted — HGMLS
- 2006-02-15 Listed — HGMLS
- 2005-12-31 Delisted — HGMLS
- 2005-11-14 Listed — HGMLS
- 2005-10-19 Delisted — HGMLS
- 2005-07-19 Listed — HGMLS
- 1997-06-26 Sold (Public Records) $269,000 Public Records
Property tax history
+2.1%/yrLatest (2025): $18,511 · +3.6% YoY. Source: county tax records.
Cash-flow waterfall
monthlySold comps — $/sqft
last 12 mo · ≤1 miLoading sold comps…