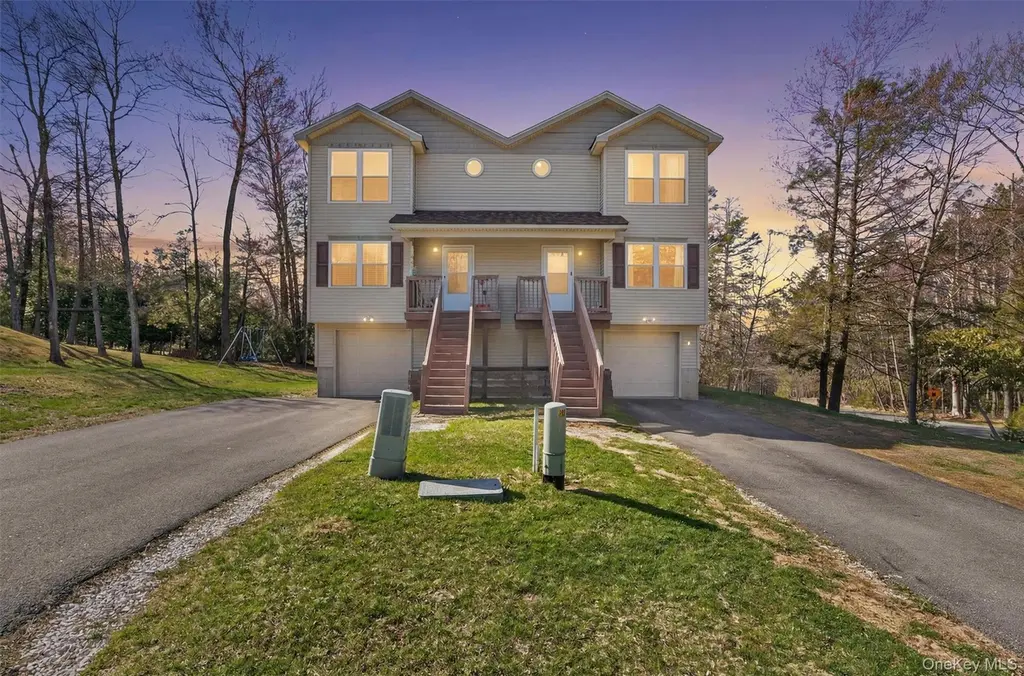
2 Deerfield Ct · Rock Hill, NY
Flood risk 1/10 · Minimal
- FEMA flood zone
- X (unshaded)
- Chance of flooding over 30 yrs
- 0.0%
- Est. flood insurance / yr
- $473 – $860
Fire risk 3/10 · Minor
- Est. fire insurance / yr
- $691 – $1,283
Heat risk 2/10 · Minimal
- Hot days now (above 92°F)
- 7 days/yr
- Hot days in 30 yrs
- 15 days/yr
Wind risk 3/10 · Minor
- Chance of severe wind over 30 yrs
- 7.0%
Air-quality risk 2/10 · Minimal
- Unhealthy air days now
- 1 days/yr
- Unhealthy air days in 30 yrs
- 1 days/yr
Risk factors via First Street. Map © Google.
Why this score? — see what drove the D grade
The composite is a weighted blend of 9 inputs, each scored 0–100. Each bar is that input's sub-score; the figure is the points it added to the 100-point composite (weight × sub-score).
- ARV discount +14.6/15.0
- Appreciation +10.0/10.0
- Cash flow +5.0/30.0
- Livability +3.5/5.0
- Rent growth +2.5/5.0
- Schools +2.5/10.0
- Condition / age +2.5/5.0
- 1% rule +1.3/10.0
- DSCR +0.0/10.0
$359,900
🖨 Deal sheet (PDF) 📄 Offer letter ✓ Due diligence
Listing remarks MLS
Discover the perfect blend of comfort and convenience in this stunning townhouse located in the sought-after Emerald Green Property Owners Association. Nestled just a few steps from the shores of Lake Louise Marie, this home offers the ultimate lakeside lifestyle. Step inside to find a bright, warm interior designed for easy living. The property features 3 bedrooms, 2.5 baths, and a spacious living area. The primary bedroom and the living room share a view of Lake Louise Marie! Emerald Green offers unparalleled amenities, including three lakes (boating[no power boats], fishing, swimming), two swimming pools, a clubhouse with a gym, tennis/pickleball courts, and a dog run. Whether you are looking for a weekend retreat or a full-time home, this property delivers, with easy access to Rock Hill's shopping, dining, and close proximity to hiking trails, Bethel Woods, and Resorts World Casino. All measurements are estimated.
Key facts
- 6,098 sq ft lot
- Garage
- Community pool
Neighborhood map
What this means for you Summary
Snapshot
- This is a 3-bed/2.5-bath townhouse listed at $360k.
Deal economics
- At list price, monthly cash flow is $-842 ($-10k/yr) — negative.
- To cash-flow at today's rent, offer at most $211k (41.3% below list).
- To meet the 1% rule (rent ≥ 1% of price), the offer needs to be $228k (36.8% below list).
- Recommended offer: $211k (41.3% below list) — sets the bar for cash-flow.
- Cap rate 3.5% vs local median 2.6% in Rock Hill — top-decile yield for the area; either an underpriced asset or a hidden risk that comps aren't pricing in. Stress-test before assuming the spread holds.
Location & tenants
- Location reads 69/100 on livability (#478 in NY) — a middle-class / working-renter tenant base. Strengths: crime A+, employment A+, housing A+; Watch: cost of living D+, amenities F, commute F.
- Monticello Central School District (town): math 29% / reading 30% proficiency, ranked #577 of 590 in NY (top 98%) — low school quality limits family demand, transient renter base, plan for 1-2y turnover.
- Zoned schools: Emma C Chase School (math 32% / reading 47%, grade F, #1,444 of 2,108 statewide, top 71%, 228 students, 57% FRL); Robert J Kaiser Middle School (math 7% / reading 35%, grade F, #661 of 729 statewide, top 91%, 595 students, 66% FRL); Monticello High School (math 82% / reading 34%, grade C, #879 of 1,100 statewide, top 80%, 844 students, 63% FRL).
- Market conditions: 62 active listings in the ZIP; 2 comparable units currently listed for rent nearby; 739 units permitted in Sullivan County in 2024 (5 in 5+ unit buildings).
Forward outlook
- In year one you build about $38k of equity ($2k loan paydown + $36k appreciation (10.0% local appreciation)).
- Sullivan County population projected at -24% by 2050 — secular population decline; favor cash flow + early exit over multi-decade hold.
- By year 2, paydown + projected appreciation supports a ~$62k cash-out refi (75% LTV) — recoverable capital for the next deal without selling this one.
Negotiation context
- It's been on market 58 days — a 3% lower offer ($349k) is reasonable based on typical stale-listing flexibility.
- 5 sale attempts since 14y ago with the ask held roughly flat each time — persistent listings suggest the price (not the market) is what's stuck; bring a comps-based counter.
- Current owner paid $200k; list at $360k implies a 80% gain — meaningful room to come down on a strong offer.
Questions for the listing agent
- What do current leases actually rent for vs. the listed asking? Can we see a recent rent roll and the last 12 months of T-12 income?
- It's been on market 58 days. Have you received any prior offers? Is the seller open to a 41% concession, seller financing, or rate buy-down credit?
- What does the HOA fee cover, when was the last increase, and are there any pending special assessments or reserve-fund shortfalls?
- Is there a deadline driving the sale (1031 exchange, divorce, estate, relocation)? That informs how much negotiation room exists.
- The area grade is low — what's the realistic commute time and amenity access for the typical tenant pool here? Any planned neighborhood developments (good or bad) we should know about?
- What's the average days-on-market for RENTAL listings here right now (not sales)? A rising rental-DOM trend means longer vacancies and softer asking-rent achievability than the comps imply.
- What's the recent tenant-quality profile in this submarket — average credit score on applications, eviction rate, late-payment / NSF rate, and stable-employment percentage? A property-management company in the area should have these aggregated.
- How much new for-sale + rental construction is in the pipeline within 1–3 miles? Heavy new supply typically softens prices + rents 12–24 months out; constrained supply supports both.
Investment metrics
- 1% rule
- 0.63% ✗
- Cap rate
- 3.48%
- Cash-on-cash
- -10.03%
- DSCR
- 0.55
- GRM
- 13.2
CMA / ARV
- ARV (median comp)
- $427,156
- List price
- $359,900
- Delta
- -15.75%
- Verdict
- UNDERPRICED
- Comps
- 20 within 1.0 mi
Show comp detail 1 sale within ~0.75 mi
| Address | Dist | Beds/Ba | Sqft | Sold | Price | $/sf | Match |
|---|---|---|---|---|---|---|---|
| 10 Westfield Ct | 0.06mi | 3/2.5 | 1,496 (-4%) | 10mo | $300,000 | $201 | 81 |
Match score weights: distance 35% · size 25% · config 20% · recency 20%. Top-matched comps best support the ARV.
Projected returns pro-forma
10.0% appreciation · 3.0% rent growth · sell at horizon
- IRR
- 17.3%
- Equity multiple
- 2.41×
- Total profit
- $142,486
- Equity at exit
- $324,226
- IRR
- 16.3%
- Equity multiple
- 5.59×
- Total profit
- $462,045
- Equity at exit
- $699,207
Cash invested: $100,772 (down + closing). Projections, not guarantees.
Landlord ↔ Tenant lean methodology
- Overall (STATE)
- 15 Strongly Tenant-Friendly
- State New York
- 15 Strongly Tenant-Friendly · D+10
- County
- — inherits STATE
- City
- — inherits STATE
ZIP-level market 12775
- Home prices YoY
- 2.6%
- Active inventory
- 62
- Price-to-rent
- 13.2×
Monthly cashflow live
- Estimated rent
- $2,276 medium interval (Pro) →
- Mortgage (P&I)
- −$1,887
- Tax from tax record
- −$447 /mo · $5,362/yr
- Insurance
- −$150
- HOA
- −$156
- Vacancy / Maint / Mgmt
- −$478
- Net cashflow
- $-842
Break-even live
Sensitivity live
| Price | -10% $-639 | -5% $-741 | +0% $-842 | +5% $-944 | +10% $-1,046 |
|---|---|---|---|---|---|
| Rent | -10% $-1,022 | -5% $-932 | +0% $-842 | +5% $-753 | +10% $-663 |
| Rate | -1.0pp $-661 | -0.5pp $-751 | base $-842 | +0.5pp $-936 | +1.0pp $-1,031 |
UW: 25.0% down · 7.5% · 30yr · 1.5% tax · 5.0% vac · 8.0% maint · 8.0% mgmt
Financing live
Cash to close
- Down payment
- $89,975
- Closing costs
- $10,797
- Reserves months
- —
- Total cash needed
- —
Loan-product check · same deal, 3 products live
Conventional
25% down · 7.5% · 30yr
- Down + closing
- —
- Monthly P&I
- —
- Monthly cashflow
- —
- DSCR
- —
- Eligible?
- —
Personal DTI + credit; lowest rate.
DSCR
20% down · 8.5% · 30yr
- Down + closing
- —
- Monthly P&I
- —
- Monthly cashflow
- —
- DSCR
- —
- Eligible?
- —
No personal income docs; deal must DSCR.
Hard money
10% down · 12.0% · 12mo
- Down + closing
- —
- Monthly P&I
- —
- Monthly cashflow
- —
- DSCR
- —
- Eligible?
- —
Short-term bridge; refi at stabilization.
Rent comps 2 comps
| Address | Beds | Baths | Sqft | Rent | $/sqft | DOM | Units | Dist |
|---|---|---|---|---|---|---|---|---|
| 15 Norfolk Ct Rock Hill, NY | 4.0 | 2.0 | 1726 | $2,500 | $1.45 | 45d | 1 | 0.75mi |
| 182 Rock Hill Dr Rock Hill, NY | 2.0 | 1.0 | 1416 | $2,000 | $1.41 | 21d | 1 | 0.92mi |
HOA detail
- Monthly dues
- $156 · $1,872/yr
- Likely covers
- poolgym
Listing history 30 events
-
2026-06-21days on market $359,900 Active 58 DOM
-
2026-06-18days on market $359,900 Active 55 DOM
-
2026-06-17days on market $359,900 Active 54 DOM
-
2026-06-16days on market $359,900 Active 53 DOM
-
2026-06-15days on market $359,900 Active 52 DOM
-
2026-06-14days on market $359,900 Active 50 DOM
-
2026-06-10days on market $359,900 Active 47 DOM
-
2026-06-09days on market $359,900 Active 46 DOM
-
2026-06-08days on market $359,900 Active 45 DOM
-
2026-06-07pricedays on market $359,900 Active 44 DOM
-
2026-06-03days on market $369,900 Active 40 DOM
-
2026-06-02days on market $369,900 Active 39 DOM
-
2026-06-01days on market $369,900 Active 38 DOM
-
2026-05-31days on market $369,900 Active 37 DOM
-
2026-05-31days on market $369,900 Active 36 DOM
-
2026-04-25$369,900 Active 934-char remark
Show marketing remark (934 chars)
Discover the perfect blend of comfort and convenience in this stunning townhouse located in the sought-after Emerald Green Property Owners Association. Nestled just a few steps from the shores of Lake Louise Marie, this home offers the ultimate lakeside lifestyle. Step inside to find a bright, warm interior designed for easy living. The property features 3 bedrooms, 2.5 baths, and a spacious living area. The primary bedroom and the living room share a view of Lake Louise Marie! Emerald Green offers unparalleled amenities, including three lakes (boating[no power boats], fishing, swimming), two swimming pools, a clubhouse with a gym, tennis/pickleball courts, and a dog run. Whether you are looking for a weekend retreat or a full-time home, this property delivers, with easy access to Rock Hill's shopping, dining, and close proximity to hiking trails, Bethel Woods, and Resorts World Casino. All measurements are estimated.
-
2026-04-11historical $369,900 934-char remark
Show marketing remark (934 chars)
Discover the perfect blend of comfort and convenience in this stunning townhouse located in the sought-after Emerald Green Property Owners Association. Nestled just a few steps from the shores of Lake Louise Marie, this home offers the ultimate lakeside lifestyle. Step inside to find a bright, warm interior designed for easy living. The property features 3 bedrooms, 2.5 baths, and a spacious living area. The primary bedroom and the living room share a view of Lake Louise Marie! Emerald Green offers unparalleled amenities, including three lakes (boating[no power boats], fishing, swimming), two swimming pools, a clubhouse with a gym, tennis/pickleball courts, and a dog run. Whether you are looking for a weekend retreat or a full-time home, this property delivers, with easy access to Rock Hill's shopping, dining, and close proximity to hiking trails, Bethel Woods, and Resorts World Casino. All measurements are estimated.
-
2021-12-09soldstatus $200,000
-
2019-09-01historical
-
2019-07-31price $184,900
-
2019-06-19price $189,000
-
2019-05-05status Active
-
2019-03-02status Pending
-
2019-02-08$199,900 Active
-
2013-08-14soldstatus $30,000
-
2013-08-14soldstatus $30,000
-
2013-07-30historical
-
2012-06-19$49,000
-
2012-06-19$49,000
-
2000-08-07soldstatus $66,000
ⓘ Source: listings_history table (triggers on properties + properties_extension) + one-shot
backfill from property_details.listing_events for pre-trigger history.
Tax reassessment forecast NY · Partial reset (capped growth)
- Current annual tax
- $5,362 · $447/mo
- Projected year-2 tax
- $5,722 · $477/mo
- Expected delta
- +$360/yr (+$30/mo · 6.7%)
ⓘ Screening estimate from a state-policy table — verify with the county assessor before closing.
Climate risk First Street
- Flood 1/10 Low FEMA zone X (unshaded) · 0% chance over 30 yrs
- Wildfire 3/10 Moderate
- Heat 2/10 Low 7 d/yr ≥92°F today · 15 d/yr by 30 yrs out
- Wind 3/10 Moderate 7% chance of damaging wind over 30 yrs
- Air quality 2/10 Low 1 unhealthy d/yr today · 1 by 30 yrs out
Nearby sold comps map
Loading sold comps map…
Walkable amenities ~0.75 mi
Loading nearby amenities…
Taxation est. · year 1
- Rental income
- $27,307
- − Mortgage interest
- −$20,160
- − Property taxes
- −$5,362
- − Insurance
- −$1,800
- − Repairs & maintenance
- −$2,185
- − Management
- −$2,185
- − HOA
- −$1,872
- − Depreciation
- −$10,470
- Taxable loss
- −$16,725
- Est. tax savings @ 24.0%
- +$4,014
- After-tax cash flow
- $-6,095/yr
For passive investors: Depreciation is non-cash, so a rental often shows a tax loss while cash-flowing — sheltering income. Rental losses are passive: they offset passive income freely, and up to $25,000/yr can offset ordinary (W-2) income if you actively participate and your MAGI is under $100k (phasing out to $0 by $150k); unused losses carry forward. On sale, claimed depreciation is recaptured at up to 25%, and gains may owe capital-gains tax (a 1031 exchange can defer both). Figures are a year-1 estimate at your 24.0% rate — not tax advice; consult a CPA.
Schools (NCES district)
- District
- Monticello Central School District
- NCES district ID
- 3619740
- Math proficiency
- 29% ▼ -4.00%
- Reading proficiency
- 30% ▼ -2.00%
- Median HH income
- $44,696
- Composite
- 25.28/100
- National rank
- #7491
- State rank
- #577 of 590 in NY
Livability — Rock Hill
- Score
- 69/100
- State rank
- #478
- US rank
- #8452
Category grades
Schools grade is shown separately in the Schools card above.
Census & demographics
- Census place
- Rock Hill, NY
- City population
- 2,661
- Population (ZIP)
- 2,661
Population outlook (Sullivan County) Hauer SSP2
- Today (2025)
- 68,974 people
- By 2030
- 65,609 · -4.9%
- By 2040
- 58,878 · -14.6%
- By 2050
- 52,500 · -23.9%
- By 2075
- 39,941 · -42.1%
- By 2100
- 28,880 · -58.1%
Race, ethnicity, and origin ACS 2023
- Neighborhood character
- Predominantly White (68%)
- Race & ethnicity
- White 68% Hispanic / Latino 20% Two or more races 9% Black 5% Asian 4%
- Hispanic origin (detail)
- Puerto Rican 5%
- Common ancestry
- Romanian 5% Italian 4% Scotch-Irish 4%
- Foreign-born
- 17% · Canada, Jamaica
- Languages at home
- 79% English-only · Spanish 16% Other Indo-European 3% Russian/Polish/Slavic 2%
Political lean MEDSL · Sullivan
- 2024 margin
- R (+16.7) · D 41.6% · R 58.4%
- 2008→2024 swing
- -26.2pp toward R · 2008: 9.5pp · 2024: -16.7pp
- All cycles
- 2024: R+16.7 2020: R+9.2 2016: R+13.7 2012: D+10.4 2008: D+9.5
Not yet ingested
- Civics
- —
Market trends
- HPI YoY
- ▲ 11.12%
- Current HPI
- 437.7751
- Rent YoY
- —
- Metro
- —
- State GDP YoY
- ▲ 2.60%
- F500 in state
- 92
Industry mix (Fortune 500 HQ in NY)
| Industry | F500 HQs | Revenue |
|---|---|---|
| Financial Services | 10 | $950B |
|
||
| Consumer Goods | 9 | $162B |
|
||
| Insurance | 4 | $225B |
|
||
| Telecommunications | 2 | $144B |
|
||
| Pharmaceuticals | 2 | $112B |
|
||
| Media / Entertainment | 2 | $69B |
|
||
Price history
+460.5% since first listed15 events — show timeline
- 2026-04-25 Listed $369,900 OneKey® MLS as Distributed by MLS Grid
- 2026-04-11 Coming Soon $369,900 OneKey® MLS as Distributed by MLS Grid
- 2021-12-09 Sold (Public Records) $200,000 Public Records
- 2019-09-01 Listing Removed — OneKey® MLS as Distributed by MLS Grid
- 2019-07-31 Price Changed $184,900 OneKey® MLS as Distributed by MLS Grid
- 2019-06-19 Price Changed $189,000 OneKey® MLS as Distributed by MLS Grid
- 2019-05-05 Relisted — OneKey® MLS as Distributed by MLS Grid
- 2019-03-02 Pending — OneKey® MLS as Distributed by MLS Grid
- 2019-02-08 Listed $199,900 OneKey® MLS as Distributed by MLS Grid
- 2013-08-14 Sold (MLS) $30,000 HGMLS
- 2013-08-14 Sold (MLS) $30,000 OneKey® MLS as Distributed by MLS Grid
- 2013-07-30 Delisted — HGMLS
- 2012-06-19 Listed $49,000 HGMLS
- 2012-06-19 Listed $49,000 OneKey® MLS as Distributed by MLS Grid
- 2000-08-07 Sold (Public Records) $66,000 Public Records
Property tax history
+12.3%/yrLatest (2025): $5,362 · +3.2% YoY. Source: county tax records.
Cash-flow waterfall
monthlySold comps — $/sqft
last 12 mo · ≤1 miLoading sold comps…