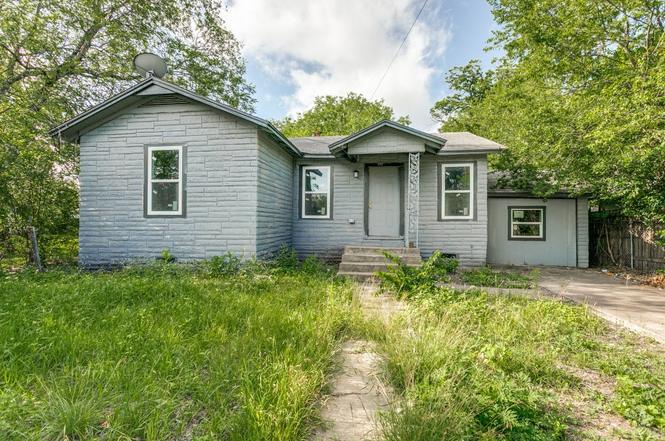
852 Gulf St · San Antonio, TX
Flood risk 1/10 · Minimal
- FEMA flood zone
- X (unshaded)
- Chance of flooding over 30 yrs
- 0.0%
- Est. flood insurance / yr
- $507 – $1,088
Fire risk 1/10 · Minimal
- Est. fire insurance / yr
- $1,222 – $2,270
Heat risk 8/10 · Major
- Hot days now (above 108°F)
- 7 days/yr
- Hot days in 30 yrs
- 22 days/yr
Wind risk 8/10 · Major
- Chance of severe wind over 30 yrs
- 80.0%
Air-quality risk 2/10 · Minimal
- Unhealthy air days now
- 0 days/yr
- Unhealthy air days in 30 yrs
- 2 days/yr
Risk factors via First Street. Map © Google.
Why this score? — see what drove the D- grade
The composite is a weighted blend of 9 inputs, each scored 0–100. Each bar is that input's sub-score; the figure is the points it added to the 100-point composite (weight × sub-score).
- Appreciation +10.0/10.0
- Cash flow +7.5/30.0
- ARV discount +5.7/15.0
- Rent growth +4.5/5.0
- Livability +4.0/5.0
- Condition / age +2.5/5.0
- 1% rule +2.2/10.0
- DSCR +1.6/10.0
- Schools +1.4/10.0
$210,000
🖨 Deal sheet 📄 Offer letter ✓ Due diligence
Listing remarks
This recently renovated 3-bedroom, 1-bath home is a great find on the east side of San Antonio. Updates give the home a clean, refreshed feel while keeping it comfortable and easy to maintain. The layout is functional and welcoming, making it the best option for all different kinds of buyers. Located on the east side, you’re close to major roads, local shops, dining, and everyday conveniences. Whether you’re looking for a move-in-ready place to call home or a property with rental potential, this one checks the boxes.
Key facts
- Local shops dining
- Functional layout
- Recently renovated
Tags
Property features AI
Finance
- Financial info: Lease not considered
Exterior
- Parking: Converted garage (no other dedicated parking indicated); No additional parking
- Utilities: Public water; Public sewer
- Home design: Residential property; Built in 1946; Pillar/post/pier foundation
- Construction: Brick and cement siding exterior; Composition roof
- Exterior features: Asphalt road access; Located in a subdivision
Interior
- Bedrooms: Three bedrooms (all on the first floor); Primary bedroom on the first floor
- Flooring: Plank flooring; Vinyl flooring
- Bathrooms: One full bathroom
- Heating & cooling: Window unit heating; Window unit cooling
- Interior features: Plank and vinyl flooring; Seller disclosure available
Neighborhood map
What this means for you Summary
Snapshot
- This is a 3-bed/1.0-bath single-family listed at $210k.
Deal economics
- At list price, monthly cash flow is $-266 ($-3k/yr) — negative.
- To cash-flow at today's rent, offer at most $163k (22.3% below list).
- To meet the 1% rule (rent ≥ 1% of price), the offer needs to be $151k (28.1% below list).
- Recommended offer: $151k (28.1% below list) — sets the bar for 1% rule.
- Cap rate 4.8% vs local median 3.8% in San Antonio — meaningfully above typical; check what's discounted (condition, days-on-market, listing class) to confirm the premium yield is real.
Location & tenants
- Location reads 80/100 on livability (#31 in TX, #1,616 nationally) — a professional / high-income tenant draw. Strengths: amenities A+, commute A+, cost of living A+; Watch: crime F.
- San Antonio ISD (urban): math 12% / reading 22% proficiency, ranked #805 of 826 in TX (top 98%) — low school quality limits family demand, transient renter base, plan for 1-2y turnover; 80% free/reduced lunch — lower-income household profile, screen leases tightly.
- Zoned schools: Davis Middle (math 5% / reading 15%, grade F, #1,641 of 1,662 statewide, top 99%, 545 students, 96% FRL, charter); Houston H S (math 12% / reading 18%, grade F, #1,507 of 1,632 statewide, top 93%, 856 students, 95% FRL) — zoned schools average 96% FRL vs 80% district-wide (16 pts higher); higher-poverty schools than district average — tighter screening recommended.
- Market conditions: Rents rising fast (+8.2%/yr); 196 active listings in the ZIP; 40 comparable units currently listed for rent nearby; rentals at typical pace (median 24d on market — plan ~3-4 weeks tenant-placement turnaround); 8,308 units permitted in Bexar County in 2024 (2,506 in 5+ unit buildings).
- This rent runs 38% of the median local income ($47k/yr) — at the standard rent-burdened threshold; future hikes will face affordability resistance.
Forward outlook
- In year one you build about $22k of equity ($1k loan paydown + $21k appreciation (10.0% local appreciation)).
- Bexar County population projected at +50% by 2050 — long-run rental-demand tailwind backs the buy-and-hold thesis.
- By year 2, paydown + projected appreciation supports a ~$36k cash-out refi (75% LTV) — recoverable capital for the next deal without selling this one.
Negotiation context
- It's been on market 32 days — a 3% lower offer ($204k) is reasonable based on typical stale-listing flexibility.
- 3 sale attempts since 2y ago with the ask held roughly flat each time — persistent listings suggest the price (not the market) is what's stuck; bring a comps-based counter.
Risks & watch-outs
- Watch-outs: built in 1946 — expect roof / HVAC / electrical / plumbing capex.
- Climate carrying-cost: severe wind risk, 80% chance of damaging wind over 30y; extreme-heat days projected 7→22/yr by 2055 (HVAC capex compounding) — expect insurance premiums to compound above CPI over the hold.
Questions for the listing agent
- What do current leases actually rent for vs. the listed asking? Can we see a recent rent roll and the last 12 months of T-12 income?
- It's been on market 32 days. Have you received any prior offers? Is the seller open to a 28% concession, seller financing, or rate buy-down credit?
- Built in 1946 — when were the roof, HVAC, electrical panel, plumbing, and water heater last replaced?
- Is there a deadline driving the sale (1031 exchange, divorce, estate, relocation)? That informs how much negotiation room exists.
- Crime grade is F in this area — have there been break-ins, vandalism, or insurance claims at this property in the last 3 years? What carrier currently insures it and at what premium?
- The area grade is low — what's the realistic commute time and amenity access for the typical tenant pool here? Any planned neighborhood developments (good or bad) we should know about?
- What's the average days-on-market for RENTAL listings here right now (not sales)? A rising rental-DOM trend means longer vacancies and softer asking-rent achievability than the comps imply.
- What's the recent tenant-quality profile in this submarket — average credit score on applications, eviction rate, late-payment / NSF rate, and stable-employment percentage? A property-management company in the area should have these aggregated.
- How much new for-sale + rental construction is in the pipeline within 1–3 miles? Heavy new supply typically softens prices + rents 12–24 months out; constrained supply supports both.
Investment metrics
- 1% rule
- 0.72% ✗
- Cap rate
- 4.77%
- Cash-on-cash
- -5.42%
- DSCR
- 0.76
- GRM
- 11.6
CMA / ARV
- ARV (on-the-fly)
- $202,080
- Comps found
- 12
Show comp detail 12 sales within ~0.75 mi
| Address | Dist | Beds/Ba | Sqft | Sold | Price | $/sf | Match |
|---|---|---|---|---|---|---|---|
| 2111 Lamar | 0.38mi | 3/1.0 | 1,238 (-2%) | 5mo | $62,500 | $50 | 75 |
| 2131 Burnet | 0.31mi | 3/2.0 | 1,312 (+4%) | 4mo | $210,000 | $160 | 72 |
| 1410 Paso Hondo | 0.41mi | 3/2.0 | 1,219 (-4%) | 4mo | $159,000 | $130 | 68 |
| 2846 Wyoming St | 0.58mi | 3/2.0 | 1,255 (-1%) | 1mo | $185,000 | $147 | 67 |
| 623 Belmont | 0.36mi | 3/2.0 | 1,355 (+7%) | 0mo | $230,000 | $170 | 67 |
| 2628 E Commerce | 0.48mi | 3/2.0 | 1,271 (+1%) | 7mo | $270,000 | $212 | 66 |
| 2031 E Crockett | 0.24mi | 2/1.0 (-1) | 1,416 (+12%) | 1mo | $79,900 | $56 | 63 |
| 1719 Dawson St | 0.57mi | 3/2.0 | 1,210 (-4%) | 4mo | $210,000 | $174 | 59 |
| 1048 Gibbs | 0.74mi | 3/2.0 | 1,280 (+1%) | 1mo | $249,000 | $195 | 58 |
| 910 Potomac | 0.43mi | 3/2.0 | 1,390 (+10%) | 2mo | $130,000 | $94 | 57 |
| 2118 Burnet | 0.30mi | 3/2.5 | 1,088 (-14%) | 3mo | $130,000 | $119 | 54 |
| 1838 E Crockett | 0.47mi | 2/2.0 (-1) | 1,445 (+14%) | 8mo | $289,000 | $200 | 39 |
Match score weights: distance 35% · size 25% · config 20% · recency 20%. Top-matched comps best support the ARV.
Projected returns pro-forma
10.0% appreciation · 8.0% rent growth · sell at horizon
- IRR
- 21.9%
- Equity multiple
- 2.79×
- Total profit
- $105,462
- Equity at exit
- $189,185
- IRR
- 20.9%
- Equity multiple
- 6.85×
- Total profit
- $343,708
- Equity at exit
- $407,984
Cash invested: $58,800 (down + closing). Projections, not guarantees.
Landlord ↔ Tenant lean methodology
- Overall (STATE)
- 87 Strongly Landlord-Friendly
- State Texas
- 87 Strongly Landlord-Friendly · R+5
- County
- — inherits STATE
- City
- — inherits STATE
ZIP-level market 78202
- Home prices YoY
- 27.0%
- Rents YoY
- 8.2%
- Active inventory
- 196
- Price-to-rent
- 11.6×
Monthly cashflow live
- Estimated rent
- $1,511 high interval (Pro) →
- Mortgage (P&I)
- −$1,101
- Tax from tax record
- −$270 /mo · $3,244/yr
- Insurance
- −$88
- HOA
- −$0
- Vacancy / Maint / Mgmt
- −$317
- Net cashflow
- $-266
Break-even live
UW: 25.0% down · 7.5% · 30yr · 1.5% tax · 5.0% vac · 8.0% maint · 8.0% mgmt
Financing live
Cash to close
- Down payment
- $52,500
- Closing costs
- $6,300
- Reserves months
- —
- Total cash needed
- —
Loan-product check · same deal, 3 products live
Conventional
25% down · 7.5% · 30yr
- Down + closing
- —
- Monthly P&I
- —
- Monthly cashflow
- —
- DSCR
- —
- Eligible?
- —
Personal DTI + credit; lowest rate.
DSCR
20% down · 8.5% · 30yr
- Down + closing
- —
- Monthly P&I
- —
- Monthly cashflow
- —
- DSCR
- —
- Eligible?
- —
No personal income docs; deal must DSCR.
Hard money
10% down · 12.0% · 12mo
- Down + closing
- —
- Monthly P&I
- —
- Monthly cashflow
- —
- DSCR
- —
- Eligible?
- —
Short-term bridge; refi at stabilization.
Rent comps 40 comps
| Address | Beds | Baths | Sqft | Rent | $/sqft | DOM | Units | Dist |
|---|---|---|---|---|---|---|---|---|
| 906 Gulf St Unit 102 San Antonio, TX | 3.0 | 2.0 | 1300 | $1,750 | $1.35 | 4d | 1 | 0.05mi |
| 1650 Gorman San Antonio, TX | 2.0 | 1.0 | 950 | $1,111 | $1.17 | 23d | 1 | 0.06mi |
| 1622 Gorman San Antonio, TX | 3.0 | 2.0 | 1189 | $1,325 | $1.11 | 17d | 1 | 0.08mi |
| 2818 E Houston St San Antonio, TX | 3.0 | 1.0 | 1184 | $1,495 | $1.26 | 14d | 1 | 0.11mi |
| 1510 Gorman San Antonio, TX | 2.0 | 1.0 | 996 | $1,300 | $1.31 | 17d | 1 | 0.18mi |
| 2239 Burnet St San Antonio, TX | 3.0 | 2.0 | 1097 | $1,450 | $1.32 | 43d | 1 | 0.22mi |
| 1414 Gorman San Antonio, TX | 2.0 | 1.0 | 900 | $1,175 | $1.31 | 43d | 1 | 0.23mi |
| 706 Canton San Antonio, TX | 2.0 | 1.0 | 994 | $1,545 | $1.55 | 23d | 1 | 0.28mi |
| 2118 Burnet St San Antonio, TX | 3.0 | 2.0 | 1008 | $1,650 | $1.64 | 3d | 1 | 0.29mi |
| 639 Canton San Antonio, TX | 2.0 | 1.0 | 1008 | $1,295 | $1.28 | 43d | 1 | 0.32mi |
| 1435 Gibbs San Antonio, TX | 3.0 | 1.0 | 975 | $1,435 | $1.47 | 23d | 1 | 0.33mi |
| 2006 Hays St San Antonio, TX | 3.0 | 2.0 | 1176 | $1,750 | $1.49 | 20d | 1 | 0.36mi |
| 2142 Lamar St San Antonio, TX | 2.0 | 1.0 | 900 | $1,100 | $1.22 | 43d | 1 | 0.37mi |
| 607 Gulf San Antonio, TX | 3.0 | 2.0 | 1482 | $1,395 | $0.94 | 23d | 1 | 0.38mi |
| 610 Belmont San Antonio, TX | 2.0 | 1.0 | 1050 | $1,195 | $1.14 | 43d | 1 | 0.41mi |
| 1223 N Walters St Unit 710 San Antonio, TX | 2.0 | 2.0 | 970 | $1,047 | $1.08 | 3d | 1 | 0.43mi |
| 518 Rotary San Antonio, TX | 3.0 | 1.0 | 1080 | $1,225 | $1.13 | 14d | 1 | 0.52mi |
| 817 Potomac San Antonio, TX | 3.0 | 2.5 | 1508 | $1,795 | $1.19 | 23d | 1 | 0.52mi |
| 1827 Montana St #101 San Antonio, TX | 3.0 | 2.5 | 1859 | $2,250 | $1.21 | 2d | 1 | 0.53mi |
| 452 Gulf San Antonio, TX | 3.0 | 1.0 | 1244 | $1,899 | $1.53 | 21d | 1 | 0.54mi |
| 1104 N Gevers St San Antonio, TX | 3.0 | 2.5 | 1276 | $1,725 | $1.35 | 43d | 1 | 0.55mi |
| 2332 E Houston St San Antonio, TX | 3.0 | 2.0 | 1652 | $1,550 | $0.94 | 23d | 1 | 0.59mi |
| 227 S Grimes St Unit 202 San Antonio, TX | 3.0 | 2.5 | 1089 | $1,550 | $1.42 | 43d | 1 | 0.60mi |
| 1727 E Crockett St San Antonio, TX | 3.0 | 3.0 | 1819 | $1,725 | $0.95 | 20d | 1 | 0.62mi |
| 1723 E Crockett St San Antonio, TX | 3.0 | 3.0 | 1819 | $1,800 | $0.99 | 23d | 1 | 0.63mi |
| 314 Maryland St Unit 102 San Antonio, TX | 2.0 | 2.5 | 1055 | $1,295 | $1.23 | 43d | 1 | 0.69mi |
| 418 Lockhart San Antonio, TX | 4.0 | 2.0 | 1479 | $1,799 | $1.22 | 21d | 1 | 0.69mi |
| 418 Lockhart St Unit 1 San Antonio, TX | 4.0 | 2.0 | 1479 | $1,590 | $1.08 | 43d | 1 | 0.69mi |
| 1111 Gibbs San Antonio, TX | 3.0 | 2.0 | 1476 | $1,595 | $1.08 | 23d | 1 | 0.70mi |
| 323 Gabriel San Antonio, TX | 3.0 | 2.0 | 1400 | $1,950 | $1.39 | 21d | 1 | 0.70mi |
| 323 Gabriel Unit 1 201 San Antonio, TX | 2.0 | 2.5 | 1000 | $1,375 | $1.38 | 43d | 1 | 0.70mi |
| 323 Gabriel San Antonio, TX | 2.0 | 2.0 | 1000 | $1,375 | $1.38 | 23d | 1 | 0.70mi |
| 323 Gabriel Unit 1 101 San Antonio, TX | 3.0 | 2.5 | 1400 | $1,950 | $1.39 | 23d | 1 | 0.70mi |
| 1101 Gibbs San Antonio, TX | 3.0 | 1.0 | 1100 | $1,345 | $1.22 | 14d | 1 | 0.71mi |
| 1101 Gibbs San Antonio, TX | 3.0 | 1.0 | 1100 | $1,345 | $1.22 | 23d | 1 | 0.71mi |
| 2346 Dakota St Unit 1101 San Antonio, TX | 2.0 | 1.0 | 1728 | $1,250 | $0.72 | 16d | 1 | 0.73mi |
| 1615 Nolan St Unit A San Antonio, TX | 2.0 | 1.0 | 1066 | $1,400 | $1.31 | 10d | 1 | 0.76mi |
| 1010 Locke St Unit 710 San Antonio, TX | 2.0 | 2.0 | 950 | $879 | $0.93 | 3d | 1 | 0.77mi |
| 311 Spriggsdale Ave Unit 710 San Antonio, TX | 2.0 | 2.0 | 890 | $981 | $1.10 | 3d | 1 | 0.77mi |
| 1414 Burleson San Antonio, TX | 4.0 | 2.0 | 1769 | $2,000 | $1.13 | 43d | 1 | 0.79mi |
Listing history 22 events
-
2026-06-18days on market $210,000 Active 32 DOM
-
2026-06-17days on market $210,000 Active 31 DOM
-
2026-06-16days on market $210,000 Active 30 DOM
-
2026-06-15days on market $210,000 Active 29 DOM
-
2026-06-13days on market $210,000 Active 27 DOM
-
2026-06-09days on market $210,000 Active 23 DOM
-
2026-06-08days on market $210,000 Active 22 DOM
-
2026-06-07days on market $210,000 Active 21 DOM
-
2026-06-04days on market $210,000 Active 18 DOM
-
2026-06-03days on market $210,000 Active 17 DOM
-
2026-06-02days on market $210,000 Active 16 DOM
-
2026-06-01days on market $210,000 Active 15 DOM
-
2026-05-31days on market $210,000 Active 14 DOM
-
2026-05-19status Active
-
2026-02-26$210,000 Active
-
2026-02-26historical
-
2024-12-10soldstatus
-
2024-12-02soldstatus
-
2024-11-20historical
-
2024-11-02$78,000 New
-
2024-10-18soldstatus
-
2023-12-19soldstatus
ⓘ Source: listings_history table (triggers on properties + properties_extension) + one-shot
backfill from property_details.listing_events for pre-trigger history.
Tax reassessment forecast TX · Resets to sale price
- Current annual tax
- $3,244 · $270/mo
- Projected year-2 tax
- $3,843 · $320/mo
- Expected delta
- +$599/yr (+$50/mo · 18.5%)
ⓘ Screening estimate from a state-policy table — verify with the county assessor before closing.
Climate risk First Street
- Flood 1/10 Low FEMA zone X (unshaded) · 0% chance over 30 yrs
- Wildfire 1/10 Low
- Heat 8/10 Severe 7 d/yr ≥108°F today · 22 d/yr by 30 yrs out
- Wind 8/10 Severe 80% chance of damaging wind over 30 yrs
- Air quality 2/10 Low 0 unhealthy d/yr today · 2 by 30 yrs out
Nearby sold comps map
Loading sold comps map…
Walkable amenities ~0.75 mi
Loading nearby amenities…
Taxation est. · year 1
- Rental income
- $18,128
- − Mortgage interest
- −$11,763
- − Property taxes
- −$3,244
- − Insurance
- −$1,050
- − Repairs & maintenance
- −$1,450
- − Management
- −$1,450
- − Depreciation
- −$6,109
- Taxable loss
- −$6,939
- Est. tax savings @ 24.0%
- +$1,665
- After-tax cash flow
- $-1,523/yr
For passive investors: Depreciation is non-cash, so a rental often shows a tax loss while cash-flowing — sheltering income. Rental losses are passive: they offset passive income freely, and up to $25,000/yr can offset ordinary (W-2) income if you actively participate and your MAGI is under $100k (phasing out to $0 by $150k); unused losses carry forward. On sale, claimed depreciation is recaptured at up to 25%, and gains may owe capital-gains tax (a 1031 exchange can defer both). Figures are a year-1 estimate at your 24.0% rate — not tax advice; consult a CPA.
Schools (NCES district)
- District
- San Antonio ISD
- NCES district ID
- 4838730
- Math proficiency
- 12% ▼ -21.00%
- Reading proficiency
- 22% ▼ -7.00%
- Median HH income
- $30,952
- Composite
- 13.57/100
- National rank
- #9512
- State rank
- #805 of 826 in TX
Livability — San Antonio
- Score
- 80/100
- State rank
- #31
- US rank
- #1616
Category grades
Schools grade is shown separately in the Schools card above.
Census & demographics
- Census place
- San Antonio, TX
- County
- Bexar County · 1,990,555 people
- City population
- 1,806,925
- Metro
- San Antonio-New Braunfels, TX
- Population (ZIP)
- 10,224
- Household income
- $47,478
- Rent vs Own
- Severe rent burden
- 543.0
Population outlook (Bexar County) Hauer SSP2
- Today (2025)
- 2,336,851 people
- By 2030
- 2,560,728 · +9.6%
- By 2040
- 3,020,569 · +29.3%
- By 2050
- 3,493,522 · +49.5%
- By 2075
- 4,668,459 · +99.8%
- By 2100
- 5,533,242 · +136.8%
Race, ethnicity, and origin ACS 2023
- Neighborhood character
- Predominantly Hispanic (66%)
- Race & ethnicity
- Hispanic / Latino 66% Two or more races 28% White 17% Black 16% Native American 1%
- Hispanic origin (detail)
- Mexican 57% Puerto Rican 1% Cuban 1%
- Common ancestry
- Italian 2% Slovak 1%
- Foreign-born
- 14% · Canada
- Languages at home
- 59% English-only · Spanish 41%
Political lean MEDSL · Bexar
- 2024 margin
- Lean D (+9.8) · D 54.3% · R 44.6% · Other 1.1%
- 2008→2024 swing
- +4.2pp toward D · 2008: 5.6pp · 2024: 9.8pp
- All cycles
- 2024: D+9.8 2020: D+18.2 2016: D+13.5 2012: D+4.6 2008: D+5.6
Not yet ingested
- Civics
- —
Market trends
- HPI YoY
- ▲ 53.82%
- Current HPI
- 253.3196
- Rent YoY
- ▲ 8.20%
- Metro
- San Antonio-New Braunfels, TX
- State GDP YoY
- ▲ 3.95%
- F500 in state
- 110
Industry mix (Fortune 500 HQ in TX)
| Industry | F500 HQs | Revenue |
|---|---|---|
| Energy | 16 | $1,198B |
|
||
| Technology | 5 | $198B |
|
||
| Engineering / Construction | 4 | $72B |
|
||
| Energy Services | 3 | $60B |
|
||
| Utilities | 3 | $41B |
|
||
| Healthcare | 2 | $330B |
|
||
Price history
+169.2% since first listed9 events — show timeline
- 2026-05-19 Relisted — HARMLS
- 2026-02-26 Listing Removed — HARMLS
- 2026-02-26 Listed $210,000 HARMLS
- 2024-12-10 Sold (Public Records) — Public Records
- 2024-12-02 Sold (Public Records) — Public Records
- 2024-11-20 Listing Removed — LERA
- 2024-11-02 Listed $78,000 LERA
- 2024-10-18 Sold (Public Records) — Public Records
- 2023-12-19 Sold (Public Records) — Public Records
Property tax history
+6.9%/yrLatest (2025): $3,244 · -2.1% YoY. Source: county tax records.
Cash-flow waterfall
monthlySold comps — $/sqft
last 12 mo · ≤1 miLoading sold comps…