3101 N Country Club Dr #102 · Aventura, FL
Flood risk 7/10 · Major
- FEMA flood zone
- AE
- Chance of flooding over 30 yrs
- 0.77%
- Est. flood insurance / yr
- $1,737 – $8,500
Fire risk 1/10 · Minimal
- Est. fire insurance / yr
- $947 – $1,759
Heat risk 10/10 · Severe
- Hot days now (above 103°F)
- 7 days/yr
- Hot days in 30 yrs
- 26 days/yr
Wind risk 10/10 · Severe
- Chance of severe wind over 30 yrs
- 99.0%
Air-quality risk 2/10 · Minimal
- Unhealthy air days now
- 1 days/yr
- Unhealthy air days in 30 yrs
- 2 days/yr
Risk factors via First Street. Map © Google.
Why this score? — see what drove the C+ grade
The composite is a weighted blend of 9 inputs, each scored 0–100. Each bar is that input's sub-score; the figure is the points it added to the 100-point composite (weight × sub-score).
- Cash flow +25.5/30.0
- 1% rule +10.0/10.0
- DSCR +8.5/10.0
- ARV discount +7.5/15.0
- Schools +4.2/10.0
- Livability +4.0/5.0
- Condition / age +2.5/5.0
- Rent growth +2.1/5.0
- Appreciation +0.0/10.0
$249,000
🖨 Deal sheet (PDF) 📄 Offer letter ✓ Due diligence
Listing remarks MLS
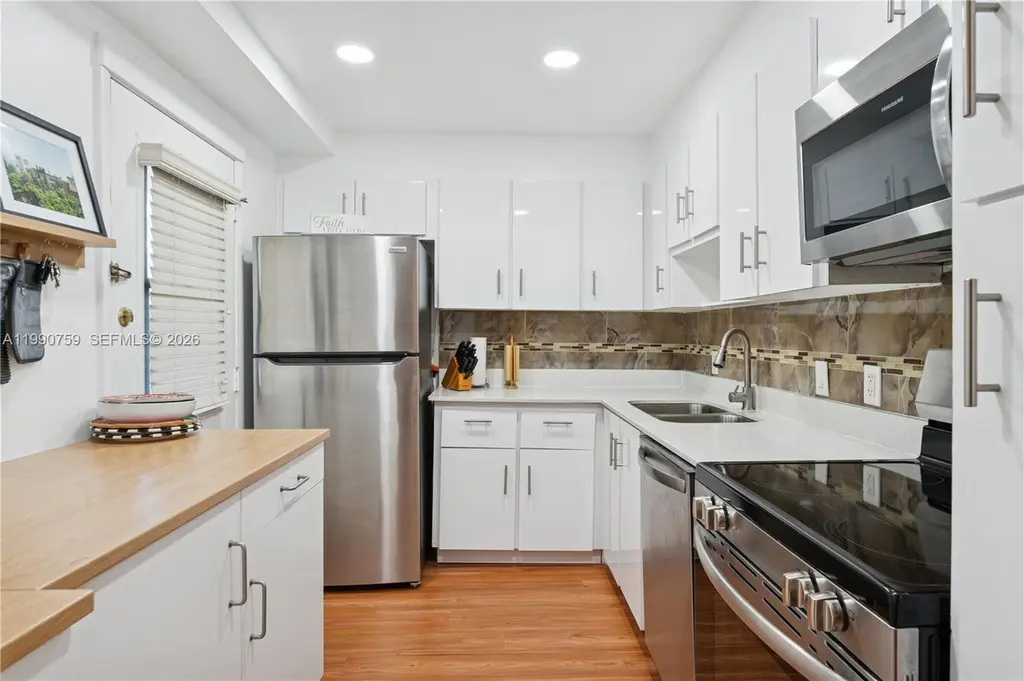
Beautiful, spacious and renovated 2/2 in heart of Aventura, a lot of natural light, nice and relaxing view, laundry room & bike Storage, walking distance to the Aventura mall, shopping centers, supermarkets, pharmacies and beaches.Only Animal support or service animals are okay, No rent first 2 years.
Key facts
- Wraparound balcony
- Garden views
- Corner unit
Tags
Property features AI
Finance
- Financial info: Pets allowed with restrictions or conditions
- HOA & community: Monthly association fee; Association amenities include bike storage, clubhouse, fitness center, laundry, pool, and elevator(s); Association fee covers common areas, cable TV, insurance, internet, laundry, grounds and structure maintenance, parking, pool(s), recreation facilities, roof, sewer, trash and water
Exterior
- Parking: Detached garage; Guest parking; One assigned space
- Security: Closed-circuit cameras; Intercom; Security guard; Smoke detectors
- Utilities: Cable available
- Home design: Southeast-facing; Entry on level 1; Updated/remodeled; Attached property; Single-story unit (building has multiple stories)
- Construction: Block construction; Resale property
- Exterior features: Balcony; Screened balcony; Wrap-around balcony/porch; Porch; Storm/security shutters; Association pool
Interior
- Kitchen: Dishwasher; Electric range; Self-cleaning oven; Microwave; Refrigerator; Disposal
- Bedrooms: Bedroom located on the main level
- Flooring: Laminate; Tile
- Bathrooms: 2 full bathrooms
- Heating & cooling: Central heating (electric); Central air (electric)
- Interior features: Accessible approach with ramp; Dual sinks; First-floor entry; Living/dining room; Main living area on entry level; Split bedrooms; Walk-in closet(s); Bedroom on main level
- Laundry & utility: Common area laundry
Neighborhood map
What this means for you Summary
Snapshot
- This is a 2-bed/2.0-bath condo listed at $249k.
Deal economics
- At list price, monthly cash flow is $158 ($2k/yr) — positive.
- The deal already cash-flows at list — no discount required.
- Meets the 1% rule at list price ($4k rent vs $249k).
- Recommended offer: $234k (6.0% below list) — sets the bar for market timing.
- Cap rate 9.1% vs local median 2.6% in Aventura — top-decile yield for the area; either an underpriced asset or a hidden risk that comps aren't pricing in. Stress-test before assuming the spread holds.
Location & tenants
- Location reads 80/100 on livability (#127 in FL, #1,834 nationally) — a professional / high-income tenant draw. Strengths: health & safety A+, amenities A, commute A; Watch: crime D+, cost of living F.
- Miami-Dade (suburban): math 45% / reading 54% proficiency, ranked #40 of 73 in FL (top 55%) — families likely to look elsewhere, expect single-tenant / working-renter base with shorter leases; 64% free/reduced lunch — lower-income household profile, screen leases tightly.
- Zoned schools: Aventura Waterways K-8 Center (math 56% / reading 65%, grade B-, #664 of 2,144 statewide, top 32%, 2,168 students, 32% FRL); Highland Oaks Middle School (math 28% / reading 51%, grade F, #373 of 571 statewide, top 66%, 774 students, 50% FRL); Dr. Michael M. Krop Senior High (math 21% / reading 46%, grade F, #400 of 667 statewide, top 61%, 2,235 students, 49% FRL) — zoned schools average 44% FRL vs 64% district-wide (20 pts lower); this property's tenant base skews higher-income than the district average.
- Market conditions: Rents soft (-1.5%/yr); 993 active listings in the ZIP; 39 comparable units currently listed for rent nearby; rentals at typical pace (median 17d on market — plan ~3-4 weeks tenant-placement turnaround); solid renter incomes; 10,051 units permitted in Miami-Dade County in 2024 (7,758 in 5+ unit buildings).
- At $3,945/mo this rent would consume 52% of the median local household income ($91k/yr) (locally 1838% of renters already pay >50% of income on rent) — very limited rent-growth headroom before tenants either downsize or default.
Forward outlook
- Local home prices are declining (-3.0%/yr); year-one equity from $2k of loan paydown is wiped out by about $7k of value loss. Plan a longer hold.
- Miami-Dade County population projected at +28% by 2050 — long-run rental-demand tailwind backs the buy-and-hold thesis.
Negotiation context
- It's been on market 81 days — a 6% lower offer ($234k) is reasonable based on typical stale-listing flexibility.
- 5 sale attempts since 3y ago with the ask held roughly flat each time — persistent listings suggest the price (not the market) is what's stuck; bring a comps-based counter.
Risks & watch-outs
- Watch-outs: flood insurance adds $427/mo; HOA is 23% of rent.
- Climate carrying-cost: in FEMA flood zone AE (mandatory federal flood insurance); severe wind risk, 99% chance of damaging wind over 30y; extreme-heat days projected 7→26/yr by 2055 (HVAC capex compounding) — expect insurance premiums to compound above CPI over the hold.
Questions for the listing agent
- It's been on market 81 days. Have you received any prior offers? Is the seller open to a 6% concession, seller financing, or rate buy-down credit?
- Built in 1972 — when were the roof, HVAC, electrical panel, plumbing, and water heater last replaced?
- What's the actual annual flood-insurance premium (NFIP or private), and is the property in a SFHA with mandatory coverage?
- What does the HOA fee cover, when was the last increase, and are there any pending special assessments or reserve-fund shortfalls?
- Any open or pending special assessments — roof, HVAC, plumbing, elevator, façade? What's the per-unit balance and payoff schedule, and is the seller paying it off at close or rolling it to the buyer?
- Why hasn't it sold? Are there any deal-killer items the seller is aware of (foundation, flood, title, zoning, code violations)?
- Is there a deadline driving the sale (1031 exchange, divorce, estate, relocation)? That informs how much negotiation room exists.
- Schools are A-rated — typically a magnet for longer-tenancy family renters. What's the average tenant stay here, and is there a school-zone premium baked into asking?
- Crime grade is D in this area — have there been break-ins, vandalism, or insurance claims at this property in the last 3 years? What carrier currently insures it and at what premium?
- What's the average days-on-market for RENTAL listings here right now (not sales)? A rising rental-DOM trend means longer vacancies and softer asking-rent achievability than the comps imply.
- What's the recent tenant-quality profile in this submarket — average credit score on applications, eviction rate, late-payment / NSF rate, and stable-employment percentage? A property-management company in the area should have these aggregated.
- How much new apartment / multifamily construction is in the pipeline within 1–3 miles? Heavy new supply (>2% of stock underway) typically softens rents 12–24 months out; light construction supports rent growth.
Investment metrics
- 1% rule
- 1.58% ✓
- Cap rate
- 9.11%
- Cash-on-cash
- 10.06%
- DSCR
- 1.45
- GRM
- 5.3
CMA / ARV
No comps found within radius.
Projected returns pro-forma
-3.0% appreciation · 0.0% rent growth · sell at horizon
- IRR
- -17.5%
- Equity multiple
- 0.41×
- Total profit
- $-41,032
- Equity at exit
- $37,127
- IRR
- -24.4%
- Equity multiple
- 0.08×
- Total profit
- $-64,129
- Equity at exit
- $21,529
Cash invested: $69,720 (down + closing). Projections, not guarantees.
Landlord ↔ Tenant lean methodology
- Overall (STATE)
- 87 Strongly Landlord-Friendly
- State Florida
- 87 Strongly Landlord-Friendly · R+3
- County
- — inherits STATE
- City
- — inherits STATE
ZIP-level market 33180
- Rents YoY
- -1.5%
- Active inventory
- 993
- Price-to-rent
- 5.3×
Monthly cashflow live
- Estimated rent
- $3,945 high interval (Pro) →
- Mortgage (P&I)
- −$1,306
- Tax from tax record
- −$219 /mo · $2,626/yr
- Insurance
- −$104
- Flood insurance flood zone
- −$427 /mo · $5,118/yr
- HOA
- −$904
- Vacancy / Maint / Mgmt
- −$829
- Net cashflow
- $158
Break-even live
Sensitivity live
| Price | -10% $299 | -5% $228 | +0% $158 | +5% $87 | +10% $17 |
|---|---|---|---|---|---|
| Rent | -10% $-154 | -5% $2 | +0% $158 | +5% $314 | +10% $470 |
| Rate | -1.0pp $283 | -0.5pp $221 | base $158 | +0.5pp $93 | +1.0pp $28 |
UW: 25.0% down · 7.5% · 30yr · 1.5% tax · 5.0% vac · 8.0% maint · 8.0% mgmt
Financing live
Cash to close
- Down payment
- $62,250
- Closing costs
- $7,470
- Reserves months
- —
- Total cash needed
- —
Loan-product check · same deal, 3 products live
Conventional
25% down · 7.5% · 30yr
- Down + closing
- —
- Monthly P&I
- —
- Monthly cashflow
- —
- DSCR
- —
- Eligible?
- —
Personal DTI + credit; lowest rate.
DSCR
20% down · 8.5% · 30yr
- Down + closing
- —
- Monthly P&I
- —
- Monthly cashflow
- —
- DSCR
- —
- Eligible?
- —
No personal income docs; deal must DSCR.
Hard money
10% down · 12.0% · 12mo
- Down + closing
- —
- Monthly P&I
- —
- Monthly cashflow
- —
- DSCR
- —
- Eligible?
- —
Short-term bridge; refi at stabilization.
Rent comps 39 comps
| Address | Beds | Baths | Sqft | Rent | $/sqft | DOM | Units | Dist |
|---|---|---|---|---|---|---|---|---|
| 223 SW 10th St Hallandale Beach, FL | 3.0 | 3.0 | 1289 | $3,900 | $3.03 | 26d | 1 | 0.99mi |
| 215 SE 5th St Hallandale Beach, FL | 2.0–3.0 | 2.0 | 1133 | $2,700 | $2.38 | 26d | 5 | 1.03mi |
| 707 SW 3rd Ave Hallandale Beach, FL | 3.0 | 2.0 | 1369 | $5,500 | $4.02 | 7d | 1 | 1.09mi |
| 211 SE 4th St #3 Hallandale Beach, FL | 3.0 | 2.5 | 1290 | $3,950 | $3.06 | 26d | 1 | 1.10mi |
| 1180 E Hallandale Beach Blvd Unit 1241877P Hallandale Beach, FL | 1.0–2.0 | 1.0–2.0 | 844 | $5,453 | $6.46 | 5d | 2 | 1.19mi |
| 90 SW 3rd St Unit 2400 Hallandale Beach, FL | 2.0 | 2.0 | 1079 | $3,700 | $3.43 | 26d | 1 | 1.24mi |
| 2017 S Ocean Dr #1107 Hallandale Beach, FL | 2.0 | 2.0 | 1270 | $3,900 | $3.07 | 16d | 1 | 1.28mi |
| 2069 S Ocean Dr Unit TH12 Hallandale Beach, FL | 3.0 | 3.0 | 1500 | $4,800 | $3.20 | 12d | 1 | 1.29mi |
| 2069 S Ocean Dr Unit TH12 Hallandale Beach, FL | 3.0 | 3.0 | 1500 | $4,800 | $3.20 | 26d | 1 | 1.29mi |
| 201 Golden Isles Dr #302 Hallandale Beach, FL | 2.0 | 2.0 | 1150 | $3,975 | $3.46 | 26d | 1 | 1.29mi |
| 3180 S Ocean Dr #1709 Hallandale Beach, FL | 2.0 | 2.0 | 1105 | $4,000 | $3.62 | 10d | 1 | 1.32mi |
| 3180 S Ocean Dr Hallandale Beach, FL | 2.0–3.0 | 2.0 | 1263 | $3,750 | $2.97 | 23d | 2 | 1.32mi |
| 3180 S Ocean Dr Hallandale Beach, FL | 2.0–3.0 | 2.0 | 1285 | $3,650 | $2.84 | 26d | 3 | 1.32mi |
| 644 SW 7th Ct Hallandale Beach, FL | 3.0 | 2.0 | 1492 | $3,800 | $2.55 | 5d | 1 | 1.33mi |
| 2065 S Ocean Dr Unit 1049793P Hallandale Beach, FL | 2.0 | 2.0 | 871 | $4,971 | $5.71 | 10d | 1 | 1.34mi |
| 3140 S Ocean Dr Hallandale Beach, FL | 2.0 | 2.0 | 1100 | $4,250 | $3.86 | 1d | 3 | 1.34mi |
| 1985 S Ocean Dr Unit 21P Hallandale Beach, FL | 2.0 | 2.0 | 1380 | $3,800 | $2.75 | 10d | 1 | 1.37mi |
| 1985 S Ocean Dr Unit 22P Hallandale Beach, FL | 2.0 | 2.0 | 1380 | $4,000 | $2.90 | 26d | 1 | 1.37mi |
| 1985 S Ocean Dr Unit 9G Hallandale Beach, FL | 2.0 | 2.0 | 1240 | $3,700 | $2.98 | 26d | 1 | 1.37mi |
| 1965 S Ocean Dr Unit 14F Hallandale Beach, FL | 2.0 | 2.0 | 1275 | $4,800 | $3.76 | 1d | 1 | 1.37mi |
| 2080 S Ocean Dr Hallandale Beach, FL | 2.0–3.0 | 2.0–2.5 | 1270 | $3,900 | $3.07 | 26d | 7 | 1.37mi |
| 2080 S Ocean Dr Hallandale Beach, FL | 2.0–3.0 | 2.0–2.5 | 1270 | $3,800 | $2.99 | 5d | 11 | 1.37mi |
| 2080 S Ocean Dr #3 Hallandale Beach, FL | 2.0 | 2.0 | 1260 | $5,000 | $3.97 | 26d | 1 | 1.37mi |
| 2080 S Ocean Dr #8 Hallandale Beach, FL | 2.0 | 2.0 | 1100 | $4,000 | $3.64 | 26d | 1 | 1.37mi |
| 2080 S Ocean Dr #6 Hallandale Beach, FL | 2.0 | 2.0 | 1165 | $4,500 | $3.86 | 26d | 1 | 1.37mi |
| 121 Golden Isles Dr #1 Hallandale Beach, FL | 2.0 | 2.0 | 1379 | $4,000 | $2.90 | 26d | 1 | 1.40mi |
| 110 N Federal Hwy #1401 Hallandale Beach, FL | 2.0 | 2.0 | 1220 | $3,999 | $3.28 | 10d | 1 | 1.40mi |
| 2030 S Ocean Dr Hallandale Beach, FL | 2.0 | 2.0 | 1280 | $4,850 | $3.79 | 7d | 7 | 1.40mi |
| 2030 S Ocean Dr Hallandale Beach, FL | 2.0 | 2.0 | 1280 | $4,775 | $3.73 | 5d | 8 | 1.40mi |
| 2030 S Ocean Dr Hallandale Beach, FL | 2.0 | 2.0 | 1280 | $4,800 | $3.75 | 5d | 7 | 1.40mi |
| 2030 S Ocean Dr Hallandale Beach, FL | 2.0 | 2.0 | 1280 | $4,750 | $3.71 | 5d | 9 | 1.40mi |
| 2030 S Ocean Dr Hallandale Beach, FL | 2.0 | 2.0 | 1280 | $4,825 | $3.77 | 26d | 9 | 1.40mi |
| 1945 S Ocean Dr Hallandale Beach, FL | 2.0–3.0 | 2.0–3.0 | 1542 | $4,500 | $2.92 | 10d | 2 | 1.46mi |
| 1945 S Ocean Dr Hallandale Beach, FL | 2.0–3.0 | 2.0–2.5 | 1522 | $3,650 | $2.40 | 20d | 3 | 1.46mi |
| 1945 S Ocean Dr Hallandale Beach, FL | 2.0–3.0 | 2.0–3.0 | 1542 | $4,000 | $2.59 | 17d | 3 | 1.46mi |
| 1945 S Ocean Dr Hallandale Beach, FL | 2.0–3.0 | 2.0–3.0 | 1542 | $4,500 | $2.92 | 15d | 2 | 1.46mi |
| 1745 E Hallandale Beach Blvd Unit 2302W Hallandale Beach, FL | 3.0 | 2.0 | 1481 | $3,900 | $2.63 | 17d | 1 | 1.50mi |
| 1745 E Hallandale Beach Blvd Unit 802W Hallandale Beach, FL | 3.0 | 2.0 | 1481 | $3,600 | $2.43 | 26d | 1 | 1.50mi |
| 1745 E Hallandale Beach Blvd Unit 2302W Hallandale Beach, FL | 3.0 | 2.0 | 1481 | $3,900 | $2.63 | 26d | 1 | 1.50mi |
HOA detail condo
- Monthly dues
- $904 · $10,848/yr
- Assessments
- None detected in remarks — confirm with the listing agent.
Listing history 30 events
-
2026-06-21days on market $249,000 Active 81 DOM
-
2026-06-18days on market $249,000 Active 78 DOM
-
2026-06-17days on market $249,000 Active 77 DOM
-
2026-06-16days on market $249,000 Active 76 DOM
-
2026-06-15days on market $249,000 Active 75 DOM
-
2026-06-13days on market $249,000 Active 73 DOM
-
2026-06-09days on market $249,000 Active 69 DOM
-
2026-06-08days on market $249,000 Active 68 DOM
-
2026-06-07days on market $249,000 Active 67 DOM
-
2026-06-04days on market $249,000 Active 64 DOM
-
2026-06-03days on market $249,000 Active 63 DOM
-
2026-06-02days on market $249,000 Active 62 DOM
-
2026-06-01days on market $249,000 Active 61 DOM
-
2026-05-31days on market $249,000 Active 60 DOM
-
2026-05-01price $249,000
-
2026-04-02historical $2,500
-
2026-04-01$255,000 Active
-
2026-03-04$2,500
-
2025-09-04historical $2,600
-
2025-09-04historical
-
2025-07-29price $275,000
-
2025-06-26price $2,600
-
2025-05-31$2,650
-
2025-04-28$300,000 Active
-
2023-02-27soldstatus $265,000
-
2023-02-22soldstatus $265,000 306-char remark
Show marketing remark (306 chars)
Beautiful, spacious and renovated 2/2 in heart of Aventura, a lot of natural light, nice and relaxing view, laundry room & bike Storage, walking distance to the Aventura mall, shopping centers, supermarkets, pharmacies and beaches.Only Animal support or service animals are okay, No rent first 2 years.
-
2023-01-11$285,000 306-char remark
Show marketing remark (306 chars)
Beautiful, spacious and renovated 2/2 in heart of Aventura, a lot of natural light, nice and relaxing view, laundry room & bike Storage, walking distance to the Aventura mall, shopping centers, supermarkets, pharmacies and beaches.Only Animal support or service animals are okay, No rent first 2 years.
-
2012-07-05soldstatus $120,000
-
2012-07-03soldstatus $120,000
-
1990-01-10soldstatus $52,000
ⓘ Source: listings_history table (triggers on properties + properties_extension) + one-shot
backfill from property_details.listing_events for pre-trigger history.
Tax reassessment forecast FL · Resets to sale price
- Current annual tax
- $2,626 · $219/mo
- Projected year-2 tax
- $2,626 · $219/mo
- Expected delta
- $0/yr ($0/mo · 0.0%)
ⓘ Screening estimate from a state-policy table — verify with the county assessor before closing.
Climate risk First Street
- Flood 7/10 Severe FEMA zone AE · 77% chance over 30 yrs
- Wildfire 1/10 Low
- Heat 10/10 Extreme 7 d/yr ≥103°F today · 26 d/yr by 30 yrs out
- Wind 10/10 Extreme 99% chance of damaging wind over 30 yrs
- Air quality 2/10 Low 1 unhealthy d/yr today · 2 by 30 yrs out
Nearby sold comps map
Loading sold comps map…
Walkable amenities ~0.75 mi
Loading nearby amenities…
Taxation est. · year 1
- Rental income
- $47,344
- − Mortgage interest
- −$13,948
- − Property taxes
- −$2,626
- − Insurance
- −$6,364
- − Repairs & maintenance
- −$3,787
- − Management
- −$3,787
- − HOA
- −$10,848
- − Depreciation
- −$7,244
- Taxable loss
- −$1,260
- Est. tax savings @ 24.0%
- +$302
- After-tax cash flow
- $2,197/yr
For passive investors: Depreciation is non-cash, so a rental often shows a tax loss while cash-flowing — sheltering income. Rental losses are passive: they offset passive income freely, and up to $25,000/yr can offset ordinary (W-2) income if you actively participate and your MAGI is under $100k (phasing out to $0 by $150k); unused losses carry forward. On sale, claimed depreciation is recaptured at up to 25%, and gains may owe capital-gains tax (a 1031 exchange can defer both). Figures are a year-1 estimate at your 24.0% rate — not tax advice; consult a CPA.
Schools (NCES district)
- District
- Miami-Dade
- NCES district ID
- 1200390
- Math proficiency
- 45% ▼ -16.00%
- Reading proficiency
- 54% ▼ -5.00%
- Median HH income
- $43,928
- Composite
- 41.76/100
- National rank
- #3397
- State rank
- #40 of 73 in FL
Livability — Aventura
- Score
- 80/100
- State rank
- #127
- US rank
- #1834
Category grades
Schools grade is shown separately in the Schools card above.
Census & demographics
- Census place
- Aventura, FL
- County
- Miami-Dade County · 2,697,751 people
- City population
- 34,147
- Metro
- Miami-Fort Lauderdale-Pompano Beach, FL
- Population (ZIP)
- 34,147
- Household income
- $91,055
- Rent vs Own
- Severe rent burden
- 1838.0
Population outlook (Miami-Dade County) Hauer SSP2
- Today (2025)
- 3,126,439 people
- By 2030
- 3,325,765 · +6.4%
- By 2040
- 3,697,561 · +18.3%
- By 2050
- 4,012,134 · +28.3%
- By 2075
- 4,605,612 · +47.3%
- By 2100
- 4,866,598 · +55.7%
Race, ethnicity, and origin ACS 2023
- Neighborhood character
- Diverse neighborhood (Simpson 0.59)
- Race & ethnicity
- White 46% Hispanic / Latino 45% Two or more races 28% Black 2% Asian 2%
- Hispanic origin (detail)
- Mexican 2% Puerto Rican 2% Cuban 7% Dominican 1% Salvadoran 6%
- Common ancestry
- Scotch-Irish 5% Romanian 5% Italian 3%
- Foreign-born
- 52% · Canada, Jamaica, Dominican Republic
- Languages at home
- 30% English-only · Spanish 49% Other Indo-European 6% Russian/Polish/Slavic 4%
Political lean MEDSL · Miami-Dade
- 2024 margin
- R (+11.4) · D 43.9% · R 55.4%
- 2008→2024 swing
- -27.6pp toward R · 2008: 16.1pp · 2024: -11.4pp
- All cycles
- 2024: R+11.4 2020: D+7.3 2016: D+29.6 2012: D+23.7 2008: D+16.1
Not yet ingested
- Civics
- —
Market trends
- HPI YoY
- ▼ -343.81%
- Current HPI
- 234.7715
- Rent YoY
- ▼ -1.51%
- Metro
- Miami-Fort Lauderdale-Pompano Beach, FL
- State GDP YoY
- ▲ 3.28%
- F500 in state
- 36
Industry mix (Fortune 500 HQ in FL)
| Industry | F500 HQs | Revenue |
|---|---|---|
| Industrial Technology | 2 | $29B |
|
||
| Insurance | 2 | $17B |
|
||
| Retail | 1 | $60B |
|
||
| Technology Distribution | 1 | $58B |
|
||
| Homebuilding | 1 | $35B |
|
||
| Technology Manufacturing | 1 | $35B |
|
||
Price history
+378.8% since first listed16 events — show timeline
- 2026-05-01 Price Changed $249,000 MARMLS
- 2026-04-02 Rental Removed $2,500 MARMLS
- 2026-04-01 Listed $255,000 MARMLS
- 2026-03-04 Listed for Rent $2,500 MARMLS
- 2025-09-04 Rental Removed $2,600 MARMLS
- 2025-09-04 Listing Removed — MARMLS
- 2025-07-29 Price Changed $275,000 MARMLS
- 2025-06-26 Price Changed $2,600 MARMLS
- 2025-05-31 Listed for Rent $2,650 MARMLS
- 2025-04-28 Listed $300,000 MARMLS
- 2023-02-27 Sold (Public Records) $265,000 Public Records
- 2023-02-22 Sold (MLS) $265,000 Beaches MLS
- 2023-01-11 Listed $285,000 Beaches MLS
- 2012-07-05 Sold (Public Records) $120,000 Public Records
- 2012-07-03 Sold (MLS) $120,000 MARMLS
- 1990-01-10 Sold (Public Records) $52,000 Public Records
Property tax history
+10.7%/yrLatest (2025): $2,626 · -16.1% YoY. Source: county tax records.
Cash-flow waterfall
monthlySold comps — $/sqft
last 12 mo · ≤1 miLoading sold comps…