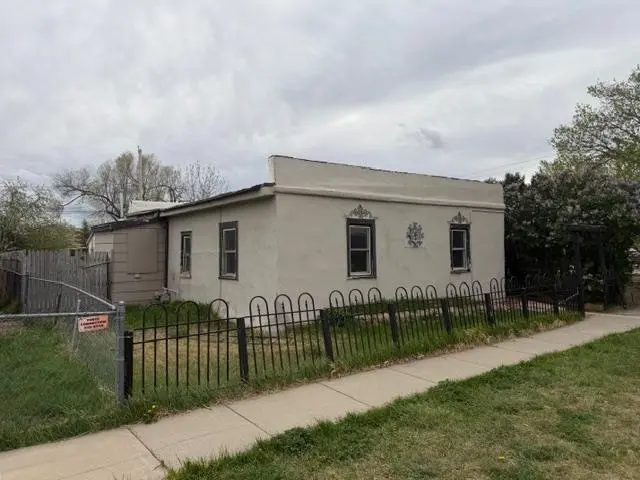
203 E Adams St · Rapid City, SD
Flood risk 1/10 · Minimal
- FEMA flood zone
- X (unshaded)
- Chance of flooding over 30 yrs
- 0.0%
- Est. flood insurance / yr
- $473 – $860
Fire risk 4/10 · Minor
- Est. fire insurance / yr
- $1,342 – $2,492
Heat risk 2/10 · Minimal
- Hot days now (above 95°F)
- 7 days/yr
- Hot days in 30 yrs
- 16 days/yr
Wind risk 2/10 · Minimal
- Chance of severe wind over 30 yrs
- —
Air-quality risk 4/10 · Minor
- Unhealthy air days now
- 4 days/yr
- Unhealthy air days in 30 yrs
- 4 days/yr
Risk factors via First Street. Map © Google.
Why this score? — see what drove the C grade
The composite is a weighted blend of 9 inputs, each scored 0–100. Each bar is that input's sub-score; the figure is the points it added to the 100-point composite (weight × sub-score).
- Cash flow +24.6/30.0
- DSCR +7.9/10.0
- ARV discount +7.5/15.0
- 1% rule +6.7/10.0
- Livability +3.7/5.0
- Schools +3.4/10.0
- Rent growth +2.9/5.0
- Condition / age +2.5/5.0
- Appreciation +0.0/10.0
$99,000
🖨 Deal sheet 📄 Offer letter ✓ Due diligence
Key facts
- Alley access
- Original wood floors
- Good sized lot
Tags
Property features AI
Exterior
- Home design: Single-family residence; Site-built; Residential property
- Construction: Wood frame construction
- Exterior features: Directions: North to N Maple, right on E Adams; home on left
Interior
- Kitchen: Dishwasher; Electric range and oven; Microwave
- Bedrooms: 2 main-level bedrooms
- Flooring: Vinyl; Hardwood
- Bathrooms: 1 full bathroom (main level)
- Heating & cooling: Has heating; Electric heating; Natural gas heating
- Interior features: Dishwasher; Dryer; Electric range and oven; Microwave
- Laundry & utility: Dryer
Neighborhood map
What this means for you Summary
Snapshot
- This is a 2-bed/1.0-bath single-family listed at $99k.
Deal economics
- At list price, monthly cash flow is $204 ($2k/yr) — positive.
- The deal already cash-flows at list — no discount required.
- Meets the 1% rule at list price ($1k rent vs $99k).
- Recommended offer: $96k (3.0% below list) — sets the bar for market timing.
- Cap rate 8.8% vs local median 2.5% in Rapid City — top-decile yield for the area; either an underpriced asset or a hidden risk that comps aren't pricing in. Stress-test before assuming the spread holds.
Location & tenants
- Location reads 74/100 on livability (#34 in SD, #4,720 nationally) — a middle-class / working-renter tenant base. Strengths: cost of living A+, housing A+, health & safety A+; Watch: crime F, commute F.
- Rapid City Area School District 51-4 (urban): math 34% / reading 46% proficiency, ranked #50 of 59 in SD (top 85%) — families likely to look elsewhere, expect single-tenant / working-renter base with shorter leases.
- Market conditions: Rents rising (+1.7%/yr); 216 active listings in the ZIP; 14 comparable units currently listed for rent nearby; rentals at typical pace (median 21d on market — plan ~3-4 weeks tenant-placement turnaround); 1,181 units permitted in Pennington County in 2024 (715 in 5+ unit buildings).
Forward outlook
- Local home prices are declining (-3.0%/yr); year-one equity from $684 of loan paydown is wiped out by about $3k of value loss. Plan a longer hold.
- Pennington County population projected at +28% by 2050 — long-run rental-demand tailwind backs the buy-and-hold thesis.
Negotiation context
- It's been on market 49 days — a 3% lower offer ($96k) is reasonable based on typical stale-listing flexibility.
- 2 sale attempts since 4y ago; this cycle's ask has dropped $10k (9%) from the opening price — seller is motivated, your offer sets the floor, not the list.
Risks & watch-outs
- Watch-outs: built in 1942 — expect roof / HVAC / electrical / plumbing capex.
Questions for the listing agent
- It's been on market 49 days. Have you received any prior offers? Is the seller open to a 3% concession, seller financing, or rate buy-down credit?
- Built in 1942 — when were the roof, HVAC, electrical panel, plumbing, and water heater last replaced?
- Is there a deadline driving the sale (1031 exchange, divorce, estate, relocation)? That informs how much negotiation room exists.
- Crime grade is F in this area — have there been break-ins, vandalism, or insurance claims at this property in the last 3 years? What carrier currently insures it and at what premium?
- What's the average days-on-market for RENTAL listings here right now (not sales)? A rising rental-DOM trend means longer vacancies and softer asking-rent achievability than the comps imply.
- What's the recent tenant-quality profile in this submarket — average credit score on applications, eviction rate, late-payment / NSF rate, and stable-employment percentage? A property-management company in the area should have these aggregated.
- How much new for-sale + rental construction is in the pipeline within 1–3 miles? Heavy new supply typically softens prices + rents 12–24 months out; constrained supply supports both.
Investment metrics
- 1% rule
- 1.17% ✓
- Cap rate
- 8.77%
- Cash-on-cash
- 8.83%
- DSCR
- 1.39
- GRM
- 7.1
CMA / ARV
- ARV (on-the-fly)
- $199,984
- Comps found
- 12
Show comp detail 12 sales within ~0.75 mi
| Address | Dist | Beds/Ba | Sqft | Sold | Price | $/sf | Match |
|---|---|---|---|---|---|---|---|
| 234 E College Ave | 0.29mi | 3/1.0 (+1) | 870 (+1%) | 4mo | $70,000 | $80 | 77 |
| 802 Blaine Ave | 0.32mi | 2/1.0 | 864 (+0%) | 11mo | $179,500 | $208 | 76 |
| 302 East Jackson St | 0.13mi | 2/1.0 | 748 (-13%) | 1mo | $95,000 | $127 | 71 |
| 436 E Van Buren St | 0.30mi | 2/1.5 | 906 (+5%) | 14mo | $227,000 | $251 | 64 |
| 1105. Blaine Ave | 0.47mi | 2/2.0 | 820 (-5%) | 6mo | $190,000 | $232 | 61 |
| 1034 Racine St | 0.44mi | 3/1.0 (+1) | 900 (+4%) | 8mo | $215,000 | $239 | 60 |
| 302 E Denver St | 0.30mi | 2/1.0 | 960 (+11%) | 12mo | $176,000 | $183 | 57 |
| 730 Farlow Ave | 0.68mi | 2/1.0 | 812 (-6%) | 4mo | $208,000 | $256 | 55 |
| 1011 Lemmon Ave | 0.49mi | 2/1.0 | 756 (-12%) | 3mo | $145,000 | $192 | 54 |
| 824 Farlow Ave | 0.69mi | 2/2.0 | 888 (+3%) | 12mo | $267,500 | $301 | 49 |
| 1510 Brentwood St | 0.61mi | 3/1.0 (+1) | 960 (+11%) | 6mo | $230,000 | $240 | 43 |
| 419 Crestwood Dr | 0.60mi | 3/1.0 (+1) | 960 (+11%) | 13mo | $218,000 | $227 | 37 |
Match score weights: distance 35% · size 25% · config 20% · recency 20%. Top-matched comps best support the ARV.
Projected returns pro-forma
-3.0% appreciation · 1.71% rent growth · sell at horizon
- IRR
- -4.4%
- Equity multiple
- 0.84×
- Total profit
- $-4,500
- Equity at exit
- $14,761
- IRR
- 3.7%
- Equity multiple
- 1.25×
- Total profit
- $7,020
- Equity at exit
- $8,560
Cash invested: $27,720 (down + closing). Projections, not guarantees.
Landlord ↔ Tenant lean methodology
- Overall (STATE)
- 83 Strongly Landlord-Friendly
- State South Dakota
- 83 Strongly Landlord-Friendly · R+16
- County
- — inherits STATE
- City
- — inherits STATE
ZIP-level market 57701
- Rents YoY
- 1.7%
- Active inventory
- 216
- Price-to-rent
- 7.1×
Monthly cashflow live
- Estimated rent
- $1,156 high interval (Pro) →
- Mortgage (P&I)
- −$519
- Tax from tax record
- −$149 /mo · $1,788/yr
- Insurance
- −$41
- HOA
- −$0
- Vacancy / Maint / Mgmt
- −$243
- Net cashflow
- $204
Break-even live
UW: 25.0% down · 7.5% · 30yr · 1.5% tax · 5.0% vac · 8.0% maint · 8.0% mgmt
Financing live
Cash to close
- Down payment
- $24,750
- Closing costs
- $2,970
- Reserves months
- —
- Total cash needed
- —
Loan-product check · same deal, 3 products live
Conventional
25% down · 7.5% · 30yr
- Down + closing
- —
- Monthly P&I
- —
- Monthly cashflow
- —
- DSCR
- —
- Eligible?
- —
Personal DTI + credit; lowest rate.
DSCR
20% down · 8.5% · 30yr
- Down + closing
- —
- Monthly P&I
- —
- Monthly cashflow
- —
- DSCR
- —
- Eligible?
- —
No personal income docs; deal must DSCR.
Hard money
10% down · 12.0% · 12mo
- Down + closing
- —
- Monthly P&I
- —
- Monthly cashflow
- —
- DSCR
- —
- Eligible?
- —
Short-term bridge; refi at stabilization.
Rent comps 14 comps
| Address | Beds | Baths | Sqft | Rent | $/sqft | DOM | Units | Dist |
|---|---|---|---|---|---|---|---|---|
| 210 East North St Rapid City, SD | 1.0 | 1.0 | 650 | $1,100 | $1.69 | 21d | 1 | 0.21mi |
| 216 E Denver St Rapid City, SD | 1.0 | 1.0 | 750 | $975 | $1.30 | 21d | 1 | 0.29mi |
| 927 Blaine Ave Rapid City, SD | 3.0 | 1.0 | 925 | $1,550 | $1.68 | 21d | 1 | 0.42mi |
| 118 Waterloo St Apt 110 Rapid City, SD | 1.0–4.0 | 1.0–1.5 | 810 | $1,064 | $1.31 | 21d | 7 | 0.54mi |
| 761 E Anamosa St Rapid City, SD | 2.0–3.0 | 1.5 | 882 | $950 | $1.08 | 21d | 1 | 0.62mi |
| 720 Haines Ave Unit B Rapid City, SD | 2.0 | 1.0 | 672 | $875 | $1.30 | 21d | 1 | 0.63mi |
| 1314 Atlas St Rapid City, SD | 1.0–3.0 | 1.0 | 775 | $978 | $1.26 | 21d | 13 | 0.89mi |
| 965 E Omaha St Unit 100 Rapid City, SD | 2.0 | 2.0 | 858 | $1,263 | $1.47 | 21d | 1 | 0.93mi |
| 100 Saint Joseph St Rapid City, SD | 2.0 | 1.0–2.0 | 744 | $1,750 | $2.35 | 21d | 4 | 0.96mi |
| 1230 Estes Park Ct Rapid City, SD | 2.0 | 1.0–2.0 | 956 | $1,035 | $1.08 | 21d | 9 | 1.17mi |
| 231 Quincy St Unit 231 1/2 Quincy Rapid City, SD | 1.0 | 1.0 | 930 | $850 | $0.91 | 21d | 1 | 1.19mi |
| 612 6th St Rapid City, SD | 2.0 | 1.0–2.0 | 772 | $2,945 | $3.81 | 21d | 19 | 1.19mi |
| 27 Signal Dr Rapid City, SD | 2.0 | 1.0 | 648 | $925 | $1.43 | 21d | 1 | 1.39mi |
| 706 South St Unit 2 Rapid City, SD | 1.0 | 1.0 | 700 | $1,200 | $1.71 | 21d | 1 | 1.48mi |
Listing history 23 events
-
2026-06-19days on market $99,000 Active 49 DOM
-
2026-06-18days on market $99,000 Active 48 DOM
-
2026-06-17days on market $99,000 Active 47 DOM
-
2026-06-16days on market $99,000 Active 46 DOM
-
2026-06-15days on market $99,000 Active 45 DOM
-
2026-06-14days on market $99,000 Active 43 DOM
-
2026-06-13days on market $99,000 Active 42 DOM
-
2026-06-10days on market $99,000 Active 40 DOM
-
2026-06-09days on market $99,000 Active 39 DOM
-
2026-06-09price $99,000 Active 38 DOM
-
2026-06-08days on market $109,000 Active 38 DOM
-
2026-06-07days on market $109,000 Active 37 DOM
-
2026-06-05days on market $109,000 Active 34 DOM
-
2026-06-02days on market $109,000 Active 32 DOM
-
2026-06-01days on market $109,000 Active 31 DOM
-
2026-05-31days on market $109,000 Active 30 DOM
-
2026-05-30days on market $109,000 Active 29 DOM
-
2026-05-01$109,000 Active
-
2023-02-17soldstatus $145,000
-
2022-11-06price $165,000
-
2022-10-13price $167,000
-
2022-09-15price $169,000
-
2022-09-06$179,000 Active
ⓘ Source: listings_history table (triggers on properties + properties_extension) + one-shot
backfill from property_details.listing_events for pre-trigger history.
Tax reassessment forecast SD · Resets to sale price
- Current annual tax
- $1,788 · $149/mo
- Projected year-2 tax
- $1,788 · $149/mo
- Expected delta
- $0/yr ($0/mo · -0.0%)
ⓘ Screening estimate from a state-policy table — verify with the county assessor before closing.
Climate risk First Street
- Flood 1/10 Low FEMA zone X (unshaded) · 0% chance over 30 yrs
- Wildfire 4/10 Moderate
- Heat 2/10 Low 7 d/yr ≥95°F today · 16 d/yr by 30 yrs out
- Wind 2/10 Low
- Air quality 4/10 Moderate 4 unhealthy d/yr today · 4 by 30 yrs out
Nearby sold comps map
Loading sold comps map…
Walkable amenities ~0.75 mi
Loading nearby amenities…
Taxation est. · year 1
- Rental income
- $13,874
- − Mortgage interest
- −$5,546
- − Property taxes
- −$1,788
- − Insurance
- −$495
- − Repairs & maintenance
- −$1,110
- − Management
- −$1,110
- − Depreciation
- −$2,880
- Taxable income
- $946
- Est. tax owed @ 24.0%
- −$227
- After-tax cash flow
- $2,221/yr
For passive investors: Depreciation is non-cash, so a rental often shows a tax loss while cash-flowing — sheltering income. Rental losses are passive: they offset passive income freely, and up to $25,000/yr can offset ordinary (W-2) income if you actively participate and your MAGI is under $100k (phasing out to $0 by $150k); unused losses carry forward. On sale, claimed depreciation is recaptured at up to 25%, and gains may owe capital-gains tax (a 1031 exchange can defer both). Figures are a year-1 estimate at your 24.0% rate — not tax advice; consult a CPA.
Schools (NCES district)
- District
- Rapid City Area School District 51-4
- NCES district ID
- 4659820
- Math proficiency
- 34% ▼ -8.00%
- Reading proficiency
- 46% ▼ -4.00%
- Median HH income
- $50,145
- Composite
- 34.47/100
- National rank
- #5189
- State rank
- #50 of 59 in SD
Livability — Rapid City
- Score
- 74/100
- State rank
- #34
- US rank
- #4720
Category grades
Schools grade is shown separately in the Schools card above.
Census & demographics
- Census place
- Rapid City, SD
- County
- Pennington County · 99,403 people
- City population
- 99,403
- Metro
- Rapid City, SD
- Population (ZIP)
- 45,795
- Household income
- $56,461
- Rent vs Own
- Severe rent burden
- 1646.0
Population outlook (Pennington County) Hauer SSP2
- Today (2025)
- 125,504 people
- By 2030
- 133,370 · +6.3%
- By 2040
- 147,505 · +17.5%
- By 2050
- 160,507 · +27.9%
- By 2075
- 197,585 · +57.4%
- By 2100
- 241,736 · +92.6%
Race, ethnicity, and origin ACS 2023
- Neighborhood character
- Predominantly White (73%)
- Race & ethnicity
- White 73% Native American 11% Two or more races 11% Hispanic / Latino 6% Black 2%
- Hispanic origin (detail)
- Mexican 4%
- Common ancestry
- Portuguese 7% Lithuanian 4% Slovak 3%
- Foreign-born
- 2% · Canada
- Languages at home
- 96% English-only · Spanish 1%
Political lean MEDSL · Pennington
- 2024 margin
- Strong R (+26.4) · D 35.4% · R 61.9% · Other 2.7%
- 2008→2024 swing
- -5.3pp toward R · 2008: -21.2pp · 2024: -26.4pp
- All cycles
- 2024: R+26.4 2020: R+25.1 2016: R+33.0 2012: R+29.5 2008: R+21.2
Not yet ingested
- Civics
- —
Market trends
- HPI YoY
- ▼ -189.12%
- Current HPI
- 222.9041
- Rent YoY
- ▲ 1.71%
- Metro
- Rapid City, SD
- State GDP YoY
- ▲ 0.70%
- F500 in state
- 2
Industry mix (Fortune 500 HQ in SD)
| Industry | F500 HQs | Revenue |
|---|---|---|
| Utilities | 1 | $1B |
|
||
Price history
-39.1% since first listed6 events — show timeline
- 2026-05-01 Listed $109,000 MRAOR
- 2023-02-17 Sold (Public Records) $145,000 Public Records
- 2022-11-06 Price Changed $165,000 BHMLS
- 2022-10-13 Price Changed $167,000 BHMLS
- 2022-09-15 Price Changed $169,000 BHMLS
- 2022-09-06 Listed $179,000 BHMLS
Property tax history
+6.0%/yrLatest (2025): $1,788 · -5.0% YoY. Source: county tax records.
Cash-flow waterfall
monthlySold comps — $/sqft
last 12 mo · ≤1 miLoading sold comps…