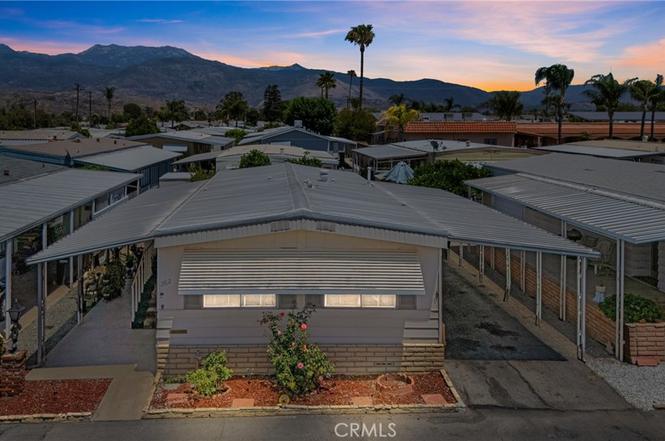
881 N Lake #362 · Hemet, CA
Flood risk 1/10 · Minimal
- FEMA flood zone
- X (unshaded)
- Chance of flooding over 30 yrs
- 0.0%
- Est. flood insurance / yr
- $507 – $1,088
Fire risk 7/10 · Major
- Est. fire insurance / yr
- $659 – $1,223
Heat risk 7/10 · Major
- Hot days now (above 103°F)
- 5 days/yr
- Hot days in 30 yrs
- 15 days/yr
Wind risk 1/10 · Minimal
- Chance of severe wind over 30 yrs
- —
Air-quality risk 6/10 · Moderate
- Unhealthy air days now
- 11 days/yr
- Unhealthy air days in 30 yrs
- 13 days/yr
Risk factors via First Street. Map © Google.
Why this score? — see what drove the B+ grade
The composite is a weighted blend of 9 inputs, each scored 0–100. Each bar is that input's sub-score; the figure is the points it added to the 100-point composite (weight × sub-score).
- Cash flow +30.0/30.0
- ARV discount +15.0/15.0
- 1% rule +10.0/10.0
- DSCR +10.0/10.0
- Rent growth +3.7/5.0
- Livability +2.6/5.0
- Schools +2.5/10.0
- Condition / age +2.5/5.0
- Appreciation +0.0/10.0
$47,000
🖨 Deal sheet (PDF) 📄 Offer letter ✓ Due diligence
Listing remarks
Welcome to 881 N Lake St #362, located in the desirable Casa Del Rey 55+ community in Hemet. This charming 2 bedroom, 2 bathroom home offers approximately 880 sq ft of comfortable living space with a functional layout designed for easy living and relaxation. Step inside to a welcoming living area filled with natural light, a cozy kitchen space perfect for everyday meals, and comfortable bedrooms including a primary suite with its own private bathroom. This home offers the perfect opportunity to enjoy a peaceful lifestyle in a friendly senior community. Casa Del Rey offers a wonderful active 55+ lifestyle with amenities designed for comfort, recreation, and connection. Residents enjoy access
Key facts
- Billiards
- Swimming pools
- Fitness facilities
Tags
Property features AI
Finance
- Financial info: Land lease of $685 (park)
- HOA & community: Senior community; Park amenities; Park name: Casa Del Rey Mobile Home Estates; Manager approval required
Exterior
- Parking: Carport with 2 spaces
- Security: Gated community
- Utilities: Public sewer; District/Public water
- Home design: Mobile home (mobile home remains); Single-story; Entry level 1
- Construction: Year built (per public records)
- Exterior features: Community/association pool; Walkstreet lot feature; Exposure/shade (energy efficient feature)
Interior
- Kitchen: Microwave; Gas range; Gas oven
- Flooring: Carpet
- Bathrooms: 2 full bathrooms
- Heating & cooling: Central furnace heating; Central cooling
- Interior features: One-level home; Front door entry; Located in a gated community
- Laundry & utility: Inside laundry
Neighborhood map
What this means for you Summary
Snapshot
- This is a 2-bed/2.0-bath manufactured listed at $47k.
Deal economics
- At list price, monthly cash flow is $1k ($13k/yr) — positive.
- The deal already cash-flows at list — no discount required.
- Meets the 1% rule at list price ($2k rent vs $47k).
- Cap rate 34.0% vs local median 4.8% in Hemet — top-decile yield for the area; either an underpriced asset or a hidden risk that comps aren't pricing in. Stress-test before assuming the spread holds.
Location & tenants
- Location reads 51/100 on livability (#1,056 in CA) — a working-class tenant base; expect higher turnover. Strengths: housing A+; Watch: crime D+, amenities F, commute F.
- Hemet Unified (suburban): math 19% / reading 41% proficiency, ranked #360 of 517 in CA (top 70%) — families likely to look elsewhere, expect single-tenant / working-renter base with shorter leases; 66% free/reduced lunch — lower-income household profile, screen leases tightly.
- Zoned schools: Bautista Creek Elementary (math 10% / reading 50%, grade F, #849 of 1,571 statewide, top 54%, 1,001 students, 80% FRL); Acacia Middle (1,016 students, 94% FRL); Hemet High (math 21% / reading 46%, grade F, #656 of 1,170 statewide, top 57%, 2,438 students, 82% FRL) — zoned schools average 85% FRL vs 66% district-wide (20 pts higher); higher-poverty schools than district average — tighter screening recommended.
- Market conditions: Rents rising fast (+4.9%/yr); 329 active listings in the ZIP; 15 comparable units currently listed for rent nearby; rentals lingering (median 46d on market — plan ~5-8 weeks vacancy on turnover, expect pricing pressure); 53% of comp listings sitting > 30 days — soft ceiling on asking rent; 9,195 units permitted in Riverside County in 2024 (1,512 in 5+ unit buildings).
Forward outlook
- Local home prices are declining (-3.0%/yr); year-one equity from $325 of loan paydown is wiped out by about $1k of value loss. Plan a longer hold.
- Riverside County population projected at +22% by 2050 — long-run rental-demand tailwind backs the buy-and-hold thesis.
- At projected returns (-3.0% appreciation + 4.9% rent growth), your $13k cash investment doubles in ~2 years — after that, you're playing with house money.
Negotiation context
- Only 6 days on market — expect competitive offers; lowballing is unlikely to land.
- 9 sale attempts since 3y ago with the ask held roughly flat each time — persistent listings suggest the price (not the market) is what's stuck; bring a comps-based counter.
Risks & watch-outs
- Climate carrying-cost: major wildfire risk; extreme-heat days projected 5→15/yr by 2055 (HVAC capex compounding) — expect insurance premiums to compound above CPI over the hold.
Questions for the listing agent
- Built in 1977 — when were the roof, HVAC, electrical panel, plumbing, and water heater last replaced?
- Is there a deadline driving the sale (1031 exchange, divorce, estate, relocation)? That informs how much negotiation room exists.
- Schools are F-rated, which usually means shorter tenancies and higher turnover. Who's the typical renter profile here, and what's been the actual vacancy rate?
- Crime grade is D in this area — have there been break-ins, vandalism, or insurance claims at this property in the last 3 years? What carrier currently insures it and at what premium?
- What's the average days-on-market for RENTAL listings here right now (not sales)? A rising rental-DOM trend means longer vacancies and softer asking-rent achievability than the comps imply.
- What's the recent tenant-quality profile in this submarket — average credit score on applications, eviction rate, late-payment / NSF rate, and stable-employment percentage? A property-management company in the area should have these aggregated.
- How much new for-sale + rental construction is in the pipeline within 1–3 miles? Heavy new supply typically softens prices + rents 12–24 months out; constrained supply supports both.
Investment metrics
- 1% rule
- 3.67% ✓
- Cap rate
- 33.97%
- Cash-on-cash
- 98.85%
- DSCR
- 5.40
- GRM
- 2.3
CMA / ARV
- ARV (on-the-fly)
- $66,880
- Comps found
- 5
Show comp detail 5 sales within ~0.75 mi
| Address | Dist | Beds/Ba | Sqft | Sold | Price | $/sf | Match |
|---|---|---|---|---|---|---|---|
| 880 N Lake St #99 | 0.16mi | 2/2.0 | 840 (-4%) | 8mo | $34,800 | $41 | 78 |
| 880 N LAKE St #59 | 0.16mi | 2/2.0 | 818 (-7%) | 6mo | $62,000 | $76 | 76 |
| 880 N Lake St #82 | 0.16mi | 3/2.0 (+1) | 1,000 (+14%) | 4mo | $83,500 | $84 | 61 |
| 880 N Lake St #90 | 0.13mi | 2/1.0 | 800 (-9%) | 18mo | $46,000 | $58 | 59 |
| 881 N Lake St #332 | 0.06mi | 2/2.0 | 1,000 (+14%) | 19mo | $78,000 | $78 | 58 |
Match score weights: distance 35% · size 25% · config 20% · recency 20%. Top-matched comps best support the ARV.
Projected returns pro-forma
-3.0% appreciation · 4.9% rent growth · sell at horizon
- IRR
- —
- Equity multiple
- 5.92×
- Total profit
- $64,791
- Equity at exit
- $7,008
- IRR
- —
- Equity multiple
- 13.13×
- Total profit
- $159,667
- Equity at exit
- $4,064
Cash invested: $13,160 (down + closing). Projections, not guarantees.
Landlord ↔ Tenant lean methodology
- Overall (STATE)
- 18 Strongly Tenant-Friendly
- State California
- 18 Strongly Tenant-Friendly · D+13
- County
- — inherits STATE
- City
- — inherits STATE
ZIP-level market 92544
- Rents YoY
- 4.9%
- Active inventory
- 329
- Price-to-rent
- 2.3×
Monthly cashflow live
- Estimated rent
- $1,727 high interval (Pro) →
- Mortgage (P&I)
- −$246
- Tax from tax record
- −$14 /mo · $166/yr
- Insurance
- −$20
- HOA
- −$0
- Vacancy / Maint / Mgmt
- −$363
- Net cashflow
- $1,084
Break-even live
Sensitivity live
| Price | -10% $1,111 | -5% $1,097 | +0% $1,084 | +5% $1,071 | +10% $1,057 |
|---|---|---|---|---|---|
| Rent | -10% $948 | -5% $1,016 | +0% $1,084 | +5% $1,152 | +10% $1,220 |
| Rate | -1.0pp $1,108 | -0.5pp $1,096 | base $1,084 | +0.5pp $1,072 | +1.0pp $1,060 |
UW: 25.0% down · 7.5% · 30yr · 1.5% tax · 5.0% vac · 8.0% maint · 8.0% mgmt
Financing live
Cash to close
- Down payment
- $11,750
- Closing costs
- $1,410
- Reserves months
- —
- Total cash needed
- —
Loan-product check · same deal, 3 products live
Conventional
25% down · 7.5% · 30yr
- Down + closing
- —
- Monthly P&I
- —
- Monthly cashflow
- —
- DSCR
- —
- Eligible?
- —
Personal DTI + credit; lowest rate.
DSCR
20% down · 8.5% · 30yr
- Down + closing
- —
- Monthly P&I
- —
- Monthly cashflow
- —
- DSCR
- —
- Eligible?
- —
No personal income docs; deal must DSCR.
Hard money
10% down · 12.0% · 12mo
- Down + closing
- —
- Monthly P&I
- —
- Monthly cashflow
- —
- DSCR
- —
- Eligible?
- —
Short-term bridge; refi at stabilization.
Rent comps 15 comps
| Address | Beds | Baths | Sqft | Rent | $/sqft | DOM | Units | Dist |
|---|---|---|---|---|---|---|---|---|
| 1939 Hooper Dr San Jacinto, CA | 2.0 | 2.0 | 1111 | $1,950 | $1.76 | 26d | 1 | 0.73mi |
| 25564 Sharp Dr Unit F Hemet, CA | 1.0 | 1.0 | 832 | $1,475 | $1.77 | 45d | 1 | 0.86mi |
| 5475 Tangerine Ave Hemet, CA | 1.0 | 1.5 | 600 | $1,500 | $2.50 | 7d | 1 | 0.90mi |
| 43611 Florida Ave Unit 10 Hemet, CA | 2.0 | 2.0 | 850 | $1,550 | $1.82 | 45d | 1 | 1.24mi |
| 43601 California 74 Unit 17 Hemet, CA | 2.0 | 2.0 | 840 | $1,400 | $1.67 | 25d | 1 | 1.35mi |
| 43601 E Florida Ave #98 Hemet, CA | 2.0 | 2.0 | 840 | $1,400 | $1.67 | 26d | 1 | 1.36mi |
| 43601 E Florida Ave Hemet, CA | 2.0 | 2.0 | 960 | $1,550 | $1.61 | 45d | 1 | 1.36mi |
| 43601 E Florida Ave Unit 43 Hemet, CA | 2.0 | 2.0 | 960 | $1,500 | $1.56 | 45d | 1 | 1.36mi |
| 43601 E Florida Ave #98 Hemet, CA | 2.0 | 2.0 | 800 | $1,400 | $1.75 | 45d | 1 | 1.36mi |
| 43601 E Florida Ave Unit 43 Hemet, CA | 2.0 | 2.0 | 960 | $1,450 | $1.51 | 25d | 1 | 1.36mi |
| 41900 Acacia Ave Hemet, CA | 2.0 | 1.0 | 850 | $1,800 | $2.12 | 45d | 1 | 1.37mi |
| 43816 C St Hemet, CA | 2.0 | 2.0 | 1040 | $2,250 | $2.16 | 26d | 1 | 1.38mi |
| 26123 Anawood Pl Hemet, CA | 2.0 | 1.0 | 991 | $1,680 | $1.70 | 45d | 1 | 1.42mi |
| 26097 Doverwood Pl Hemet, CA | 2.0 | 1.0 | 1019 | $1,849 | $1.81 | 45d | 1 | 1.45mi |
| 41818 Acacia East Ave Hemet, CA | 2.0 | 1.0 | 1000 | $1,850 | $1.85 | 16d | 1 | 1.47mi |
Listing history 5 events
-
2026-06-21days on market $47,000 Active 6 DOM
-
2026-06-18days on market $47,000 Active 3 DOM
-
2026-06-17days on market $47,000 Active 2 DOM
-
2026-06-15remarks 699-char remark
-
2026-06-15$47,000 Active 1 DOM
ⓘ Source: listings_history table (triggers on properties + properties_extension) + one-shot
backfill from property_details.listing_events for pre-trigger history.
Tax reassessment forecast CA · Resets to sale price
- Current annual tax
- $166 · $14/mo
- Projected year-2 tax
- $357 · $30/mo
- Expected delta
- +$191/yr (+$16/mo · 115.2%)
ⓘ Screening estimate from a state-policy table — verify with the county assessor before closing.
Climate risk First Street
- Flood 1/10 Low FEMA zone X (unshaded) · 0% chance over 30 yrs
- Wildfire 7/10 Severe
- Heat 7/10 Severe 5 d/yr ≥103°F today · 15 d/yr by 30 yrs out
- Wind 1/10 Low
- Air quality 6/10 Major 11 unhealthy d/yr today · 13 by 30 yrs out
Nearby sold comps map
Loading sold comps map…
Walkable amenities ~0.75 mi
Loading nearby amenities…
Taxation est. · year 1
- Rental income
- $20,719
- − Mortgage interest
- −$2,633
- − Property taxes
- −$166
- − Insurance
- −$235
- − Repairs & maintenance
- −$1,657
- − Management
- −$1,657
- − Depreciation
- −$1,367
- Taxable income
- $13,003
- Est. tax owed @ 24.0%
- −$3,121
- After-tax cash flow
- $9,888/yr
For passive investors: Depreciation is non-cash, so a rental often shows a tax loss while cash-flowing — sheltering income. Rental losses are passive: they offset passive income freely, and up to $25,000/yr can offset ordinary (W-2) income if you actively participate and your MAGI is under $100k (phasing out to $0 by $150k); unused losses carry forward. On sale, claimed depreciation is recaptured at up to 25%, and gains may owe capital-gains tax (a 1031 exchange can defer both). Figures are a year-1 estimate at your 24.0% rate — not tax advice; consult a CPA.
Schools (NCES district)
- District
- Hemet Unified
- NCES district ID
- 0616920
- Math proficiency
- 19% ▼ -3.00%
- Reading proficiency
- 41% ▲ 4.00%
- Median HH income
- $39,962
- Composite
- 25.16/100
- National rank
- #7517
- State rank
- #360 of 517 in CA
Livability — Hemet
- Score
- 51/100
- State rank
- #1056
- US rank
- #25208
Category grades
Schools grade is shown separately in the Schools card above.
Census & demographics
- Census place
- Hemet, CA
- County
- Riverside County · 2,287,001 people
- City population
- 137,670
- Metro
- Riverside-San Bernardino-Ontario, CA
- Population (ZIP)
- 51,751
- Household income
- $73,596
- Rent vs Own
- Severe rent burden
- 1518.0
Population outlook (Riverside County) Hauer SSP2
- Today (2025)
- 2,664,475 people
- By 2030
- 2,802,692 · +5.2%
- By 2040
- 3,050,904 · +14.5%
- By 2050
- 3,256,783 · +22.2%
- By 2075
- 3,655,058 · +37.2%
- By 2100
- 3,766,594 · +41.4%
Race, ethnicity, and origin ACS 2023
- Neighborhood character
- Diverse neighborhood (Simpson 0.59)
- Race & ethnicity
- Hispanic / Latino 49% White 40% Two or more races 18% Black 5% Asian 3% Native American 2%
- Hispanic origin (detail)
- Mexican 43% Puerto Rican 1%
- Common ancestry
- Slovak 2% Italian 2% Portuguese 2%
- Foreign-born
- 15% · Canada, China
- Languages at home
- 70% English-only · Spanish 27% Other Asian/Pacific 1% Other Indo-European 1%
Political lean MEDSL · Riverside
- 2024 margin
- Toss-up / Even · D 48.0% · R 49.3% · Other 2.6%
- 2008→2024 swing
- -3.6pp toward R · 2008: 2.3pp · 2024: -1.3pp
- All cycles
- 2024: R+1.3 2020: D+8.0 2016: D+4.3 2012: R+0.4 2008: D+2.3
Not yet ingested
- Civics
- —
Market trends
- HPI YoY
- ▼ -219.06%
- Current HPI
- 391.972
- Rent YoY
- ▲ 4.90%
- Metro
- Riverside-San Bernardino-Ontario, CA
- State GDP YoY
- ▲ 3.21%
- F500 in state
- 116
Industry mix (Fortune 500 HQ in CA)
| Industry | F500 HQs | Revenue |
|---|---|---|
| Technology | 27 | $1,492B |
|
||
| Financial Services | 3 | $174B |
|
||
| Retail | 3 | $44B |
|
||
| Insurance | 3 | $26B |
|
||
| Media / Entertainment | 2 | $115B |
|
||
| Pharmaceuticals / Biotech | 2 | $62B |
|
||
Price history
+17.5% since first listed21 events — show timeline
- 2026-06-15 Listed $47,000 CRMLS
- 2026-03-02 Listing Removed — SDMLS
- 2025-10-14 Price Changed $54,900 SDMLS
- 2025-05-30 Listed $59,900 SDMLS
- 2025-05-28 Listing Removed — CRMLS
- 2025-03-23 Listed $59,900 CRMLS
- 2025-01-17 Listing Removed — CRMLS
- 2024-11-22 Listed $64,900 CRMLS
- 2024-09-21 Listing Removed — SDMLS
- 2024-08-20 Listed $95,000 SDMLS
- 2023-12-28 Sold (MLS) $52,000 CRMLS
- 2023-11-18 Pending — CRMLS
- 2023-10-15 Listed $53,900 CRMLS
- 2023-10-10 Listing Removed — CRMLS
- 2023-10-09 Price Changed $54,000 CRMLS
- 2023-10-08 Listed $58,300 CRMLS
- 2023-09-26 Listing Removed — CRMLS
- 2023-09-22 Listed $69,500 CRMLS
- 2023-06-16 Sold (MLS) $38,000 CRMLS
- 2023-05-10 Pending — CRMLS
- 2023-02-15 Listed $40,000 CRMLS
Property tax history
+10.5%/yrLatest (2025): $166 · +2.0% YoY. Source: county tax records.
Cash-flow waterfall
monthlySold comps — $/sqft
last 12 mo · ≤1 miLoading sold comps…