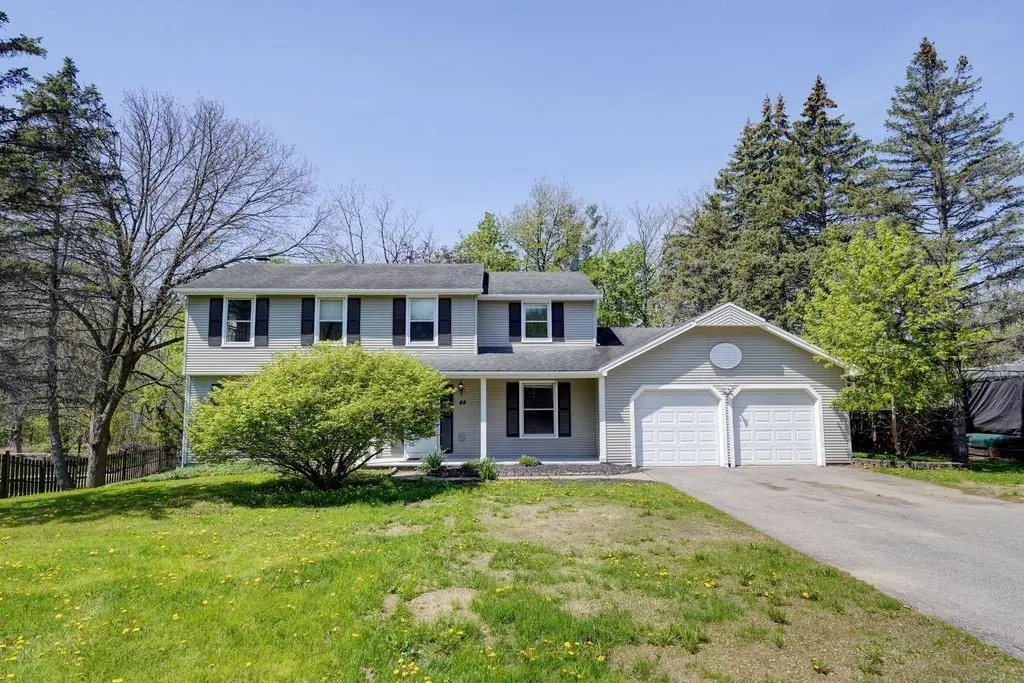
44 Latchmere Dr · Victor, NY
Flood risk 1/10 · Minimal
- FEMA flood zone
- X (unshaded)
- Chance of flooding over 30 yrs
- 0.0%
- Est. flood insurance / yr
- $473 – $860
Fire risk 3/10 · Minor
- Est. fire insurance / yr
- $691 – $1,283
Heat risk 2/10 · Minimal
- Hot days now (above 95°F)
- 7 days/yr
- Hot days in 30 yrs
- 16 days/yr
Wind risk 1/10 · Minimal
- Chance of severe wind over 30 yrs
- —
Air-quality risk 2/10 · Minimal
- Unhealthy air days now
- 0 days/yr
- Unhealthy air days in 30 yrs
- 1 days/yr
Risk factors via First Street. Map © Google.
Why this score? — see what drove the D grade
The composite is a weighted blend of 9 inputs, each scored 0–100. Each bar is that input's sub-score; the figure is the points it added to the 100-point composite (weight × sub-score).
- ARV discount +15.0/15.0
- Cash flow +7.5/30.0
- Schools +5.2/10.0
- Livability +4.0/5.0
- 1% rule +3.1/10.0
- Rent growth +2.5/5.0
- Condition / age +2.5/5.0
- DSCR +1.6/10.0
- Appreciation +0.0/10.0
$324,900
🖨 Deal sheet (PDF) 📄 Offer letter ✓ Due diligence
Listing remarks MLS
Completely updated 2700sq' home- includes lower level. Walking distance to Victor school and downtown. Includes all appliances with washer and dryer. Walkout Lower level is professionally finished. Would consider leaving home furnished for extra fee.
Key facts
- Mud hall
- First floor laundry
- Rear deck
Tags
Property features AI
Finance
- HOA & community: Trails/paths nearby
Exterior
- Parking: Attached garage with storage; Approximately 2.5 garage spaces
- Utilities: Cable available; Electricity available with circuit breakers; Public water connected; Sewer connected
- Home design: Two-story home; Existing construction
- Construction: Vinyl siding; Copper plumbing; Asphalt architectural shingle roof; Block foundation; Built previously (existing)
- Exterior features: Blacktop driveway; Deck; Private yard; See remarks
Interior
- Kitchen: Dishwasher; Free-standing range; Oven; Microwave; Refrigerator; Disposal; Solid surface counters
- Bedrooms: Bedrooms not specified
- Flooring: Carpet; Hardwood; Varies
- Bathrooms: 2 full bathrooms; 1 half bathroom; 1 main-level bathroom
- Heating & cooling: Gas heating; Central air conditioning
- Interior features: Ceiling fans; Separate/formal dining room; Entrance foyer; Separate/formal living room; Sliding glass doors; Solid surface counters; Primary bedroom with private bath; See remarks / other
- Laundry & utility: Washer; Dryer; Main-level laundry
Neighborhood map
What this means for you Summary
Snapshot
- This is a 4-bed/2.5-bath single-family listed at $325k.
Deal economics
- At list price, monthly cash flow is $-401 ($-5k/yr) — negative.
- To cash-flow at today's rent, offer at most $254k (21.8% below list).
- To meet the 1% rule (rent ≥ 1% of price), the offer needs to be $263k (19.0% below list).
- Recommended offer: $254k (21.8% below list) — sets the bar for cash-flow.
- Cap rate 4.8% vs local median 2.6% in Victor — top-decile yield for the area; either an underpriced asset or a hidden risk that comps aren't pricing in. Stress-test before assuming the spread holds.
Location & tenants
- Location reads 79/100 on livability (#122 in NY, #1,991 nationally) — a middle-class / working-renter tenant base. Strengths: employment A+, housing A+, health & safety A+; Watch: amenities F, commute F.
- Victor Central School District (suburban): math 56% / reading 62% proficiency, ranked #222 of 590 in NY (top 38%) — acceptable for families but not a draw, mixed tenant base, ~2y average lease; only 12% free/reduced lunch — higher-income household profile.
- Zoned schools: Victor Primary School (math 46% / reading 60%, grade C, #983 of 2,108 statewide, top 47%, 711 students, 25% FRL); Victor Intermediate School (math 40% / reading 58%, grade C-, #294 of 729 statewide, top 41%, 919 students, 26% FRL); Victor Senior High School (math 98% / reading 72%, grade A, #369 of 1,100 statewide, top 34%, 1,320 students, 26% FRL).
- Market conditions: 109 active listings in the ZIP; 1 comparable units currently listed for rent nearby; high-income renter base; 284 units permitted in Ontario County in 2024 (69 in 5+ unit buildings).
Forward outlook
- Local home prices are declining (-3.0%/yr); year-one equity from $2k of loan paydown is wiped out by about $10k of value loss. Plan a longer hold.
- Ontario County population projected to shrink 6% by 2050 — rents likely to lag national; underwrite the cash flow, not the appreciation.
Negotiation context
- Only 8 days on market — expect competitive offers; lowballing is unlikely to land.
- 2 sale attempts since 19y ago with the ask held roughly flat each time — persistent listings suggest the price (not the market) is what's stuck; bring a comps-based counter.
- Current owner paid $2k; list at $325k implies a 17950% gain — meaningful room to come down on a strong offer.
Questions for the listing agent
- What do current leases actually rent for vs. the listed asking? Can we see a recent rent roll and the last 12 months of T-12 income?
- Built in 1979 — when were the roof, HVAC, electrical panel, plumbing, and water heater last replaced?
- Is there a deadline driving the sale (1031 exchange, divorce, estate, relocation)? That informs how much negotiation room exists.
- Schools are A-rated — typically a magnet for longer-tenancy family renters. What's the average tenant stay here, and is there a school-zone premium baked into asking?
- The area grade is low — what's the realistic commute time and amenity access for the typical tenant pool here? Any planned neighborhood developments (good or bad) we should know about?
- What's the average days-on-market for RENTAL listings here right now (not sales)? A rising rental-DOM trend means longer vacancies and softer asking-rent achievability than the comps imply.
- What's the recent tenant-quality profile in this submarket — average credit score on applications, eviction rate, late-payment / NSF rate, and stable-employment percentage? A property-management company in the area should have these aggregated.
- How much new for-sale + rental construction is in the pipeline within 1–3 miles? Heavy new supply typically softens prices + rents 12–24 months out; constrained supply supports both.
Investment metrics
- 1% rule
- 0.81% ✗
- Cap rate
- 4.81%
- Cash-on-cash
- -5.29%
- DSCR
- 0.76
- GRM
- 10.3
CMA / ARV
- ARV (median comp)
- $425,331
- List price
- $324,900
- Delta
- -23.61%
- Verdict
- UNDERPRICED
- Comps
- 20 within 1.0 mi
Show comp detail 12 sales within ~0.75 mi
| Address | Dist | Beds/Ba | Sqft | Sold | Price | $/sf | Match |
|---|---|---|---|---|---|---|---|
| 187 Huxley Way | 0.17mi | 4/2.5 | 1,980 (+0%) | 11mo | $332,000 | $168 | 83 |
| 51 West Pkwy | 0.25mi | 4/2.5 | 2,083 (+5%) | 1mo | $492,000 | $236 | 79 |
| 29 Latchmere Dr | 0.07mi | 4/1.5 | 1,776 (-10%) | 7mo | $350,000 | $197 | 70 |
| 298 High St S | 0.38mi | 4/1.5 | 1,826 (-8%) | 7mo | $259,900 | $142 | 60 |
| 11 Duxbury Cir | 0.37mi | 4/2.5 | 1,822 (-8%) | 12mo | $380,000 | $209 | 59 |
| 6 Valley View Cir | 0.42mi | 3/2.5 (-1) | 2,157 (+9%) | 3mo | $541,000 | $251 | 58 |
| 987 Kensington Ct | 0.66mi | 4/2.5 | 1,996 (+1%) | 14mo | $552,500 | $277 | 56 |
| 890 Sagamore | 0.57mi | 4/2.5 | 1,906 (-4%) | 22mo | $501,000 | $263 | 49 |
| 44 East St | 0.72mi | 4/2.5 | 1,796 (-9%) | 6mo | $365,900 | $204 | 46 |
| 19 Lynaugh Rd Rd | 0.74mi | 4/2.0 | 1,878 (-5%) | 14mo | $300,000 | $160 | 44 |
| 6797 Ally Rise | 0.55mi | 4/2.5 | 2,229 (+13%) | 13mo | $580,000 | $260 | 42 |
| 271 E Main St | 0.71mi | 5/2.0 (+1) | 2,272 (+15%) | 20mo | $212,000 | $93 | 18 |
Match score weights: distance 35% · size 25% · config 20% · recency 20%. Top-matched comps best support the ARV.
Projected returns pro-forma
-3.0% appreciation · 3.0% rent growth · sell at horizon
- IRR
- -25.2%
- Equity multiple
- 0.14×
- Total profit
- $-78,007
- Equity at exit
- $48,444
- IRR
- -21.1%
- Equity multiple
- -0.10×
- Total profit
- $-100,073
- Equity at exit
- $28,091
Cash invested: $90,972 (down + closing). Projections, not guarantees.
Landlord ↔ Tenant lean methodology
- Overall (STATE)
- 15 Strongly Tenant-Friendly
- State New York
- 15 Strongly Tenant-Friendly · D+10
- County
- — inherits STATE
- City
- — inherits STATE
ZIP-level market 14564
- Home prices YoY
- -12.8%
- Active inventory
- 109
- Price-to-rent
- 10.3×
Monthly cashflow live
- Estimated rent
- $2,630 medium interval (Pro) →
- Mortgage (P&I)
- −$1,704
- Tax from tax record
- −$640 /mo · $7,677/yr
- Insurance
- −$135
- HOA
- −$0
- Lot rent
- −$0
- Vacancy / Maint / Mgmt
- −$552
- Net cashflow
- $-401
Break-even live
Sensitivity live
| Price | -10% $-217 | -5% $-309 | +0% $-401 | +5% $-493 | +10% $-585 |
|---|---|---|---|---|---|
| Rent | -10% $-609 | -5% $-505 | +0% $-401 | +5% $-297 | +10% $-193 |
| Rate | -1.0pp $-237 | -0.5pp $-318 | base $-401 | +0.5pp $-485 | +1.0pp $-571 |
UW: 25.0% down · 7.5% · 30yr · 1.5% tax · 5.0% vac · 8.0% maint · 8.0% mgmt
Financing live
Cash to close
- Down payment
- $81,225
- Closing costs
- $9,747
- Reserves months
- —
- Total cash needed
- —
Loan-product check · same deal, 3 products live
Conventional
25% down · 7.5% · 30yr
- Down + closing
- —
- Monthly P&I
- —
- Monthly cashflow
- —
- DSCR
- —
- Eligible?
- —
Personal DTI + credit; lowest rate.
DSCR
20% down · 8.5% · 30yr
- Down + closing
- —
- Monthly P&I
- —
- Monthly cashflow
- —
- DSCR
- —
- Eligible?
- —
No personal income docs; deal must DSCR.
Hard money
10% down · 12.0% · 12mo
- Down + closing
- —
- Monthly P&I
- —
- Monthly cashflow
- —
- DSCR
- —
- Eligible?
- —
Short-term bridge; refi at stabilization.
Rent comps 1 comps
| Address | Beds | Baths | Sqft | Rent | $/sqft | DOM | Units | Dist |
|---|---|---|---|---|---|---|---|---|
| 7420 Shallow Creek Trl Victor, NY | 2.0–3.0 | 2.0 | 1293 | $2,285 | $1.77 | 5d | 17 | 1.20mi |
Listing history 4 events
-
2026-05-12$324,900 Active 1139-char remark
-
2007-05-02soldstatus $1,800 250-char remark
Show marketing remark (250 chars)
Completely updated 2700sq' home- includes lower level. Walking distance to Victor school and downtown. Includes all appliances with washer and dryer. Walkout Lower level is professionally finished. Would consider leaving home furnished for extra fee.
-
2007-04-27$1,800 250-char remark
Show marketing remark (250 chars)
Completely updated 2700sq' home- includes lower level. Walking distance to Victor school and downtown. Includes all appliances with washer and dryer. Walkout Lower level is professionally finished. Would consider leaving home furnished for extra fee.
-
2004-06-25soldstatus $180,000
ⓘ Source: listings_history table (triggers on properties + properties_extension) + one-shot
backfill from property_details.listing_events for pre-trigger history.
Tax reassessment forecast NY · Partial reset (capped growth)
- Current annual tax
- $7,677 · $640/mo
- Projected year-2 tax
- $7,677 · $640/mo
- Expected delta
- $0/yr ($0/mo · 0.0%)
ⓘ Screening estimate from a state-policy table — verify with the county assessor before closing.
Climate risk First Street
- Flood 1/10 Low FEMA zone X (unshaded) · 0% chance over 30 yrs
- Wildfire 3/10 Moderate
- Heat 2/10 Low 7 d/yr ≥95°F today · 16 d/yr by 30 yrs out
- Wind 1/10 Low
- Air quality 2/10 Low 0 unhealthy d/yr today · 1 by 30 yrs out
Nearby sold comps map
Loading sold comps map…
Walkable amenities ~0.75 mi
Loading nearby amenities…
Taxation est. · year 1
- Rental income
- $31,563
- − Mortgage interest
- −$18,199
- − Property taxes
- −$7,677
- − Insurance
- −$1,624
- − Repairs & maintenance
- −$2,525
- − Management
- −$2,525
- − Depreciation
- −$9,452
- Taxable loss
- −$10,440
- Est. tax savings @ 24.0%
- +$2,506
- After-tax cash flow
- $-2,307/yr
For passive investors: Depreciation is non-cash, so a rental often shows a tax loss while cash-flowing — sheltering income. Rental losses are passive: they offset passive income freely, and up to $25,000/yr can offset ordinary (W-2) income if you actively participate and your MAGI is under $100k (phasing out to $0 by $150k); unused losses carry forward. On sale, claimed depreciation is recaptured at up to 25%, and gains may owe capital-gains tax (a 1031 exchange can defer both). Figures are a year-1 estimate at your 24.0% rate — not tax advice; consult a CPA.
Schools (NCES district)
- District
- Victor Central School District
- NCES district ID
- 3629640
- Math proficiency
- 56% ▼ -18.00%
- Reading proficiency
- 62% ▲ 3.00%
- Median HH income
- $73,046
- Composite
- 52.43/100
- National rank
- #1575
- State rank
- #222 of 590 in NY
Livability — Victor
- Score
- 79/100
- State rank
- #122
- US rank
- #1991
Category grades
Schools grade is shown separately in the Schools card above.
Census & demographics
- Census place
- Victor, NY
- County
- Ontario County · 58,989 people
- City population
- 16,364
- Metro
- Rochester, NY
- Population (ZIP)
- 16,364
- Household income
- $115,625
- Rent vs Own
- Severe rent burden
- 357.0
Population outlook (Ontario County) Hauer SSP2
- Today (2025)
- 111,230 people
- By 2030
- 111,401 · +0.2%
- By 2040
- 109,535 · -1.5%
- By 2050
- 104,895 · -5.7%
- By 2075
- 92,999 · -16.4%
- By 2100
- 73,723 · -33.7%
Race, ethnicity, and origin ACS 2023
- Neighborhood character
- Predominantly White (89%)
- Race & ethnicity
- White 89% Two or more races 4% Hispanic / Latino 4% Asian 4% Black 1%
- Common ancestry
- Romanian 6% Iranian 3% Lithuanian 2%
- Foreign-born
- 7% · South Korea, Canada
- Languages at home
- 92% English-only · Other Indo-European 4% Spanish 1% German/W. Germanic 1%
Political lean MEDSL · Ontario
- 2024 margin
- Toss-up / Even · D 49.4% · R 50.6%
- 2008→2024 swing
- -1.0pp toward R · 2008: -0.1pp · 2024: -1.2pp
- All cycles
- 2024: R+1.2 2020: R+0.0 2016: R+8.6 2012: R+1.6 2008: R+0.1
Not yet ingested
- Civics
- —
Market trends
- HPI YoY
- ▼ -40.90%
- Current HPI
- 279.9821
- Rent YoY
- —
- Metro
- Rochester, NY
- State GDP YoY
- ▲ 2.60%
- F500 in state
- 92
Industry mix (Fortune 500 HQ in NY)
| Industry | F500 HQs | Revenue |
|---|---|---|
| Financial Services | 10 | $950B |
|
||
| Consumer Goods | 9 | $162B |
|
||
| Insurance | 4 | $225B |
|
||
| Telecommunications | 2 | $144B |
|
||
| Pharmaceuticals | 2 | $112B |
|
||
| Media / Entertainment | 2 | $69B |
|
||
Price history
+80.5% since first listed5 events — show timeline
- 2026-05-20 Pending — UNYREIS
- 2026-05-12 Listed $324,900 UNYREIS
- 2007-05-02 Sold (MLS) $1,800 UNYREIS
- 2007-04-27 Listed $1,800 UNYREIS
- 2004-06-25 Sold (Public Records) $180,000 Public Records
Property tax history
+3.0%/yrLatest (2025): $7,677 · -0.5% YoY. Source: county tax records.
Cash-flow waterfall
monthlySold comps — $/sqft
last 12 mo · ≤1 miLoading sold comps…