 6-Plex
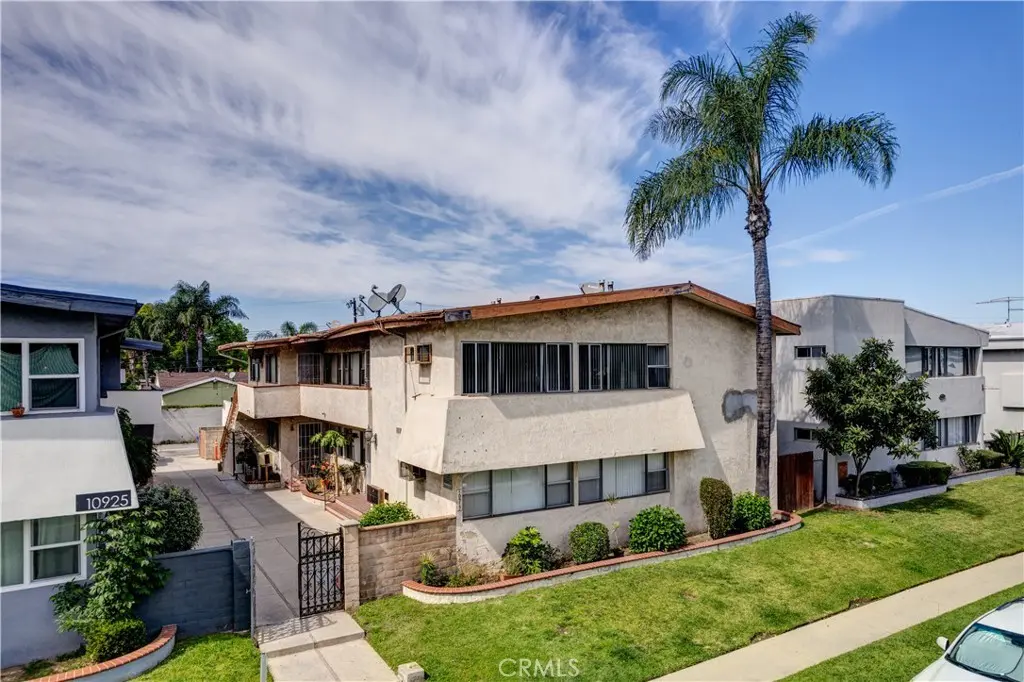
10919 Pioneer Blvd · Santa Fe Springs, CA
Flood risk 3/10 · Minor
- FEMA flood zone
- X
- Chance of flooding over 30 yrs
- 0.18%
- Est. flood insurance / yr
- $507 – $1,088
Fire risk 1/10 · Minimal
- Est. fire insurance / yr
- $659 – $1,223
Heat risk 5/10 · Moderate
- Hot days now (above 93°F)
- 7 days/yr
- Hot days in 30 yrs
- 20 days/yr
Wind risk 1/10 · Minimal
- Chance of severe wind over 30 yrs
- —
Air-quality risk 5/10 · Moderate
- Unhealthy air days now
- 7 days/yr
- Unhealthy air days in 30 yrs
- 9 days/yr
Risk factors via First Street. Map © Google.
Why this score? — see what drove the C- grade
The composite is a weighted blend of 9 inputs, each scored 0–100. Each bar is that input's sub-score; the figure is the points it added to the 100-point composite (weight × sub-score).
- Cash flow +21.2/30.0
- ARV discount +7.5/15.0
- DSCR +6.8/10.0
- 1% rule +4.8/10.0
- Schools +4.6/10.0
- Rent growth +2.5/5.0
- Condition / age +2.5/5.0
- Livability +2.3/5.0
- Appreciation +0.0/10.0
$1,499,000
🖨 Deal sheet 📄 Offer letter ✓ Due diligence
Multi-family units
County records classify this as Multi-Family (5+ Unit). Listing-text estimate: 6 units. confirmed
5+ unit building — per-unit beds/baths from public records are typically unavailable; the breakdown below (if shown) is an estimate from the listing text.
Listing remarks
Exceptional investment opportunity in the heart of Santa Fe Springs. Located at 10919 Pioneer Blvd, this well-positioned 6-unit apartment building. 6 -one bedroom | one bath units with two units having had complete rehabs. Offering 4660 of living space, on a 6353 square foot lot. Common area laundry and garages with access from rear alley, one unit has it's own in unit stackable laundry. Each unit offers functional layouts appealing to a broad tenant base, making this an ideal asset for both seasoned investors and those looking to enter the multifamily space. Situated on a prime stretch of Pioneer Blvd, the property benefits from excellent visibility and convenient access to major freeways,
Key facts
- 6,355 sq ft lot
- 6 garage spots
- Built 1958
Property features AI
Finance
- Other: Property does not include an ADU
- Financial info: Total building area reported as 6,353; Gross scheduled income: $104,054; Gross income: $104,054; Total actual rent collected monthly: $8,671; Net operating income: $49,925; Operating expenses: $54,129; Total expenses: $25,989; Insurance expense: $9,621; Water/sewer expense: $2,700; Trash expense: $7,800; Electric expense: $302; Tenants pay gas and electricity; 6 of 6 units leased
- HOA & community: Suburban community setting
Exterior
- Parking: 6 total parking spaces; Each unit includes an attached 1-car garage (6 attached garages total)
- Utilities: Public sewer; District/public water; Six separate electric meters; Six separate gas meters; One separate water meter
- Home design: Attached multi-unit property; Two stories; Entry at ground level
- Construction: Single building containing all units; Built (year per assessor)
- Exterior features: No pool; Walkstreet lot feature
Interior
- Kitchen: Kitchens included in each unit (standard apartment kitchens)
- Bedrooms: Six 1-bedroom units (each unit listed as 1 bed)
- Bathrooms: Each unit has 1 full bathroom
- Heating & cooling: Wall heaters; Wall/window cooling units
- Interior features: Two-level layout; Ground-floor entry
- Laundry & utility: On-site community/area laundry
Neighborhood map
What this means for you Summary
Snapshot
- This is a 6 × 1-bed/1-bath units multifamily listed at $1.50M.
Deal economics
- At list price, monthly cash flow is $2k ($26k/yr) — positive. Per door: $361/mo.
- The deal already cash-flows at list — no discount required.
- To meet the 1% rule (rent ≥ 1% of price), the offer needs to be $1.47M (2.1% below list).
- Recommended offer: $1.41M (6.0% below list) — sets the bar for market timing.
- Cap rate 8.0% vs local median 3.2% in Santa Fe Springs — top-decile yield for the area; either an underpriced asset or a hidden risk that comps aren't pricing in. Stress-test before assuming the spread holds.
Location & tenants
- Location reads 46/100 on livability (#1,285 in CA) — a working-class tenant base; expect higher turnover. Strengths: employment B+; Watch: schools D, crime F, amenities F.
- Little Lake City Elementary (suburban): math 43% / reading 56% proficiency, ranked #417 of 1,400 in CA (top 30%) — families likely to look elsewhere, expect single-tenant / working-renter base with shorter leases.
- Market conditions: 14 active listings in the ZIP; solid renter incomes; 19,697 units permitted in Los Angeles County in 2024 (9,426 in 5+ unit buildings).
- At $14,678/mo this rent would consume 198% of the median local household income ($89k/yr) (locally 477% of renters already pay >50% of income on rent) — very limited rent-growth headroom before tenants either downsize or default.
Forward outlook
- Local home prices are declining (-3.0%/yr); year-one equity from $10k of loan paydown is wiped out by about $45k of value loss. Plan a longer hold.
- Los Angeles County population projected at +9% by 2050 — modest demand growth; plan on rents tracking national, not racing it.
Negotiation context
- It's been on market 84 days — a 6% lower offer ($1.41M) is reasonable based on typical stale-listing flexibility.
- 4 sale attempts since 23y ago; this cycle's ask has dropped $101k (6%) from the opening price — seller is motivated, your offer sets the floor, not the list.
- Current owner paid $550k; list at $1.50M implies a 173% gain — meaningful room to come down on a strong offer.
Risks & watch-outs
- Watch-outs: built in 1958 — expect roof / HVAC / electrical / plumbing capex.
- Climate carrying-cost: extreme-heat days projected 7→20/yr by 2055 (HVAC capex compounding) — expect insurance premiums to compound above CPI over the hold.
Questions for the listing agent
- It's been on market 84 days. Have you received any prior offers? Is the seller open to a 6% concession, seller financing, or rate buy-down credit?
- Can we see the unit-by-unit rent roll, current vacancy, and any below-market leases? What's the average tenancy length?
- What capital expenditures (roof, boiler, parking lot, exteriors) have been made in the last 5 years, and what's planned in the next 2?
- Built in 1958 — when were the roof, HVAC, electrical panel, plumbing, and water heater last replaced?
- Why hasn't it sold? Are there any deal-killer items the seller is aware of (foundation, flood, title, zoning, code violations)?
- Is there a deadline driving the sale (1031 exchange, divorce, estate, relocation)? That informs how much negotiation room exists.
- Schools are D-rated, which usually means shorter tenancies and higher turnover. Who's the typical renter profile here, and what's been the actual vacancy rate?
- Crime grade is F in this area — have there been break-ins, vandalism, or insurance claims at this property in the last 3 years? What carrier currently insures it and at what premium?
- What's the average days-on-market for RENTAL listings here right now (not sales)? A rising rental-DOM trend means longer vacancies and softer asking-rent achievability than the comps imply.
- What's the recent tenant-quality profile in this submarket — average credit score on applications, eviction rate, late-payment / NSF rate, and stable-employment percentage? A property-management company in the area should have these aggregated.
- How much new apartment / multifamily construction is in the pipeline within 1–3 miles? Heavy new supply (>2% of stock underway) typically softens rents 12–24 months out; light construction supports rent growth.
Investment metrics
- 1% rule
- 0.98% ✗
- Cap rate
- 8.03%
- Cash-on-cash
- 6.20%
- DSCR
- 1.28
- GRM
- 8.5
CMA / ARV
No comps found within radius.
Projected returns pro-forma
-3.0% appreciation · 3.0% rent growth · sell at horizon
- IRR
- -6.8%
- Equity multiple
- 0.75×
- Total profit
- $-105,194
- Equity at exit
- $223,506
- IRR
- 2.8%
- Equity multiple
- 1.20×
- Total profit
- $84,747
- Equity at exit
- $129,606
Cash invested: $419,720 (down + closing). Projections, not guarantees.
Landlord ↔ Tenant lean methodology
- Overall (STATE)
- 18 Strongly Tenant-Friendly
- State California
- 18 Strongly Tenant-Friendly · D+13
- County
- — inherits STATE
- City
- — inherits STATE
ZIP-level market 90670
- Active inventory
- 14
- Price-to-rent
- 51.1×
Monthly cashflow live
- Estimated rent
- $14,678 high interval (Pro) →
- Mortgage (P&I)
- −$7,861
- Tax from tax record
- −$942 /mo · $11,310/yr
- Insurance
- −$625
- HOA
- −$0
- Vacancy / Maint / Mgmt
- −$3,082
- Net cashflow
- $2,168
Break-even live
6-unit breakdown (identical units grouped — click to expand)
| Units | Beds | Baths | Est. rent |
|---|---|---|---|
| 6× units | 1 | 1 | $14,676 |
| #1 | 1 | 1 | $2,446 |
| #2 | 1 | 1 | $2,446 |
| #3 | 1 | 1 | $2,446 |
| #4 | 1 | 1 | $2,446 |
| #5 | 1 | 1 | $2,446 |
| #6 | 1 | 1 | $2,446 |
| Total (6 units) | $14,678 | ||
UW: 25.0% down · 7.5% · 30yr · 1.5% tax · 5.0% vac · 8.0% maint · 8.0% mgmt
Financing live
Cash to close
- Down payment
- $374,750
- Closing costs
- $44,970
- Reserves months
- —
- Total cash needed
- —
Loan-product check · same deal, 3 products live
Conventional
25% down · 7.5% · 30yr
- Down + closing
- —
- Monthly P&I
- —
- Monthly cashflow
- —
- DSCR
- —
- Eligible?
- —
Personal DTI + credit; lowest rate.
DSCR
20% down · 8.5% · 30yr
- Down + closing
- —
- Monthly P&I
- —
- Monthly cashflow
- —
- DSCR
- —
- Eligible?
- —
No personal income docs; deal must DSCR.
Hard money
10% down · 12.0% · 12mo
- Down + closing
- —
- Monthly P&I
- —
- Monthly cashflow
- —
- DSCR
- —
- Eligible?
- —
Short-term bridge; refi at stabilization.
Listing history 25 events
-
2026-06-18days on market $1,499,000 Active 84 DOM
-
2026-06-17days on market $1,499,000 Active 83 DOM
-
2026-06-16days on market $1,499,000 Active 82 DOM
-
2026-06-15price $1,499,000 Active 81 DOM
-
2026-06-15days on market $1,550,000 Active 81 DOM
-
2026-06-13days on market $1,550,000 Active 79 DOM
-
2026-06-13days on market $1,550,000 Active 78 DOM
-
2026-06-09days on market $1,550,000 Active 75 DOM
-
2026-06-08days on market $1,550,000 Active 74 DOM
-
2026-06-07days on market $1,550,000 Active 73 DOM
-
2026-06-04days on market $1,550,000 Active 70 DOM
-
2026-06-03days on market $1,550,000 Active 69 DOM
-
2026-06-02days on market $1,550,000 Active 68 DOM
-
2026-06-01days on market $1,550,000 Active 67 DOM
-
2026-05-31days on market $1,550,000 Active 66 DOM
-
2026-04-08price $1,550,000
-
2026-03-26$1,600,000 Active
-
2024-03-28historical $1,695
-
2024-03-13$1,695
-
2023-06-17historical
-
2005-12-31historical
-
2005-05-30$1,200,000
-
2003-08-22soldstatus $550,000
-
2003-07-05historical
-
2003-04-11$575,000
ⓘ Source: listings_history table (triggers on properties + properties_extension) + one-shot
backfill from property_details.listing_events for pre-trigger history.
Tax reassessment forecast CA · Resets to sale price
- Current annual tax
- $11,310 · $942/mo
- Projected year-2 tax
- $11,392 · $949/mo
- Expected delta
- +$83/yr (+$7/mo · 0.7%)
ⓘ Screening estimate from a state-policy table — verify with the county assessor before closing.
Climate risk First Street
- Flood 3/10 Moderate FEMA zone X · 18% chance over 30 yrs
- Wildfire 1/10 Low
- Heat 5/10 Major 7 d/yr ≥93°F today · 20 d/yr by 30 yrs out
- Wind 1/10 Low
- Air quality 5/10 Major 7 unhealthy d/yr today · 9 by 30 yrs out
Nearby sold comps map
Loading sold comps map…
Walkable amenities ~0.75 mi
Loading nearby amenities…
Taxation est. · year 1
- Rental income
- $176,136
- − Mortgage interest
- −$83,967
- − Property taxes
- −$11,310
- − Insurance
- −$7,495
- − Repairs & maintenance
- −$14,091
- − Management
- −$14,091
- − Depreciation
- −$43,607
- Taxable income
- $1,575
- Est. tax owed @ 24.0%
- −$378
- After-tax cash flow
- $25,634/yr
For passive investors: Depreciation is non-cash, so a rental often shows a tax loss while cash-flowing — sheltering income. Rental losses are passive: they offset passive income freely, and up to $25,000/yr can offset ordinary (W-2) income if you actively participate and your MAGI is under $100k (phasing out to $0 by $150k); unused losses carry forward. On sale, claimed depreciation is recaptured at up to 25%, and gains may owe capital-gains tax (a 1031 exchange can defer both). Figures are a year-1 estimate at your 24.0% rate — not tax advice; consult a CPA.
Schools (NCES district)
- District
- Little Lake City Elementary
- NCES district ID
- 0621930
- Math proficiency
- 43% ▲ 1.00%
- Reading proficiency
- 56% ▼ -1.00%
- Median HH income
- $65,748
- Composite
- 45.88/100
- National rank
- #5552
- State rank
- #417 of 1400 in CA
Livability — Santa Fe Springs
- Score
- 46/100
- State rank
- #1285
- US rank
- #26499
Category grades
Schools grade is shown separately in the Schools card above.
Census & demographics
- Census place
- Santa Fe Springs, CA
- County
- Los Angeles County · 9,444,647 people
- City population
- 17,851
- Metro
- Los Angeles-Long Beach-Anaheim, CA
- Population (ZIP)
- 17,851
- Household income
- $88,872
- Rent vs Own
- Severe rent burden
- 477.0
Population outlook (Los Angeles County) Hauer SSP2
- Today (2025)
- 10,940,515 people
- By 2030
- 11,256,481 · +2.9%
- By 2040
- 11,729,929 · +7.2%
- By 2050
- 11,948,407 · +9.2%
- By 2075
- 11,818,114 · +8.0%
- By 2100
- 10,842,928 · -0.9%
Race, ethnicity, and origin ACS 2023
- Neighborhood character
- Predominantly Hispanic (76%)
- Race & ethnicity
- Hispanic / Latino 76% Two or more races 21% White 9% Asian 8% Native American 2% Pacific Islander 2% Black 2%
- Hispanic origin (detail)
- Mexican 63% Puerto Rican 2% Cuban 1%
- Common ancestry
- Italian 2% British 1%
- Foreign-born
- 24% · Canada, South Korea, China
- Languages at home
- 47% English-only · Spanish 44% Other Asian/Pacific 2% Korean 2%
Political lean MEDSL · Los Angeles
- 2024 margin
- Solid D (+32.9) · D 64.8% · R 31.9% · Other 3.3%
- 2008→2024 swing
- -7.4pp toward R · 2008: 40.4pp · 2024: 32.9pp
- All cycles
- 2024: D+32.9 2020: D+44.2 2016: D+48.0 2012: D+40.0 2008: D+40.4
Not yet ingested
- Civics
- —
Market trends
- HPI YoY
- ▼ -478.15%
- Current HPI
- 443.7107
- Rent YoY
- —
- Metro
- Los Angeles-Long Beach-Anaheim, CA
- State GDP YoY
- ▲ 3.21%
- F500 in state
- 116
Industry mix (Fortune 500 HQ in CA)
| Industry | F500 HQs | Revenue |
|---|---|---|
| Technology | 27 | $1,492B |
|
||
| Financial Services | 3 | $174B |
|
||
| Retail | 3 | $44B |
|
||
| Insurance | 3 | $26B |
|
||
| Media / Entertainment | 2 | $115B |
|
||
| Pharmaceuticals / Biotech | 2 | $62B |
|
||
Price history
+169.6% since first listed10 events — show timeline
- 2026-04-08 Price Changed $1,550,000 CRMLS
- 2026-03-26 Listed $1,600,000 CRMLS
- 2024-03-28 Rental Removed $1,695 APPFOLIO
- 2024-03-13 Listed for Rent $1,695 APPFOLIO
- 2023-06-17 Rental Removed — APPFOLIO
- 2005-12-31 Listing Removed — CRMLS
- 2005-05-30 Listed $1,200,000 CRMLS
- 2003-08-22 Sold (Public Records) $550,000 Public Records
- 2003-07-05 Listing Removed — CRMLS
- 2003-04-11 Listed $575,000 CRMLS
Property tax history
+2.1%/yrLatest (2025): $11,310 · +4.9% YoY. Source: county tax records.
Cash-flow waterfall
monthlySold comps — $/sqft
last 12 mo · ≤1 miLoading sold comps…