1421 George Robbins · Cave Springs, AR
Flood risk No data
- FEMA flood zone
- —
- Chance of flooding over 30 yrs
- —
- Est. flood insurance / yr
- —
Fire risk No data
- Est. fire insurance / yr
- —
Heat risk No data
- Hot days now (above threshold)
- —
- Hot days in 30 yrs
- —
Wind risk No data
- Chance of severe wind over 30 yrs
- —
Air-quality risk No data
- Unhealthy air days now
- —
- Unhealthy air days in 30 yrs
- —
Risk factors via First Street. Map © Google.
Why this score? — see what drove the D- grade
The composite is a weighted blend of 9 inputs, each scored 0–100. Each bar is that input's sub-score; the figure is the points it added to the 100-point composite (weight × sub-score).
- Appreciation +10.0/10.0
- Cash flow +6.7/30.0
- ARV discount +5.7/15.0
- Schools +5.2/10.0
- Livability +3.6/5.0
- Rent growth +2.5/5.0
- Condition / age +2.5/5.0
- 1% rule +1.3/10.0
- DSCR +0.9/10.0
$525,000
🖨 Deal sheet (PDF) 📄 Offer letter ✓ Due diligence
Listing remarks MLS
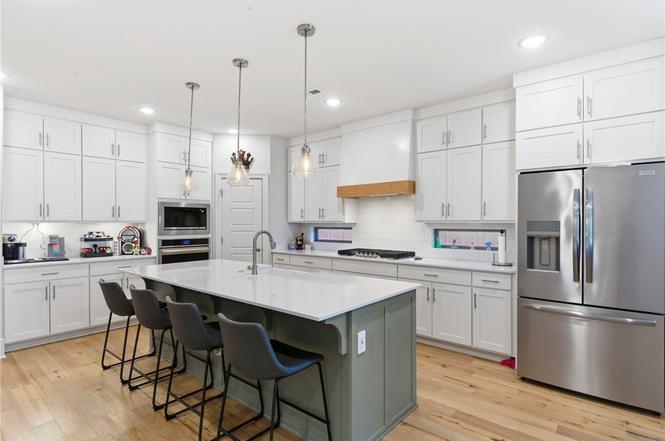
Very open and inviting floor plan featuring 3 bedrooms 2 bath plus a study, a formal dining area that could be used as a second living space. The open Kitchen and living Room is the heart and soul of this home, making it the perfect place for friends and family to gather. The outdoor covered patio with a fireplace and TV connection expands your living space to the outdoors. Call us today and we will introduce you to your new home.
Key facts
- Single-story home
- Chefs kitchen
- Fireplace
Tags
Property features AI
Finance
- HOA & community: Annual association fee of $525; Community amenities: playground, pool, park, nearby shopping, near hospital, near schools
Exterior
- Parking: Attached garage with garage door opener; 2 covered parking spaces
- Security: Smoke detector(s)
- Utilities: Electricity available; Natural gas available; Public water; Septic (septic tank)
- Home design: Single-story home; Brick construction; Architectural shingle roof; Slab foundation
- Construction: Brick exterior; Architectural shingle roof; Slab foundation
- Exterior features: Covered patio; Concrete driveway; Community pool; Near park; Located in a subdivision; Public road frontage; Smoke detectors
Interior
- Kitchen: Built-in range; Built-in oven; Gas cooktop; Electric oven; Dishwasher; Microwave; Exhaust fan; Disposal; Quartz counters
- Bedrooms: Split bedrooms layout
- Flooring: Carpet; Tile; Wood
- Bathrooms: 2 full bathrooms
- Heating & cooling: Gas heating; Central electric air conditioning
- Interior features: Ceiling fans; Eat-in kitchen; Pantry; Quartz counters; Split bedroom floorplan; Walk-in closets; Library; Office; Gas log fireplace (outside access)
- Laundry & utility: Washer hookup; Dryer hookup; Tankless water heater
Neighborhood map
What this means for you Summary
Snapshot
- This is a 3-bed/2.0-bath single-family listed at $525k.
Deal economics
- At list price, monthly cash flow is $-846 ($-10k/yr) — negative.
- To cash-flow at today's rent, offer at most $375k (28.5% below list).
- To meet the 1% rule (rent ≥ 1% of price), the offer needs to be $333k (36.5% below list).
- Recommended offer: $333k (36.5% below list) — sets the bar for 1% rule.
- Cap rate 4.4% vs local median 3.4% in Cave Springs — meaningfully above typical; check what's discounted (condition, days-on-market, listing class) to confirm the premium yield is real.
Location & tenants
- Location reads 71/100 on livability (#41 in AR) — a middle-class / working-renter tenant base. Strengths: crime A+, employment A+, housing A+; Watch: cost of living C-, schools D, amenities F.
- Bentonville School District (urban): math 59% / reading 59% proficiency, ranked #3 of 238 in AR (top 1%) — acceptable for families but not a draw, mixed tenant base, ~2y average lease.
- Market conditions: 112 active listings in the ZIP; 13 comparable units currently listed for rent nearby; rentals at typical pace (median 16d on market — plan ~3-4 weeks tenant-placement turnaround); 4,359 units permitted in Benton County in 2024 (402 in 5+ unit buildings).
Forward outlook
- In year one you build about $56k of equity ($4k loan paydown + $52k appreciation (10.0% local appreciation)).
- Benton County population projected at +56% by 2050 — long-run rental-demand tailwind backs the buy-and-hold thesis.
- By year 2, paydown + projected appreciation supports a ~$90k cash-out refi (75% LTV) — recoverable capital for the next deal without selling this one.
Negotiation context
- It's been on market 137 days — a 12% lower offer ($462k) is reasonable based on typical stale-listing flexibility.
- 4 sale attempts since 4y ago with the ask held roughly flat each time — persistent listings suggest the price (not the market) is what's stuck; bring a comps-based counter.
Questions for the listing agent
- What do current leases actually rent for vs. the listed asking? Can we see a recent rent roll and the last 12 months of T-12 income?
- It's been on market 137 days. Have you received any prior offers? Is the seller open to a 37% concession, seller financing, or rate buy-down credit?
- What does the HOA fee cover, when was the last increase, and are there any pending special assessments or reserve-fund shortfalls?
- Why hasn't it sold? Are there any deal-killer items the seller is aware of (foundation, flood, title, zoning, code violations)?
- Is there a deadline driving the sale (1031 exchange, divorce, estate, relocation)? That informs how much negotiation room exists.
- Schools are D-rated, which usually means shorter tenancies and higher turnover. Who's the typical renter profile here, and what's been the actual vacancy rate?
- The area grade is low — what's the realistic commute time and amenity access for the typical tenant pool here? Any planned neighborhood developments (good or bad) we should know about?
- What's the average days-on-market for RENTAL listings here right now (not sales)? A rising rental-DOM trend means longer vacancies and softer asking-rent achievability than the comps imply.
- What's the recent tenant-quality profile in this submarket — average credit score on applications, eviction rate, late-payment / NSF rate, and stable-employment percentage? A property-management company in the area should have these aggregated.
- How much new for-sale + rental construction is in the pipeline within 1–3 miles? Heavy new supply typically softens prices + rents 12–24 months out; constrained supply supports both.
Investment metrics
- 1% rule
- 0.63% ✗
- Cap rate
- 4.36%
- Cash-on-cash
- -6.91%
- DSCR
- 0.69
- GRM
- 13.1
CMA / ARV
- ARV (on-the-fly)
- $505,197
- Comps found
- 12
Show comp detail 12 sales within ~0.75 mi
| Address | Dist | Beds/Ba | Sqft | Sold | Price | $/sf | Match |
|---|---|---|---|---|---|---|---|
| 1425 Elijahs Dr | 0.06mi | 4/2.0 (+1) | 2,048 (-2%) | 3mo | $540,000 | $264 | 87 |
| 626 Millwood | 0.16mi | 4/2.5 (+1) | 2,097 (+1%) | 2mo | $564,000 | $269 | 82 |
| 6202 S 62nd St | 0.24mi | 4/2.0 (+1) | 2,050 (-1%) | 2mo | $499,000 | $243 | 80 |
| 1406 George Robbins Ln | 0.09mi | 3/2.5 | 2,271 (+9%) | 5mo | $613,000 | $270 | 74 |
| 5703 S 66th St | 0.42mi | 4/2.5 (+1) | 2,056 (-1%) | 5mo | $422,000 | $205 | 67 |
| 6202 S 58th St | 0.43mi | 3/2.0 | 1,950 (-6%) | 4mo | $465,000 | $238 | 66 |
| 5701 S 66th St | 0.44mi | 3/2.5 | 2,228 (+7%) | 0mo | $510,000 | $229 | 65 |
| 1415 Gooseneck Ln | 0.39mi | 3/2.0 | 1,881 (-10%) | 2mo | $430,000 | $229 | 65 |
| 6307 S 58th St | 0.50mi | 3/2.5 | 2,197 (+6%) | 2mo | $532,000 | $242 | 64 |
| 1425 S Hampton Xing | 0.45mi | 4/2.5 (+1) | 2,264 (+9%) | 1mo | $529,000 | $234 | 57 |
| 6614 W Braebourne Dr | 0.53mi | 4/2.0 (+1) | 2,344 (+13%) | 1mo | $575,000 | $245 | 48 |
| 5500 Lanshire Dr | 0.68mi | 4/2.5 (+1) | 2,341 (+13%) | 3mo | $605,000 | $258 | 38 |
Match score weights: distance 35% · size 25% · config 20% · recency 20%. Top-matched comps best support the ARV.
Projected returns pro-forma
10.0% appreciation · 3.0% rent growth · sell at horizon
- IRR
- 19.4%
- Equity multiple
- 2.58×
- Total profit
- $231,978
- Equity at exit
- $472,962
- IRR
- 17.9%
- Equity multiple
- 5.94×
- Total profit
- $725,450
- Equity at exit
- $1,019,960
Cash invested: $147,000 (down + closing). Projections, not guarantees.
Landlord ↔ Tenant lean methodology
- Overall (STATE)
- 92 Strongly Landlord-Friendly
- State Arkansas
- 92 Strongly Landlord-Friendly · R+14
- County
- — inherits STATE
- City
- — inherits STATE
ZIP-level market 72718
- Home prices YoY
- 14.1%
- Active inventory
- 112
- Price-to-rent
- 13.1×
Monthly cashflow live
- Estimated rent
- $3,333 high interval (Pro) →
- Mortgage (P&I)
- −$2,753
- Tax from tax record
- −$464 /mo · $5,563/yr
- Insurance
- −$219
- HOA
- −$44
- Vacancy / Maint / Mgmt
- −$700
- Net cashflow
- $-846
Break-even live
Sensitivity live
| Price | -10% $-549 | -5% $-698 | +0% $-846 | +5% $-995 | +10% $-1,144 |
|---|---|---|---|---|---|
| Rent | -10% $-1,110 | -5% $-978 | +0% $-846 | +5% $-715 | +10% $-583 |
| Rate | -1.0pp $-582 | -0.5pp $-713 | base $-846 | +0.5pp $-982 | +1.0pp $-1,121 |
UW: 25.0% down · 7.5% · 30yr · 1.5% tax · 5.0% vac · 8.0% maint · 8.0% mgmt
Financing live
Cash to close
- Down payment
- $131,250
- Closing costs
- $15,750
- Reserves months
- —
- Total cash needed
- —
Loan-product check · same deal, 3 products live
Conventional
25% down · 7.5% · 30yr
- Down + closing
- —
- Monthly P&I
- —
- Monthly cashflow
- —
- DSCR
- —
- Eligible?
- —
Personal DTI + credit; lowest rate.
DSCR
20% down · 8.5% · 30yr
- Down + closing
- —
- Monthly P&I
- —
- Monthly cashflow
- —
- DSCR
- —
- Eligible?
- —
No personal income docs; deal must DSCR.
Hard money
10% down · 12.0% · 12mo
- Down + closing
- —
- Monthly P&I
- —
- Monthly cashflow
- —
- DSCR
- —
- Eligible?
- —
Short-term bridge; refi at stabilization.
Rent comps 13 comps
| Address | Beds | Baths | Sqft | Rent | $/sqft | DOM | Units | Dist |
|---|---|---|---|---|---|---|---|---|
| 6502 W Hearth Falls Dr Unit 1221804P Rogers, AR | 4.0 | 2.5 | 2443 | $6,688 | $2.74 | 15d | 1 | 0.61mi |
| 6508 W Stone Lake Dr Unit 1221824P Rogers, AR | 4.0 | 2.5 | 2271 | $7,860 | $3.46 | 16d | 1 | 0.68mi |
| 5313 S Stone Bay Ct Rogers, AR | 4.0 | 3.0 | 2110 | $3,300 | $1.56 | 16d | 1 | 0.91mi |
| 6506 W Knoll View Way Rogers, AR | 3.0 | 2.5 | 1746 | $2,700 | $1.55 | 16d | 1 | 0.93mi |
| 6505 S 50th St Rogers, AR | 4.0 | 2.0 | 1630 | $1,850 | $1.13 | 16d | 1 | 0.94mi |
| 5217 S 65th Pl Rogers, AR | 3.0 | 2.5 | 2055 | $2,400 | $1.17 | 25d | 1 | 0.95mi |
| 5217 S 65th Pl Rogers, AR | 3.0 | 2.5 | 2055 | $2,290 | $1.11 | 16d | 1 | 0.95mi |
| 6613 W Valley View Rd Rogers, AR | 4.0 | 2.5 | 2475 | $3,000 | $1.21 | 25d | 1 | 1.04mi |
| 6683 W Valley View Rd Rogers, AR | 4.0 | 2.5 | 2477 | $3,500 | $1.41 | 25d | 1 | 1.08mi |
| 6665 W Valley View Rd Rogers, AR | 3.0 | 2.0 | 1923 | $2,950 | $1.53 | 25d | 1 | 1.14mi |
| 4608 W Quelinda Dr Rogers, AR | 4.0 | 3.0 | 2859 | $3,000 | $1.05 | 25d | 1 | 1.26mi |
| 27 W La Quinta Ct Unit 1 Rogers, AR | 2.0 | 3.0 | 1750 | $2,700 | $1.54 | 25d | 1 | 1.42mi |
| 7 S Prairie Dunes Dr Rogers, AR | 3.0 | 2.5 | 1773 | $3,800 | $2.14 | 15d | 1 | 1.43mi |
HOA detail
- Monthly dues
- $44 · $528/yr
Listing history 22 events
-
2026-06-09status $525,000 Pending 137 DOM
-
2026-06-08days on market $525,000 Active 137 DOM
-
2026-06-07days on market $525,000 Active 136 DOM
-
2026-06-05days on market $525,000 Active 133 DOM
-
2026-06-03days on market $525,000 Active 132 DOM
-
2026-06-02days on market $525,000 Active 131 DOM
-
2026-06-01days on market $525,000 Active 130 DOM
-
2026-05-31days on market $525,000 Active 129 DOM
-
2026-05-31days on market $525,000 Active 128 DOM
-
2026-05-25status Active
-
2026-05-24historical
-
2026-04-14status Active
-
2026-04-14status Pending
-
2026-03-20price $525,000
-
2026-03-12price $545,000
-
2026-02-03price $550,000
-
2026-01-12$550,912 Active
-
2023-05-11soldstatus $456,615 Closed 434-char remark
Show marketing remark (434 chars)
Very open and inviting floor plan featuring 3 bedrooms 2 bath plus a study, a formal dining area that could be used as a second living space. The open Kitchen and living Room is the heart and soul of this home, making it the perfect place for friends and family to gather. The outdoor covered patio with a fireplace and TV connection expands your living space to the outdoors. Call us today and we will introduce you to your new home.
-
2023-03-31status Pending 434-char remark
Show marketing remark (434 chars)
Very open and inviting floor plan featuring 3 bedrooms 2 bath plus a study, a formal dining area that could be used as a second living space. The open Kitchen and living Room is the heart and soul of this home, making it the perfect place for friends and family to gather. The outdoor covered patio with a fireplace and TV connection expands your living space to the outdoors. Call us today and we will introduce you to your new home.
-
2023-03-27price $454,790 434-char remark
Show marketing remark (434 chars)
Very open and inviting floor plan featuring 3 bedrooms 2 bath plus a study, a formal dining area that could be used as a second living space. The open Kitchen and living Room is the heart and soul of this home, making it the perfect place for friends and family to gather. The outdoor covered patio with a fireplace and TV connection expands your living space to the outdoors. Call us today and we will introduce you to your new home.
-
2022-12-03price $467,790 434-char remark
Show marketing remark (434 chars)
Very open and inviting floor plan featuring 3 bedrooms 2 bath plus a study, a formal dining area that could be used as a second living space. The open Kitchen and living Room is the heart and soul of this home, making it the perfect place for friends and family to gather. The outdoor covered patio with a fireplace and TV connection expands your living space to the outdoors. Call us today and we will introduce you to your new home.
-
2022-10-26$464,790 Active 434-char remark
Show marketing remark (434 chars)
Very open and inviting floor plan featuring 3 bedrooms 2 bath plus a study, a formal dining area that could be used as a second living space. The open Kitchen and living Room is the heart and soul of this home, making it the perfect place for friends and family to gather. The outdoor covered patio with a fireplace and TV connection expands your living space to the outdoors. Call us today and we will introduce you to your new home.
ⓘ Source: listings_history table (triggers on properties + properties_extension) + one-shot
backfill from property_details.listing_events for pre-trigger history.
Tax reassessment forecast AR · Resets to sale price
- Current annual tax
- $5,563 · $464/mo
- Projected year-2 tax
- $5,563 · $464/mo
- Expected delta
- $0/yr ($0/mo · 0.0%)
ⓘ Screening estimate from a state-policy table — verify with the county assessor before closing.
Nearby sold comps map
Loading sold comps map…
Walkable amenities ~0.75 mi
Loading nearby amenities…
Taxation est. · year 1
- Rental income
- $39,996
- − Mortgage interest
- −$29,408
- − Property taxes
- −$5,563
- − Insurance
- −$2,625
- − Repairs & maintenance
- −$3,200
- − Management
- −$3,200
- − HOA
- −$528
- − Depreciation
- −$15,273
- Taxable loss
- −$19,800
- Est. tax savings @ 24.0%
- +$4,752
- After-tax cash flow
- $-5,405/yr
For passive investors: Depreciation is non-cash, so a rental often shows a tax loss while cash-flowing — sheltering income. Rental losses are passive: they offset passive income freely, and up to $25,000/yr can offset ordinary (W-2) income if you actively participate and your MAGI is under $100k (phasing out to $0 by $150k); unused losses carry forward. On sale, claimed depreciation is recaptured at up to 25%, and gains may owe capital-gains tax (a 1031 exchange can defer both). Figures are a year-1 estimate at your 24.0% rate — not tax advice; consult a CPA.
Schools (NCES district)
- District
- Bentonville School District
- NCES district ID
- 0503060
- Math proficiency
- 59% ▼ -8.00%
- Reading proficiency
- 59% ▼ -6.00%
- Median HH income
- $66,721
- Composite
- 51.85/100
- National rank
- #1661
- State rank
- #3 of 238 in AR
Livability — Cave Springs
- Score
- 71/100
- State rank
- #41
- US rank
- #6981
Category grades
Schools grade is shown separately in the Schools card above.
Census & demographics
- Census place
- Cave Springs, AR
- City population
- 5,528
- Population (ZIP)
- 5,528
Population outlook (Benton County) Hauer SSP2
- Today (2025)
- 318,683 people
- By 2030
- 353,481 · +10.9%
- By 2040
- 425,280 · +33.4%
- By 2050
- 497,239 · +56.0%
- By 2075
- 662,114 · +107.8%
- By 2100
- 776,431 · +143.6%
Race, ethnicity, and origin ACS 2023
- Neighborhood character
- Predominantly White (69%)
- Race & ethnicity
- White 69% Two or more races 25% Hispanic / Latino 7%
- Hispanic origin (detail)
- Mexican 5%
- Common ancestry
- Slovak 4% Romanian 3% Lithuanian 2%
- Foreign-born
- 3% · Canada
- Languages at home
- 92% English-only · Spanish 6% Other Asian/Pacific 2%
Political lean MEDSL · Benton
- 2024 margin
- Strong R (+27.0) · D 35.2% · R 62.1% · Other 2.7%
- 2008→2024 swing
- +9.6pp toward D · 2008: -36.5pp · 2024: -27.0pp
- All cycles
- 2024: R+27.0 2020: R+26.4 2016: R+34.9 2012: R+40.4 2008: R+36.5
Not yet ingested
- Civics
- —
Market trends
- HPI YoY
- ▲ 41.26%
- Current HPI
- 334.6594
- Rent YoY
- —
- Metro
- —
- State GDP YoY
- ▲ 3.80%
- F500 in state
- 10
Industry mix (Fortune 500 HQ in AR)
| Industry | F500 HQs | Revenue |
|---|---|---|
| Retail | 1 | $681B |
|
||
| Food / Agriculture | 1 | $53B |
|
||
| Retail / Energy | 1 | $22B |
|
||
| Transportation / Logistics | 1 | $12B |
|
||
| Energy | 1 | $4B |
|
||
Price history
+13.0% since first listed13 events — show timeline
- 2026-05-25 Relisted — NWARMLS
- 2026-05-24 Delisted — NWARMLS
- 2026-04-14 Relisted — NWARMLS
- 2026-04-14 Pending — NWARMLS
- 2026-03-20 Price Changed $525,000 NWARMLS
- 2026-03-12 Price Changed $545,000 NWARMLS
- 2026-02-03 Price Changed $550,000 NWARMLS
- 2026-01-12 Listed $550,912 NWARMLS
- 2023-05-11 Sold (MLS) $456,615 NWARMLS
- 2023-03-31 Pending — NWARMLS
- 2023-03-27 Price Changed $454,790 NWARMLS
- 2022-12-03 Price Changed $467,790 NWARMLS
- 2022-10-26 Listed $464,790 NWARMLS
Property tax history
+203.6%/yrLatest (2025): $5,563 · +822.0% YoY. Source: county tax records.
Cash-flow waterfall
monthlySold comps — $/sqft
last 12 mo · ≤1 miLoading sold comps…