6162 Shelby 419 · Shelbina, MO
Flood risk No data
- FEMA flood zone
- —
- Chance of flooding over 30 yrs
- —
- Est. flood insurance / yr
- —
Fire risk No data
- Est. fire insurance / yr
- —
Heat risk No data
- Hot days now (above threshold)
- —
- Hot days in 30 yrs
- —
Wind risk No data
- Chance of severe wind over 30 yrs
- —
Air-quality risk No data
- Unhealthy air days now
- —
- Unhealthy air days in 30 yrs
- —
Risk factors via First Street. Map © Google.
Why this score? — see what drove the C+ grade
The composite is a weighted blend of 9 inputs, each scored 0–100. Each bar is that input's sub-score; the figure is the points it added to the 100-point composite (weight × sub-score).
- Cash flow +21.8/30.0
- Appreciation +8.2/10.0
- ARV discount +7.5/15.0
- DSCR +7.0/10.0
- 1% rule +4.6/10.0
- Livability +3.4/5.0
- Schools +2.9/10.0
- Rent growth +2.5/5.0
- Condition / age +2.5/5.0
$140,000
🖨 Deal sheet (PDF) 📄 Offer letter ✓ Due diligence
Listing remarks
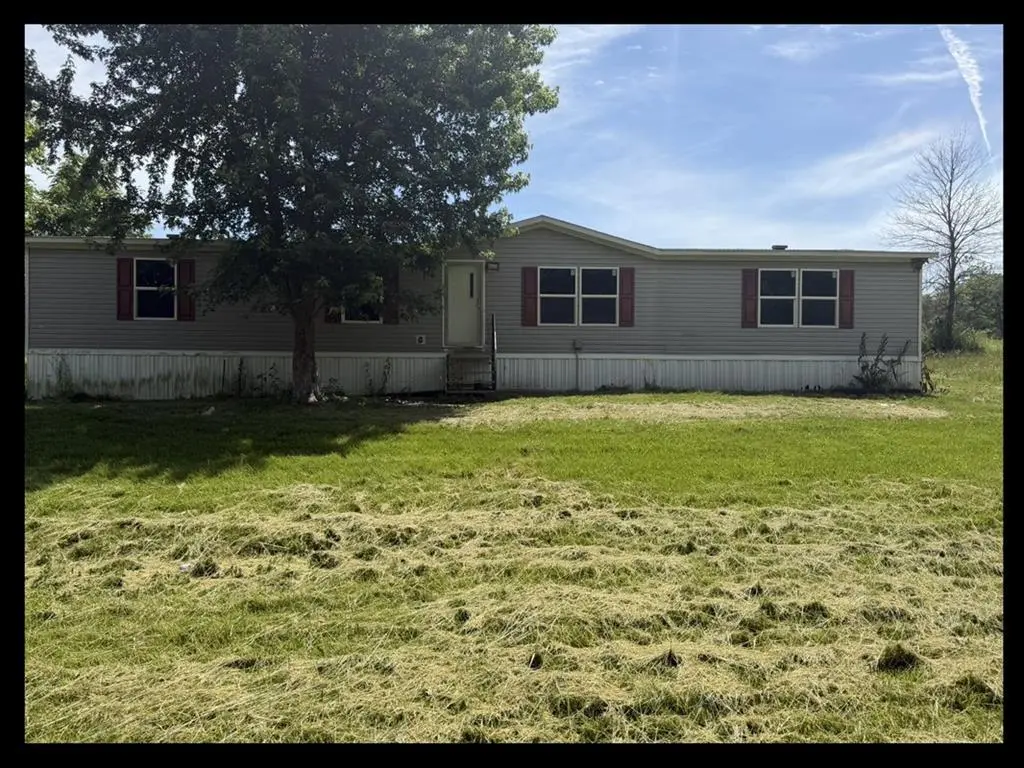
Enjoy peaceful country living in this 2019 modular home featuring 4 bedrooms and 2 bathrooms on 3 +/- acres in Shelby County, Missouri. The open floor plan offers a spacious living room and dining area, perfect for family gatherings. The private master suite is located on one end of the home and includes a large walk-in closet and ensuite bath, while the other three bedrooms and second bath are on the opposite end for added privacy. With plenty of outdoor space to enjoy, this home offers comfort and room to grow. Call or text Bobbie Barton at 573-355-8388 to schedule your showing today!
Key facts
- 3.42 acre lot
- Built 2019
- Listed 10 days
Property features AI
Exterior
- Utilities: Public water; Public sewer
- Home design: Single family residence; Single family with acreage
- Construction: Vinyl siding; Asphalt roof
- Exterior features: Storm door(s)
Interior
- Kitchen: Dishwasher; Electric oven; Electric range; Refrigerator
- Flooring: Vinyl flooring
- Bathrooms: 2 full bathrooms
- Heating & cooling: Central air conditioning
- Interior features: Dishwasher; Electric oven; Electric range; Refrigerator; Electric water heater
- Laundry & utility: Electric water heater
Neighborhood map
What this means for you Summary
Snapshot
- This is a 4-bed/2.0-bath manufactured listed at $140k.
Deal economics
- At list price, monthly cash flow is $217 ($3k/yr) — positive.
- The deal already cash-flows at list — no discount required.
- To meet the 1% rule (rent ≥ 1% of price), the offer needs to be $135k (3.5% below list).
- Recommended offer: $135k (3.5% below list) — sets the bar for 1% rule.
Location & tenants
- Location reads 68/100 on livability (#188 in MO) — a middle-class / working-renter tenant base. Strengths: cost of living A+, housing A; Watch: employment D, amenities F, commute F.
- Shelby County R-IV (rural): math 29% / reading 42% proficiency, ranked #224 of 324 in MO (top 69%) — families likely to look elsewhere, expect single-tenant / working-renter base with shorter leases.
- Market conditions: 13 active listings in the ZIP; 4 units permitted in Shelby County in 2024 (0 in 5+ unit buildings).
Forward outlook
- In year one you build about $10k of equity ($968 loan paydown + $9k appreciation (6.4% local appreciation)).
- Shelby County population projected at -26% by 2050 — secular population decline; favor cash flow + early exit over multi-decade hold.
- At projected returns (6.4% appreciation + 3.0% rent growth), your $39k cash investment doubles in ~3 years — after that, you're playing with house money.
- By year 4, paydown + projected appreciation supports a ~$34k cash-out refi (75% LTV) — recoverable capital for the next deal without selling this one.
Negotiation context
- Only 10 days on market — expect competitive offers; lowballing is unlikely to land.
Questions for the listing agent
- Is there a deadline driving the sale (1031 exchange, divorce, estate, relocation)? That informs how much negotiation room exists.
- What's the average days-on-market for RENTAL listings here right now (not sales)? A rising rental-DOM trend means longer vacancies and softer asking-rent achievability than the comps imply.
- What's the recent tenant-quality profile in this submarket — average credit score on applications, eviction rate, late-payment / NSF rate, and stable-employment percentage? A property-management company in the area should have these aggregated.
- How much new for-sale + rental construction is in the pipeline within 1–3 miles? Heavy new supply typically softens prices + rents 12–24 months out; constrained supply supports both.
Investment metrics
- 1% rule
- 0.96% ✗
- Cap rate
- 8.15%
- Cash-on-cash
- 6.63%
- DSCR
- 1.30
- GRM
- 8.6
CMA / ARV
No comps found within radius.
Projected returns pro-forma
6.42% appreciation · 3.0% rent growth · sell at horizon
- IRR
- 21.7%
- Equity multiple
- 2.47×
- Total profit
- $57,706
- Equity at exit
- $91,773
- IRR
- 20.5%
- Equity multiple
- 5.03×
- Total profit
- $157,986
- Equity at exit
- $169,776
Cash invested: $39,200 (down + closing). Projections, not guarantees.
Landlord ↔ Tenant lean methodology
- Overall (STATE)
- 81 Strongly Landlord-Friendly
- State Missouri
- 81 Strongly Landlord-Friendly · R+10
- County
- — inherits STATE
- City
- — inherits STATE
ZIP-level market 63468
- Home prices YoY
- 3.0%
- Active inventory
- 13
- Price-to-rent
- 8.6×
Monthly cashflow live
- Estimated rent
- $1,351 medium interval (Pro) →
- Mortgage (P&I)
- −$734
- Tax from tax record
- −$58 /mo · $697/yr
- Insurance
- −$58
- HOA
- −$0
- Vacancy / Maint / Mgmt
- −$284
- Net cashflow
- $217
Break-even live
Sensitivity live
| Price | -10% $296 | -5% $256 | +0% $217 | +5% $177 | +10% $137 |
|---|---|---|---|---|---|
| Rent | -10% $110 | -5% $163 | +0% $217 | +5% $270 | +10% $323 |
| Rate | -1.0pp $287 | -0.5pp $252 | base $217 | +0.5pp $180 | +1.0pp $143 |
UW: 25.0% down · 7.5% · 30yr · 1.5% tax · 5.0% vac · 8.0% maint · 8.0% mgmt
Financing live
Cash to close
- Down payment
- $35,000
- Closing costs
- $4,200
- Reserves months
- —
- Total cash needed
- —
Loan-product check · same deal, 3 products live
Conventional
25% down · 7.5% · 30yr
- Down + closing
- —
- Monthly P&I
- —
- Monthly cashflow
- —
- DSCR
- —
- Eligible?
- —
Personal DTI + credit; lowest rate.
DSCR
20% down · 8.5% · 30yr
- Down + closing
- —
- Monthly P&I
- —
- Monthly cashflow
- —
- DSCR
- —
- Eligible?
- —
No personal income docs; deal must DSCR.
Hard money
10% down · 12.0% · 12mo
- Down + closing
- —
- Monthly P&I
- —
- Monthly cashflow
- —
- DSCR
- —
- Eligible?
- —
Short-term bridge; refi at stabilization.
Listing history 9 events
-
2026-06-21days on market $140,000 Active 10 DOM
-
2026-06-21days on market $140,000 Active 9 DOM
-
2026-06-18days on market $140,000 Active 7 DOM
-
2026-06-17days on market $140,000 Active 6 DOM
-
2026-06-16days on market $140,000 Active 5 DOM
-
2026-06-15days on market $140,000 Active 4 DOM
-
2026-06-13days on market $140,000 Active 2 DOM
-
2026-06-12remarks 593-char remark
-
2026-06-12$140,000 Active 1 DOM
ⓘ Source: listings_history table (triggers on properties + properties_extension) + one-shot
backfill from property_details.listing_events for pre-trigger history.
Tax reassessment forecast MO · Resets to sale price
- Current annual tax
- $697 · $58/mo
- Projected year-2 tax
- $1,358 · $113/mo
- Expected delta
- +$661/yr (+$55/mo · 94.9%)
ⓘ Screening estimate from a state-policy table — verify with the county assessor before closing.
Nearby sold comps map
Loading sold comps map…
Walkable amenities ~0.75 mi
Loading nearby amenities…
Taxation est. · year 1
- Rental income
- $16,211
- − Mortgage interest
- −$7,842
- − Property taxes
- −$697
- − Insurance
- −$700
- − Repairs & maintenance
- −$1,297
- − Management
- −$1,297
- − Depreciation
- −$4,073
- Taxable income
- $306
- Est. tax owed @ 24.0%
- −$73
- After-tax cash flow
- $2,526/yr
For passive investors: Depreciation is non-cash, so a rental often shows a tax loss while cash-flowing — sheltering income. Rental losses are passive: they offset passive income freely, and up to $25,000/yr can offset ordinary (W-2) income if you actively participate and your MAGI is under $100k (phasing out to $0 by $150k); unused losses carry forward. On sale, claimed depreciation is recaptured at up to 25%, and gains may owe capital-gains tax (a 1031 exchange can defer both). Figures are a year-1 estimate at your 24.0% rate — not tax advice; consult a CPA.
Schools (NCES district)
- District
- Shelby County R-IV
- NCES district ID
- 2928110
- Math proficiency
- 29% ▼ -10.00%
- Reading proficiency
- 42% ▼ -3.00%
- Median HH income
- $36,627
- Composite
- 29.44/100
- National rank
- #6517
- State rank
- #224 of 324 in MO
Livability — Shelbina
- Score
- 68/100
- State rank
- #188
- US rank
- #9918
Category grades
Schools grade is shown separately in the Schools card above.
Census & demographics
- Population (ZIP)
- 2,523
Population outlook (Shelby County) Hauer SSP2
- Today (2025)
- 5,663 people
- By 2030
- 5,352 · -5.5%
- By 2040
- 4,762 · -15.9%
- By 2050
- 4,200 · -25.8%
- By 2075
- 3,058 · -46.0%
- By 2100
- 2,166 · -61.8%
Race, ethnicity, and origin ACS 2023
- Neighborhood character
- Predominantly White (96%)
- Race & ethnicity
- White 96% Two or more races 2% Hispanic / Latino 2%
- Common ancestry
- Lithuanian 5% Slovak 1% Serbian 1%
- Foreign-born
- 1% · Canada
- Languages at home
- 98% English-only · Spanish 1% Other Indo-European 1%
Political lean MEDSL · Shelby
- 2024 margin
- Solid R (+65.6) · D 16.9% · R 82.5%
- 2008→2024 swing
- -33.9pp toward R · 2008: -31.7pp · 2024: -65.6pp
- All cycles
- 2024: R+65.6 2020: R+62.9 2016: R+59.0 2012: R+37.8 2008: R+31.7
Not yet ingested
- Civics
- —
Market trends
- HPI YoY
- ▲ 6.42%
- Current HPI
- 216.9275
- Rent YoY
- —
- Metro
- —
- State GDP YoY
- ▲ 1.84%
- F500 in state
- 20
Industry mix (Fortune 500 HQ in MO)
| Industry | F500 HQs | Revenue |
|---|---|---|
| Healthcare | 1 | $163B |
|
||
| Insurance | 1 | $21B |
|
||
| Industrial Technology | 1 | $17B |
|
||
| Retail | 1 | $16B |
|
||
| Industrial Distribution | 1 | $10B |
|
||
| Utilities | 1 | $9B |
|
||
Price history
1 event — show timeline
- 2026-06-11 Listed $140,000 NECAR
Property tax history
+3.8%/yrLatest (2025): $697 · +9.7% YoY. Source: county tax records.
Cash-flow waterfall
monthlySold comps — $/sqft
last 12 mo · ≤1 miLoading sold comps…