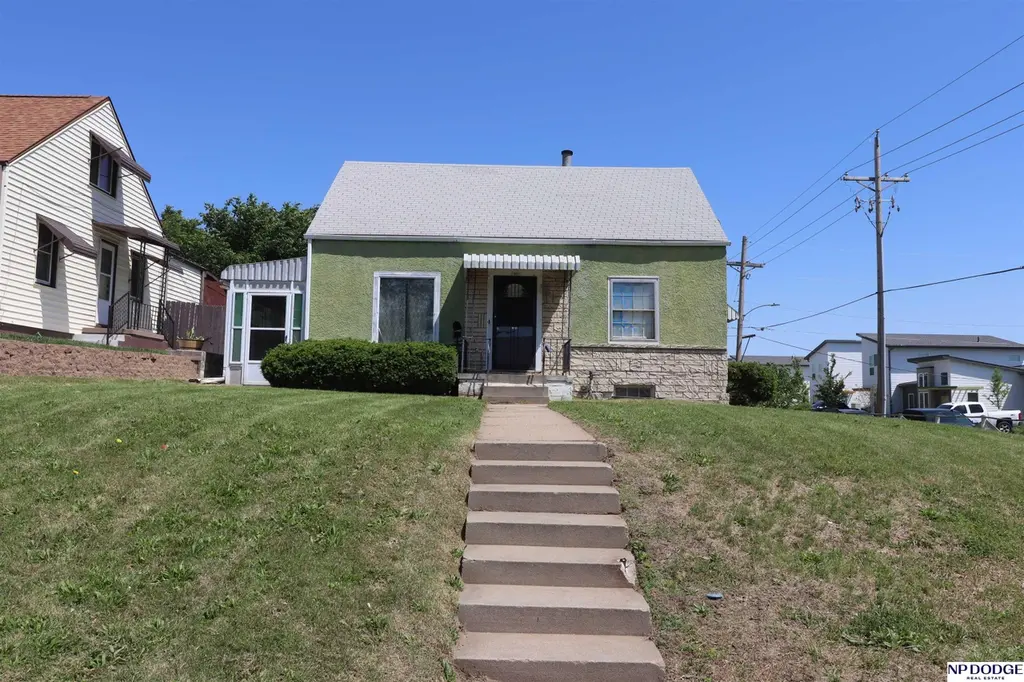
2902 Parker St · Omaha, NE
Flood risk 1/10 · Minimal
- FEMA flood zone
- X (unshaded)
- Chance of flooding over 30 yrs
- 0.0%
- Est. flood insurance / yr
- $473 – $860
Fire risk 1/10 · Minimal
- Est. fire insurance / yr
- $1,161 – $2,155
Heat risk 3/10 · Minor
- Hot days now (above 105°F)
- 7 days/yr
- Hot days in 30 yrs
- 15 days/yr
Wind risk 2/10 · Minimal
- Chance of severe wind over 30 yrs
- —
Air-quality risk 2/10 · Minimal
- Unhealthy air days now
- 0 days/yr
- Unhealthy air days in 30 yrs
- 1 days/yr
Risk factors via First Street. Map © Google.
Why this score? — see what drove the B grade
The composite is a weighted blend of 9 inputs, each scored 0–100. Each bar is that input's sub-score; the figure is the points it added to the 100-point composite (weight × sub-score).
- Cash flow +26.4/30.0
- Appreciation +10.0/10.0
- DSCR +9.0/10.0
- 1% rule +8.1/10.0
- ARV discount +7.5/15.0
- Livability +4.2/5.0
- Rent growth +3.3/5.0
- Condition / age +2.5/5.0
- Schools +2.1/10.0
$99,711
🖨 Deal sheet (PDF) 📄 Offer letter ✓ Due diligence
Listing remarks
Great opportunity to own a home situated on a spacious corner lot with a huge rear parking pad and plenty of room to build a detached 2-car garage. This 2-bedroom, 2-bath home is ready for your personal touch, offering endless potential to remodel and customize the interior to your style. The lower level also provides additional space to expand the finished square footage. Located in a neighborhood experiencing exciting revitalization, with new homes and multifamily properties bringing fresh energy and growth to the area. Check it out!
Key facts
- Rear parking pad
- Corner lot
- Detached garage
Tags
Property features AI
Exterior
- Parking: No garage; Extra parking slab / open parking available
- Utilities: Public water; Public sewer
- Home design: Single-family residence; One-and-one-half story home; Not new (built in 1947)
- Construction: Wood siding and brick exterior; Composition roof; Block foundation; Built in 1947
- Exterior features: Enclosed porch; Partially wood fencing; Level, corner lot; subdivided; paved; Paved road access
Interior
- Bedrooms: Master bedroom located on the main floor; Additional bedroom(s) located on the main floor
- Bathrooms: Two bathrooms total — one full and one half; one main-level bathroom
- Heating & cooling: Natural gas forced air heating
- Interior features: Partial finished basement (360 sq ft finished below grade); No fireplaces
Neighborhood map
What this means for you Summary
Snapshot
- This is a 2-bed/1.5-bath other listed at $100k.
Deal economics
- At list price, monthly cash flow is $262 ($3k/yr) — positive.
- The deal already cash-flows at list — no discount required.
- Meets the 1% rule at list price ($1k rent vs $100k).
- Cap rate 9.4% vs local median 3.6% in Omaha — top-decile yield for the area; either an underpriced asset or a hidden risk that comps aren't pricing in. Stress-test before assuming the spread holds.
Location & tenants
- Location reads 84/100 on livability (#7 in NE, #663 nationally) — a professional / high-income tenant draw. Strengths: amenities A+, commute A+, cost of living A+; Watch: crime F.
- Omaha Public Schools (urban): math 20% / reading 28% proficiency, ranked #110 of 111 in NE (top 99%) — low school quality limits family demand, transient renter base, plan for 1-2y turnover; 62% free/reduced lunch — lower-income household profile, screen leases tightly.
- Zoned schools: Kennedy Elementary School (math 17% / reading 17%, grade F, #471 of 502 statewide, top 95%, 234 students, 0% FRL); Lewis & Clark Middle School (math 23% / reading 35%, grade F, #115 of 128 statewide, top 90%, 860 students, 0% FRL); Benson High School (math 9% / reading 12%, grade F, #257 of 261 statewide, top 98%, 1,570 students, 0% FRL) — zoned schools average 0% FRL vs 62% district-wide (62 pts lower); this property's tenant base skews higher-income than the district average.
- Market conditions: Rents rising (+3.2%/yr); 140 active listings in the ZIP; 40 comparable units currently listed for rent nearby; rentals at typical pace (median 21d on market — plan ~3-4 weeks tenant-placement turnaround); lower-income renter base — watch delinquency; 4,539 units permitted in Douglas County in 2024 (2,583 in 5+ unit buildings).
- This rent runs 37% of the median local income ($42k/yr) — at the standard rent-burdened threshold; future hikes will face affordability resistance.
Forward outlook
- In year one you build about $11k of equity ($689 loan paydown + $10k appreciation (10.0% local appreciation)).
- Douglas County population projected at +28% by 2050 — long-run rental-demand tailwind backs the buy-and-hold thesis.
- At projected returns (10.0% appreciation + 3.2% rent growth), your $28k cash investment doubles in ~2 years — after that, you're playing with house money.
- By year 4, paydown + projected appreciation supports a ~$38k cash-out refi (75% LTV) — recoverable capital for the next deal without selling this one.
Negotiation context
- Only 6 days on market — expect competitive offers; lowballing is unlikely to land.
Risks & watch-outs
- Watch-outs: built in 1947 — expect roof / HVAC / electrical / plumbing capex.
Questions for the listing agent
- Built in 1947 — when were the roof, HVAC, electrical panel, plumbing, and water heater last replaced?
- Is there a deadline driving the sale (1031 exchange, divorce, estate, relocation)? That informs how much negotiation room exists.
- Crime grade is F in this area — have there been break-ins, vandalism, or insurance claims at this property in the last 3 years? What carrier currently insures it and at what premium?
- What's the average days-on-market for RENTAL listings here right now (not sales)? A rising rental-DOM trend means longer vacancies and softer asking-rent achievability than the comps imply.
- What's the recent tenant-quality profile in this submarket — average credit score on applications, eviction rate, late-payment / NSF rate, and stable-employment percentage? A property-management company in the area should have these aggregated.
- How much new for-sale + rental construction is in the pipeline within 1–3 miles? Heavy new supply typically softens prices + rents 12–24 months out; constrained supply supports both.
Investment metrics
- 1% rule
- 1.31% ✓
- Cap rate
- 9.45%
- Cash-on-cash
- 11.26%
- DSCR
- 1.50
- GRM
- 6.4
CMA / ARV
No comps found within radius.
Projected returns pro-forma
10.0% appreciation · 3.22% rent growth · sell at horizon
- IRR
- 32.7%
- Equity multiple
- 3.56×
- Total profit
- $71,350
- Equity at exit
- $89,828
- IRR
- 28.3%
- Equity multiple
- 8.08×
- Total profit
- $197,724
- Equity at exit
- $193,717
Cash invested: $27,919 (down + closing). Projections, not guarantees.
Landlord ↔ Tenant lean methodology
- Overall (STATE)
- 83 Strongly Landlord-Friendly
- State Nebraska
- 83 Strongly Landlord-Friendly · R+13
- County
- — inherits STATE
- City
- — inherits STATE
ZIP-level market 68111
- Home prices YoY
- 4.0%
- Rents YoY
- 3.2%
- Active inventory
- 140
- Price-to-rent
- 6.4×
Monthly cashflow live
- Estimated rent
- $1,306 high interval (Pro) →
- Mortgage (P&I)
- −$523
- Tax from tax record
- −$205 /mo · $2,463/yr
- Insurance
- −$42
- HOA
- −$0
- Vacancy / Maint / Mgmt
- −$274
- Net cashflow
- $262
Break-even live
Sensitivity live
| Price | -10% $318 | -5% $290 | +0% $262 | +5% $234 | +10% $206 |
|---|---|---|---|---|---|
| Rent | -10% $159 | -5% $210 | +0% $262 | +5% $314 | +10% $365 |
| Rate | -1.0pp $312 | -0.5pp $287 | base $262 | +0.5pp $236 | +1.0pp $210 |
UW: 25.0% down · 7.5% · 30yr · 1.5% tax · 5.0% vac · 8.0% maint · 8.0% mgmt
Financing live
Cash to close
- Down payment
- $24,928
- Closing costs
- $2,991
- Reserves months
- —
- Total cash needed
- —
Loan-product check · same deal, 3 products live
Conventional
25% down · 7.5% · 30yr
- Down + closing
- —
- Monthly P&I
- —
- Monthly cashflow
- —
- DSCR
- —
- Eligible?
- —
Personal DTI + credit; lowest rate.
DSCR
20% down · 8.5% · 30yr
- Down + closing
- —
- Monthly P&I
- —
- Monthly cashflow
- —
- DSCR
- —
- Eligible?
- —
No personal income docs; deal must DSCR.
Hard money
10% down · 12.0% · 12mo
- Down + closing
- —
- Monthly P&I
- —
- Monthly cashflow
- —
- DSCR
- —
- Eligible?
- —
Short-term bridge; refi at stabilization.
Rent comps 40 comps
| Address | Beds | Baths | Sqft | Rent | $/sqft | DOM | Units | Dist |
|---|---|---|---|---|---|---|---|---|
| 1407 N 31st St Omaha, NE | 2.0 | 1.0 | 1040 | $1,395 | $1.34 | 4d | 1 | 0.36mi |
| 3430 Seward St Omaha, NE | 3.0 | 1.0 | 1371 | $1,695 | $1.24 | 16d | 1 | 0.52mi |
| 1111 N 27th St Omaha, NE | 1.0–2.0 | 1.0 | 941 | $1,200 | $1.28 | 45d | 11 | 0.54mi |
| 2625 Nicholas Ct Unit 2625NA Omaha, NE | 2.0 | 1.0 | 1042 | $1,250 | $1.20 | 25d | 1 | 0.57mi |
| 2619 Nicholas Ct Unit 2619ND Omaha, NE | 2.0 | 1.0 | 1042 | $1,250 | $1.20 | 20d | 1 | 0.58mi |
| 2613 Nicholas Ct Unit 2613NC Omaha, NE | 2.0 | 1.0 | 1042 | $1,250 | $1.20 | 4d | 1 | 0.58mi |
| 2569 Nicholas Ct Unit 2569NC Omaha, NE | 2.0 | 1.0 | 1042 | $1,100 | $1.06 | 20d | 1 | 0.59mi |
| 2563 Nicholas Ct Unit 2563NF Omaha, NE | 2.0 | 1.0 | 1042 | $1,100 | $1.06 | 45d | 1 | 0.60mi |
| 2563 Nicholas Ct Unit 2563NC Omaha, NE | 2.0 | 1.0 | 1042 | $1,100 | $1.06 | 25d | 1 | 0.60mi |
| 2563 Nicholas Ct Unit 2563NE Omaha, NE | 2.0 | 1.0 | 1042 | $1,100 | $1.06 | 4d | 1 | 0.60mi |
| 2575 Irving Ct Unit 2575IRB Omaha, NE | 2.0 | 1.0 | 1042 | $1,250 | $1.20 | 20d | 1 | 0.61mi |
| 2575 Irving Ct Unit 2575IRF Omaha, NE | 2.0 | 1.0 | 1042 | $1,100 | $1.06 | 20d | 1 | 0.61mi |
| 2563 Irving Ct Unit 2563IRF Omaha, NE | 2.0 | 1.0 | 1042 | $1,100 | $1.06 | 45d | 1 | 0.62mi |
| 3502 Lake St Omaha, NE | 2.0 | 1.0 | 974 | $995 | $1.02 | 4d | 1 | 0.63mi |
| 2623 Izard Ct Unit 2623IZE Omaha, NE | 2.0 | 1.0 | 1042 | $1,100 | $1.06 | 45d | 1 | 0.63mi |
| 2579 Izard Ct Unit 2579IZD Omaha, NE | 2.0 | 1.0 | 1042 | $1,100 | $1.06 | 45d | 1 | 0.64mi |
| 2605 Izard Ct Unit 2605IZA Omaha, NE | 2.0 | 1.0 | 1042 | $1,250 | $1.20 | 45d | 1 | 0.64mi |
| 2567 Izard Ct Unit 2567IZE Omaha, NE | 2.0 | 1.0 | 1042 | $1,100 | $1.06 | 45d | 1 | 0.65mi |
| 2561 Izard Ct Unit 2561IZC Omaha, NE | 2.0 | 1.0 | 1042 | $1,100 | $1.06 | 25d | 1 | 0.65mi |
| 2561 Izard Ct Unit 2561IZD Omaha, NE | 2.0 | 1.0 | 1042 | $1,250 | $1.20 | 25d | 1 | 0.65mi |
| 2555 Izard Ct Unit 2555IZB Omaha, NE | 2.0 | 1.0 | 1042 | $1,100 | $1.06 | 4d | 1 | 0.65mi |
| 1816 Florence Blvd Apt 102 Omaha, NE | 2.0 | 1.0 | 900 | $900 | $1.00 | 16d | 1 | 0.72mi |
| 1120 N 20th St Unit 102 Omaha, NE | 3.0 | 2.0 | 1094 | $580 | $0.53 | 16d | 1 | 0.75mi |
| 1120 N 20th St Unit 103 Omaha, NE | 3.0 | 2.0 | 1170 | $1,150 | $0.98 | 16d | 1 | 0.75mi |
| 2929 California St Omaha, NE | 1.0–4.0 | 1.0–3.0 | 1280 | $1,890 | $1.48 | 4d | 118 | 0.82mi |
| 1004 Glenwood Ave Unit 2 Omaha, NE | 3.0 | 1.5 | 1000 | $1,500 | $1.50 | 4d | 1 | 0.85mi |
| 1624 Cuming St Unit 903 Omaha, NE | 1.0 | 1.0 | 1062 | $1,300 | $1.22 | 45d | 1 | 1.07mi |
| 1624 Cuming St Unit 1628 Omaha, NE | 1.0 | 1.0 | 920 | $1,350 | $1.47 | 45d | 1 | 1.07mi |
| 1624 Cuming St Unit 1626 Omaha, NE | 1.0 | 1.0 | 1048 | $1,600 | $1.53 | 45d | 1 | 1.07mi |
| 1015 N 16th St Omaha, NE | 1.0–2.0 | 1.0–2.0 | 1127 | $1,685 | $1.49 | 3d | 11 | 1.07mi |
| 3212 N 39th St Omaha, NE | 1.0 | 1.0 | 1025 | $785 | $0.77 | 25d | 1 | 1.11mi |
| 1524 Cuming St Omaha, NE | 1.0–2.0 | 1.0–2.0 | 1117 | $2,195 | $1.96 | 3d | 14 | 1.14mi |
| 124 N 31st Ave Apt 7 Omaha, NE | 2.0 | 1.0 | 950 | $1,195 | $1.26 | 4d | 1 | 1.15mi |
| 124 N 31st Ave Omaha, NE | 2.0 | 1.0 | 950 | $1,245 | $1.31 | 45d | 1 | 1.15mi |
| 119 Lincoln Blvd Omaha, NE | 1.0 | 1.0 | 1000 | $950 | $0.95 | 25d | 1 | 1.18mi |
| 115 N 33rd St Apt 8 Omaha, NE | 1.0 | 1.0 | 900 | $975 | $1.08 | 4d | 1 | 1.20mi |
| 1015 N 14th St Omaha, NE | 1.0–3.0 | 1.0–3.0 | 910 | $1,542 | $1.70 | 3d | 17 | 1.21mi |
| 3323 N 40th St Omaha, NE | 2.0 | 1.0 | 1000 | $1,575 | $1.57 | 4d | 1 | 1.22mi |
| 3201 Dodge Ct #5407 Omaha, NE | 2.0 | 2.0 | 1142 | $1,850 | $1.62 | 25d | 1 | 1.24mi |
| 828 N 41st Ave Omaha, NE | 2.0 | 1.0 | 1264 | $1,700 | $1.34 | 16d | 1 | 1.25mi |
Listing history 4 events
-
2026-06-03statusdays on market $99,711 Pending 6 DOM
-
2026-06-01statusdays on market $99,711 Active 5 DOM
-
2026-06-01days on market $99,711 New 4 DOM
-
2026-05-27$99,711 New
ⓘ Source: listings_history table (triggers on properties + properties_extension) + one-shot
backfill from property_details.listing_events for pre-trigger history.
Tax reassessment forecast NE · Resets to sale price
- Current annual tax
- $2,463 · $205/mo
- Projected year-2 tax
- $2,463 · $205/mo
- Expected delta
- $0/yr ($0/mo · 0.0%)
ⓘ Screening estimate from a state-policy table — verify with the county assessor before closing.
Climate risk First Street
- Flood 1/10 Low FEMA zone X (unshaded) · 0% chance over 30 yrs
- Wildfire 1/10 Low
- Heat 3/10 Moderate 7 d/yr ≥105°F today · 15 d/yr by 30 yrs out
- Wind 2/10 Low
- Air quality 2/10 Low 0 unhealthy d/yr today · 1 by 30 yrs out
Nearby sold comps map
Loading sold comps map…
Walkable amenities ~0.75 mi
Loading nearby amenities…
Taxation est. · year 1
- Rental income
- $15,671
- − Mortgage interest
- −$5,585
- − Property taxes
- −$2,463
- − Insurance
- −$499
- − Repairs & maintenance
- −$1,254
- − Management
- −$1,254
- − Depreciation
- −$2,901
- Taxable income
- $1,716
- Est. tax owed @ 24.0%
- −$412
- After-tax cash flow
- $2,732/yr
For passive investors: Depreciation is non-cash, so a rental often shows a tax loss while cash-flowing — sheltering income. Rental losses are passive: they offset passive income freely, and up to $25,000/yr can offset ordinary (W-2) income if you actively participate and your MAGI is under $100k (phasing out to $0 by $150k); unused losses carry forward. On sale, claimed depreciation is recaptured at up to 25%, and gains may owe capital-gains tax (a 1031 exchange can defer both). Figures are a year-1 estimate at your 24.0% rate — not tax advice; consult a CPA.
Schools (NCES district)
- District
- Omaha Public Schools
- NCES district ID
- 3174820
- Math proficiency
- 20% ▼ -10.00%
- Reading proficiency
- 28% ▼ -5.00%
- Median HH income
- $46,039
- Composite
- 20.83/100
- National rank
- #8502
- State rank
- #110 of 111 in NE
Livability — Omaha
- Score
- 84/100
- State rank
- #7
- US rank
- #663
Category grades
Schools grade is shown separately in the Schools card above.
Census & demographics
- Census place
- Omaha, NE
- County
- Douglas County · 538,646 people
- City population
- 552,986
- Metro
- Omaha-Council Bluffs, NE-IA
- Population (ZIP)
- 24,210
- Household income
- $42,185
- Rent vs Own
- Severe rent burden
- 1913.0
Population outlook (Douglas County) Hauer SSP2
- Today (2025)
- 625,245 people
- By 2030
- 661,613 · +5.8%
- By 2040
- 732,395 · +17.1%
- By 2050
- 801,988 · +28.3%
- By 2075
- 968,637 · +54.9%
- By 2100
- 1,101,871 · +76.2%
Race, ethnicity, and origin ACS 2023
- Neighborhood character
- Diverse neighborhood (Simpson 0.65)
- Race & ethnicity
- Black 52% Hispanic / Latino 21% White 17% Two or more races 15% Asian 3% Native American 1%
- Hispanic origin (detail)
- Mexican 14%
- Common ancestry
- Ukrainian 3% Lithuanian 0%
- Foreign-born
- 14% · Canada, Philippines
- Languages at home
- 75% English-only · Spanish 16% Other Asian/Pacific 3% French/Haitian/Cajun 1%
Political lean MEDSL · Douglas
- 2024 margin
- D (+10.2) · D 54.4% · R 44.2% · Other 1.4%
- 2008→2024 swing
- +5.5pp toward D · 2008: 4.6pp · 2024: 10.2pp
- All cycles
- 2024: D+10.2 2020: D+11.3 2016: D+1.4 2012: R+4.3 2008: D+4.6
Not yet ingested
- Civics
- —
Market trends
- HPI YoY
- ▲ 13.82%
- Current HPI
- 358.7174
- Rent YoY
- ▲ 3.22%
- Metro
- Omaha-Council Bluffs, NE-IA
- State GDP YoY
- ▲ 0.68%
- F500 in state
- 2
Industry mix (Fortune 500 HQ in NE)
| Industry | F500 HQs | Revenue |
|---|---|---|
| Conglomerate | 1 | $371B |
|
||
Price history
1 event — show timeline
- 2026-05-27 Listed $99,711 GPRMLS
Property tax history
+8.1%/yrLatest (2025): $2,463 · +1.9% YoY. Source: county tax records.
Cash-flow waterfall
monthlySold comps — $/sqft
last 12 mo · ≤1 miLoading sold comps…