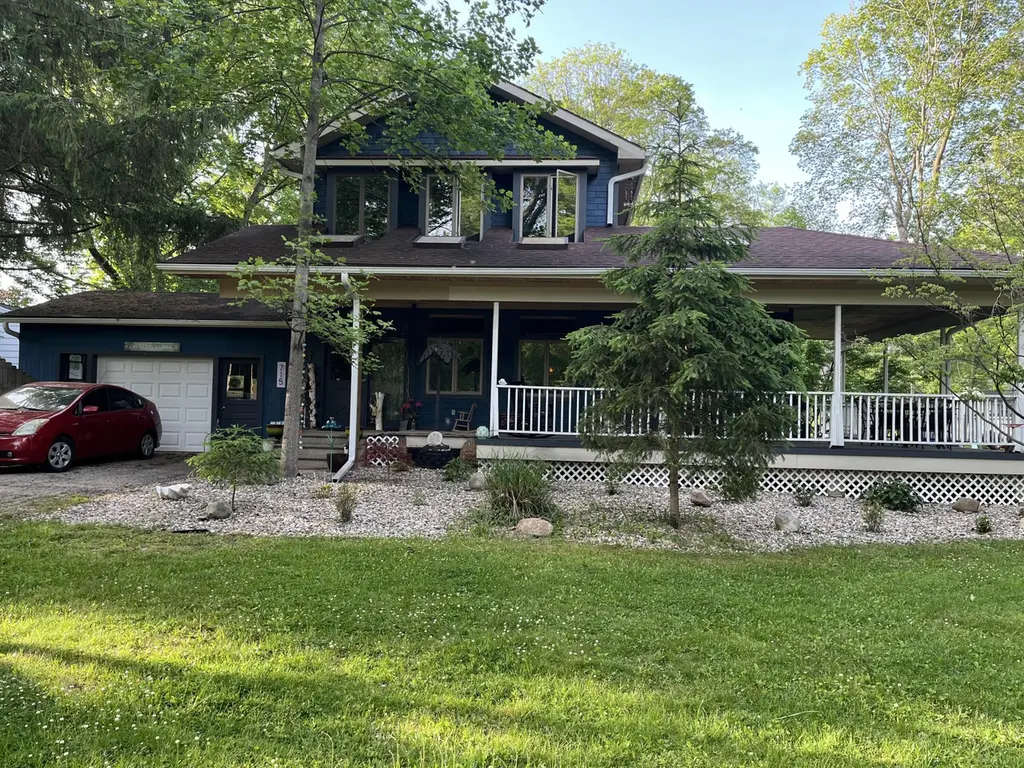
715 Brown St · Niles, MI
Flood risk 1/10 · Minimal
- FEMA flood zone
- X (unshaded)
- Chance of flooding over 30 yrs
- 0.0%
- Est. flood insurance / yr
- $473 – $860
Fire risk 3/10 · Minor
- Est. fire insurance / yr
- $784 – $1,456
Heat risk 2/10 · Minimal
- Hot days now (above 99°F)
- 7 days/yr
- Hot days in 30 yrs
- 16 days/yr
Wind risk 2/10 · Minimal
- Chance of severe wind over 30 yrs
- —
Air-quality risk 2/10 · Minimal
- Unhealthy air days now
- 2 days/yr
- Unhealthy air days in 30 yrs
- 2 days/yr
Risk factors via First Street. Map © Google.
Why this score? — see what drove the C- grade
The composite is a weighted blend of 9 inputs, each scored 0–100. Each bar is that input's sub-score; the figure is the points it added to the 100-point composite (weight × sub-score).
- Cash flow +15.5/30.0
- ARV discount +15.0/15.0
- 1% rule +4.9/10.0
- DSCR +4.8/10.0
- Livability +3.6/5.0
- Schools +3.2/10.0
- Rent growth +2.5/5.0
- Condition / age +2.5/5.0
- Appreciation +0.0/10.0
$159,900
🖨 Deal sheet (PDF) 📄 Offer letter ✓ Due diligence
Listing remarks MLS
Fantastic historic farm house in a low traffic, 25 mph neighborhood on the West side of Niles in need of finishing inside. Wrap around front porch as well as private porch off of primary bedroom. Lennox gas furnace replaced in 2025. Gutters added to house in 2025. Roof on house was installed in 2019. Oak floors on main floor, pine flooring upstairs. 3 video security camera's, 2 lion statues at end of driveway, and exterior palm tree light do not stay with house.
Key facts
- Roof installed
- Lennox gas furnace
- Historic farm house
Tags
Property features AI
Exterior
- Parking: Attached garage (1 car)
- Utilities: Public water; Natural gas available and connected; Electricity available
- Home design: Single family residence; Residential property type; Built in 1860
- Construction: Wood siding construction; Composition shingle roof
- Exterior features: Corner lot; Paved road access
Interior
- Kitchen: Kitchen (13 x 13); Microwave; Refrigerator
- Bedrooms: Primary bedroom (15 x 14); Bedroom 2 (14 x 14); Bedroom 4 (10 x 11); Additional bedroom (dimensions 10 x 13)
- Bathrooms: 2 full bathrooms; Primary bathroom
- Heating & cooling: Forced air heating
- Interior features: Wood-burning fireplace; Full basement; Nine total rooms
- Laundry & utility: Washer; Dryer; Electric water heater
Neighborhood map
What this means for you Summary
Snapshot
- This is a 4-bed/1.0-bath single-family listed at $160k.
Deal economics
- At list price, monthly cash flow is $64 ($764/yr) — positive.
- The deal already cash-flows at list — no discount required.
- To meet the 1% rule (rent ≥ 1% of price), the offer needs to be $159k (0.8% below list).
- Recommended offer: $158k (1.5% below list) — sets the bar for market timing.
- Cap rate 6.8% vs local median 4.4% in Niles — top-decile yield for the area; either an underpriced asset or a hidden risk that comps aren't pricing in. Stress-test before assuming the spread holds.
Location & tenants
- Location reads 72/100 on livability (#260 in MI) — a middle-class / working-renter tenant base. Strengths: cost of living A+, housing A+, health & safety A+; Watch: commute D+, crime D-, amenities F.
- Niles Community Schools (urban): math 33% / reading 43% proficiency, ranked #248 of 540 in MI (top 46%) — families likely to look elsewhere, expect single-tenant / working-renter base with shorter leases.
- Zoned schools: Ballard Elementary School (math 33% / reading 31%, grade F, #814 of 1,397 statewide, top 61%, 538 students, 75% FRL); Ring Lardner Middle School (math 29% / reading 43%, grade F, #269 of 493 statewide, top 56%, 554 students, 66% FRL); Niles Senior High School (math 22% / reading 52%, grade F, #334 of 713 statewide, top 51%, 834 students, 50% FRL).
- Market conditions: 210 active listings in the ZIP; 397 units permitted in Berrien County in 2024 (40 in 5+ unit buildings).
Forward outlook
- Local home prices are declining (-3.0%/yr); year-one equity from $1k of loan paydown is wiped out by about $5k of value loss. Plan a longer hold.
- Berrien County population projected at -16% by 2050 — secular population decline; favor cash flow + early exit over multi-decade hold.
Negotiation context
- It's been on market 30 days — a 2% lower offer ($158k) is reasonable based on typical stale-listing flexibility.
- 17 sale attempts since 29y ago with the ask held roughly flat each time — persistent listings suggest the price (not the market) is what's stuck; bring a comps-based counter.
- Current owner paid $110k; 45% above their basis — modest negotiation headroom, anchor on the comps not their cost.
Risks & watch-outs
- Watch-outs: built in 1860 — expect roof / HVAC / electrical / plumbing capex.
Questions for the listing agent
- Built in 1860 — when were the roof, HVAC, electrical panel, plumbing, and water heater last replaced?
- Is there a deadline driving the sale (1031 exchange, divorce, estate, relocation)? That informs how much negotiation room exists.
- Schools are D-rated, which usually means shorter tenancies and higher turnover. Who's the typical renter profile here, and what's been the actual vacancy rate?
- Crime grade is D in this area — have there been break-ins, vandalism, or insurance claims at this property in the last 3 years? What carrier currently insures it and at what premium?
- What's the average days-on-market for RENTAL listings here right now (not sales)? A rising rental-DOM trend means longer vacancies and softer asking-rent achievability than the comps imply.
- What's the recent tenant-quality profile in this submarket — average credit score on applications, eviction rate, late-payment / NSF rate, and stable-employment percentage? A property-management company in the area should have these aggregated.
- How much new for-sale + rental construction is in the pipeline within 1–3 miles? Heavy new supply typically softens prices + rents 12–24 months out; constrained supply supports both.
Investment metrics
- 1% rule
- 0.99% ✗
- Cap rate
- 6.77%
- Cash-on-cash
- 1.71%
- DSCR
- 1.08
- GRM
- 8.4
CMA / ARV
- ARV (on-the-fly)
- $236,740
- Comps found
- 12
Show comp detail 12 sales within ~0.75 mi
| Address | Dist | Beds/Ba | Sqft | Sold | Price | $/sf | Match |
|---|---|---|---|---|---|---|---|
| 1005 Winchester Ct | 0.10mi | 3/2.0 (-1) | 1,696 (-5%) | 3mo | $289,900 | $171 | 76 |
| 822 Kensington Dr | 0.14mi | 4/3.0 | 1,750 (-2%) | 19mo | $232,500 | $133 | 67 |
| 743 Platt St | 0.15mi | 3/2.0 (-1) | 1,535 (-14%) | 0mo | $225,000 | $147 | 61 |
| 1242 Nature Way | 0.49mi | 3/2.0 (-1) | 1,860 (+4%) | 17mo | $440,000 | $237 | 46 |
| 721 N 4th St | 0.69mi | 4/2.0 | 1,974 (+11%) | 2mo | $225,000 | $114 | 44 |
| 1407 Lykins Ln | 0.53mi | 3/1.5 (-1) | 1,676 (-6%) | 20mo | $205,000 | $122 | 42 |
| 537 Grant St | 0.63mi | 3/2.0 (-1) | 1,984 (+12%) | 6mo | $234,000 | $118 | 38 |
| 407 Carey Mission Rd | 0.70mi | 3/2.0 (-1) | 1,861 (+5%) | 17mo | $267,000 | $143 | 36 |
| 521 N 3rd St | 0.64mi | 5/2.0 (+1) | 1,600 (-10%) | 11mo | $51,400 | $32 | 35 |
| 921 N 3rd St | 0.62mi | 4/2.0 | 1,588 (-11%) | 17mo | $109,900 | $69 | 35 |
| 109 N Lincoln Ave | 0.56mi | 3/2.0 (-1) | 1,521 (-15%) | 10mo | $170,000 | $112 | 32 |
| 29 N Lincoln Ave | 0.61mi | 3/2.0 (-1) | 1,539 (-14%) | 14mo | $215,000 | $140 | 28 |
Match score weights: distance 35% · size 25% · config 20% · recency 20%. Top-matched comps best support the ARV.
Projected returns pro-forma
-3.0% appreciation · 3.0% rent growth · sell at horizon
- IRR
- -13.5%
- Equity multiple
- 0.51×
- Total profit
- $-21,778
- Equity at exit
- $23,842
- IRR
- -4.6%
- Equity multiple
- 0.70×
- Total profit
- $-13,432
- Equity at exit
- $13,825
Cash invested: $44,772 (down + closing). Projections, not guarantees.
Landlord ↔ Tenant lean methodology
- Overall (STATE)
- 62 Landlord-Friendly
- State Michigan
- 62 Landlord-Friendly · EVEN
- County
- — inherits STATE
- City
- — inherits STATE
ZIP-level market 49120
- Active inventory
- 210
- Price-to-rent
- 8.4×
Monthly cashflow live
- Estimated rent
- $1,587 medium interval (Pro) →
- Mortgage (P&I)
- −$839
- Tax from tax record
- −$285 /mo · $3,416/yr
- Insurance
- −$67
- HOA
- −$0
- Vacancy / Maint / Mgmt
- −$333
- Net cashflow
- $64
Break-even live
Sensitivity live
| Price | -10% $154 | -5% $109 | +0% $64 | +5% $18 | +10% $-27 |
|---|---|---|---|---|---|
| Rent | -10% $-62 | -5% $1 | +0% $64 | +5% $126 | +10% $189 |
| Rate | -1.0pp $144 | -0.5pp $104 | base $64 | +0.5pp $22 | +1.0pp $-20 |
UW: 25.0% down · 7.5% · 30yr · 1.5% tax · 5.0% vac · 8.0% maint · 8.0% mgmt
Financing live
Cash to close
- Down payment
- $39,975
- Closing costs
- $4,797
- Reserves months
- —
- Total cash needed
- —
Loan-product check · same deal, 3 products live
Conventional
25% down · 7.5% · 30yr
- Down + closing
- —
- Monthly P&I
- —
- Monthly cashflow
- —
- DSCR
- —
- Eligible?
- —
Personal DTI + credit; lowest rate.
DSCR
20% down · 8.5% · 30yr
- Down + closing
- —
- Monthly P&I
- —
- Monthly cashflow
- —
- DSCR
- —
- Eligible?
- —
No personal income docs; deal must DSCR.
Hard money
10% down · 12.0% · 12mo
- Down + closing
- —
- Monthly P&I
- —
- Monthly cashflow
- —
- DSCR
- —
- Eligible?
- —
Short-term bridge; refi at stabilization.
Listing history 50 events
-
2026-06-21days on market $159,900 Active 30 DOM
-
2026-06-19days on market $159,900 Active 28 DOM
-
2026-06-18days on market $159,900 Active 27 DOM
-
2026-06-17days on market $159,900 Active 26 DOM
-
2026-06-16days on market $159,900 Active 25 DOM
-
2026-06-15days on market $159,900 Active 24 DOM
-
2026-06-14days on market $159,900 Active 22 DOM
-
2026-06-13days on market $159,900 Active 21 DOM
-
2026-06-10days on market $159,900 Active 19 DOM
-
2026-06-09days on market $159,900 Active 18 DOM
-
2026-06-08days on market $159,900 Active 17 DOM
-
2026-06-07days on market $159,900 Active 16 DOM
-
2026-06-05days on market $159,900 Active 13 DOM
-
2026-06-03days on market $159,900 Active 12 DOM
-
2026-06-02days on market $159,900 Active 11 DOM
-
2026-06-01days on market $159,900 Active 10 DOM
-
2026-05-31days on market $159,900 Active 9 DOM
-
2026-05-30days on market $159,900 Active 8 DOM
-
2026-05-22$159,900 Active 467-char remark
Show marketing remark (466 chars)
Fantastic historic farm house in a low traffic, 25 mph neighborhood on the West side of Niles in need of finishing inside. Wrap around front porch as well as private porch off of primary bedroom. Lennox gas furnace replaced in 2025. Gutters added to house in 2025. Roof on house was installed in 2019. Oak floors on main floor, pine flooring upstairs. 3 video security camera's, 2 lion statues at end of driveway, and exterior palm tree light do not stay with house.
-
2026-05-22$159,900 Active 466-char remark
Show marketing remark (466 chars)
Fantastic historic farm house in a low traffic, 25 mph neighborhood on the West side of Niles in need of finishing inside. Wrap around front porch as well as private porch off of primary bedroom. Lennox gas furnace replaced in 2025. Gutters added to house in 2025. Roof on house was installed in 2019. Oak floors on main floor, pine flooring upstairs. 3 video security camera's, 2 lion statues at end of driveway, and exterior palm tree light do not stay with house.
-
2026-05-22$159,900 Active
Show marketing remark (466 chars)
Fantastic historic farm house in a low traffic, 25 mph neighborhood on the West side of Niles in need of finishing inside. Wrap around front porch as well as private porch off of primary bedroom. Lennox gas furnace replaced in 2025. Gutters added to house in 2025. Roof on house was installed in 2019. Oak floors on main floor, pine flooring upstairs. 3 video security camera's, 2 lion statues at end of driveway, and exterior palm tree light do not stay with house.
-
2024-03-11soldstatus $110,000
-
2024-03-08soldstatus $110,000 Sold
-
2024-03-08soldstatus $110,000 Sold
-
2024-03-08soldstatus $110,000 Closed
-
2024-03-05status Pending
-
2024-03-05status Pending
-
2024-03-05status Pending
-
2024-02-13price $124,900
-
2024-02-12price $124,900
-
2024-02-12price $124,900
-
2024-01-13price $129,900
-
2024-01-12price $129,900
-
2024-01-12status Active
-
2024-01-12status Active
-
2024-01-12status Active
-
2024-01-12price $129,900
-
2024-01-10historical
-
2024-01-10historical
-
2024-01-10historical
-
2024-01-09$149,900 Active
-
2024-01-09$149,900 Active
-
2024-01-09$149,900 Active
-
2022-09-29historical
-
2022-09-29historical
-
2022-09-02historical Accepting Backup Offers
-
2022-07-01price $150,000
-
2022-07-01price $150,000
-
2022-05-26status Active
-
2022-05-15historical Contingent - Continue To Show
ⓘ Source: listings_history table (triggers on properties + properties_extension) + one-shot
backfill from property_details.listing_events for pre-trigger history.
Tax reassessment forecast MI · Partial reset (capped growth)
- Current annual tax
- $3,416 · $285/mo
- Projected year-2 tax
- $3,416 · $285/mo
- Expected delta
- $0/yr ($0/mo · 0.0%)
ⓘ Screening estimate from a state-policy table — verify with the county assessor before closing.
Climate risk First Street
- Flood 1/10 Low FEMA zone X (unshaded) · 0% chance over 30 yrs
- Wildfire 3/10 Moderate
- Heat 2/10 Low 7 d/yr ≥99°F today · 16 d/yr by 30 yrs out
- Wind 2/10 Low
- Air quality 2/10 Low 2 unhealthy d/yr today · 2 by 30 yrs out
Nearby sold comps map
Loading sold comps map…
Walkable amenities ~0.75 mi
Loading nearby amenities…
Taxation est. · year 1
- Rental income
- $19,041
- − Mortgage interest
- −$8,957
- − Property taxes
- −$3,416
- − Insurance
- −$800
- − Repairs & maintenance
- −$1,523
- − Management
- −$1,523
- − Depreciation
- −$4,652
- Taxable loss
- −$1,830
- Est. tax savings @ 24.0%
- +$439
- After-tax cash flow
- $1,203/yr
For passive investors: Depreciation is non-cash, so a rental often shows a tax loss while cash-flowing — sheltering income. Rental losses are passive: they offset passive income freely, and up to $25,000/yr can offset ordinary (W-2) income if you actively participate and your MAGI is under $100k (phasing out to $0 by $150k); unused losses carry forward. On sale, claimed depreciation is recaptured at up to 25%, and gains may owe capital-gains tax (a 1031 exchange can defer both). Figures are a year-1 estimate at your 24.0% rate — not tax advice; consult a CPA.
Schools (NCES district)
- District
- Niles Community Schools
- NCES district ID
- 2625560
- Math proficiency
- 33% ▼ -9.00%
- Reading proficiency
- 43% ▼ -4.00%
- Median HH income
- $39,281
- Composite
- 31.77/100
- National rank
- #5894
- State rank
- #248 of 540 in MI
Livability — Niles
- Score
- 72/100
- State rank
- #260
- US rank
- #6422
Category grades
Schools grade is shown separately in the Schools card above.
Census & demographics
- Census place
- Niles, MI
- County
- Berrien County · 71,477 people
- City population
- 36,495
- Metro
- Niles, MI
- Population (ZIP)
- 36,495
- Household income
- $65,148
- Rent vs Own
- Severe rent burden
- 782.0
Population outlook (Berrien County) Hauer SSP2
- Today (2025)
- 149,273 people
- By 2030
- 145,211 · -2.7%
- By 2040
- 135,435 · -9.3%
- By 2050
- 125,543 · -15.9%
- By 2075
- 103,986 · -30.3%
- By 2100
- 82,256 · -44.9%
Race, ethnicity, and origin ACS 2023
- Neighborhood character
- Predominantly White (84%)
- Race & ethnicity
- White 84% Black 7% Two or more races 5% Hispanic / Latino 4%
- Common ancestry
- Romanian 5% Iranian 3% Lithuanian 2%
- Foreign-born
- 3% · Canada
- Languages at home
- 96% English-only · Spanish 2%
Political lean MEDSL · Berrien
- 2024 margin
- Lean R (+7.9) · D 45.4% · R 53.2% · Other 1.4%
- 2008→2024 swing
- -13.3pp toward R · 2008: 5.5pp · 2024: -7.9pp
- All cycles
- 2024: R+7.9 2020: R+7.4 2016: R+12.7 2012: R+6.6 2008: D+5.5
Not yet ingested
- Civics
- —
Market trends
- HPI YoY
- ▼ -345.26%
- Current HPI
- 195.8214
- Rent YoY
- —
- Metro
- Niles, MI
- State GDP YoY
- ▲ 1.37%
- F500 in state
- 28
Industry mix (Fortune 500 HQ in MI)
| Industry | F500 HQs | Revenue |
|---|---|---|
| Automotive Parts | 3 | $48B |
|
||
| Automotive | 2 | $372B |
|
||
| Chemicals | 1 | $45B |
|
||
| Automotive Retail | 1 | $29B |
|
||
| Healthcare / Medical Devices | 1 | $23B |
|
||
| Automotive Technology | 1 | $20B |
|
||
Price history
+88.1% since first listed46 events — show timeline
- 2026-05-22 Listed $159,900 SW Michigan MLS
- 2026-05-22 Listed $159,900 MiRealSource-MiMLS
- 2026-05-22 Listed $159,900 REALCOMP
- 2024-03-11 Sold (Public Records) $110,000 Public Records
- 2024-03-08 Sold (MLS) $110,000 MiRealSource-MiMLS
- 2024-03-08 Sold (MLS) $110,000 SW Michigan MLS
- 2024-03-08 Sold (MLS) $110,000 REALCOMP
- 2024-03-05 Pending — MiRealSource-MiMLS
- 2024-03-05 Pending — REALCOMP
- 2024-03-05 Pending — SW Michigan MLS
- 2024-02-13 Price Changed $124,900 MiRealSource-MiMLS
- 2024-02-12 Price Changed $124,900 REALCOMP
- 2024-02-12 Price Changed $124,900 SW Michigan MLS
- 2024-01-13 Price Changed $129,900 MiRealSource-MiMLS
- 2024-01-12 Price Changed $129,900 REALCOMP
- 2024-01-12 Relisted — REALCOMP
- 2024-01-12 Relisted — MiRealSource-MiMLS
- 2024-01-12 Relisted — SW Michigan MLS
- 2024-01-12 Price Changed $129,900 SW Michigan MLS
- 2024-01-10 Listing Removed — SW Michigan MLS
- 2024-01-10 Listing Removed — MiRealSource-MiMLS
- 2024-01-10 Listing Removed — REALCOMP
- 2024-01-09 Listed $149,900 MiRealSource-MiMLS
- 2024-01-09 Listed $149,900 SW Michigan MLS
- 2024-01-09 Listed $149,900 REALCOMP
- 2022-09-29 Listing Removed — MiRealSource-MiMLS
- 2022-09-29 Listing Removed — REALCOMP
- 2022-09-02 Contingent — REALCOMP
- 2022-07-01 Price Changed $150,000 REALCOMP
- 2022-07-01 Price Changed $150,000 SW Michigan MLS
- 2022-05-26 Relisted — REALCOMP
- 2022-05-15 Contingent — REALCOMP
- 2022-05-04 Listed $150,000 MiRealSource-MiMLS
- 2022-05-04 Listed $155,000 REALCOMP
- 2020-03-05 Listing Removed — SW Michigan MLS
- 2020-03-04 Listing Removed — MiRealSource-MiMLS
- 2020-03-04 Listing Removed — REALCOMP
- 2020-01-30 Price Changed $99,900 SW Michigan MLS
- 2019-09-18 Price Changed $129,900 SW Michigan MLS
- 2019-08-15 Listed $99,900 MiRealSource-MiMLS
- 2019-08-15 Listed $139,900 SW Michigan MLS
- 2019-08-15 Listed $99,900 REALCOMP
- 1997-08-05 Sold (MLS) $81,000 REALCOMP
- 1997-08-05 Sold (MLS) $81,000 SW Michigan MLS
- 1997-04-19 Listed $85,000 REALCOMP
- 1997-04-19 Listed $85,000 SW Michigan MLS
Property tax history
+14.1%/yrLatest (2024): $3,416 · +89.3% YoY. Source: county tax records.
Cash-flow waterfall
monthlySold comps — $/sqft
last 12 mo · ≤1 miLoading sold comps…