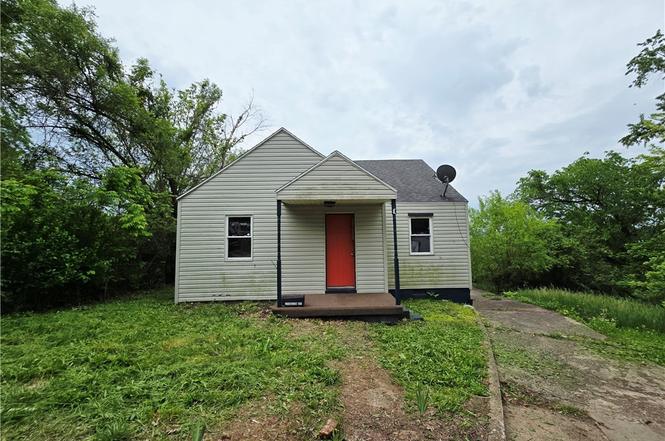
1619 Livingston Ave · Charleston, WV
Flood risk 1/10 · Minimal
- FEMA flood zone
- X (unshaded)
- Chance of flooding over 30 yrs
- 0.0%
- Est. flood insurance / yr
- $507 – $1,088
Fire risk 4/10 · Minor
- Est. fire insurance / yr
- $787 – $1,461
Heat risk 4/10 · Minor
- Hot days now (above 101°F)
- 7 days/yr
- Hot days in 30 yrs
- 19 days/yr
Wind risk 2/10 · Minimal
- Chance of severe wind over 30 yrs
- 1.0%
Air-quality risk 1/10 · Minimal
- Unhealthy air days now
- 0 days/yr
- Unhealthy air days in 30 yrs
- 0 days/yr
Risk factors via First Street. Map © Google.
Why this score? — see what drove the C grade
The composite is a weighted blend of 9 inputs, each scored 0–100. Each bar is that input's sub-score; the figure is the points it added to the 100-point composite (weight × sub-score).
- Cash flow +15.0/30.0
- ARV discount +15.0/15.0
- 1% rule +5.0/10.0
- DSCR +5.0/10.0
- Livability +4.2/5.0
- Appreciation +3.6/10.0
- Schools +2.9/10.0
- Rent growth +2.5/5.0
- Condition / age +2.5/5.0
$25,000
🖨 Deal sheet 📄 Offer letter ✓ Due diligence
Listing remarks
Investor special-fixer with a huge upside potential! This vintage home is a prime investment opportunity. With solid structures and classic features, it's ready for a full renovation or creative development. This property offers a perfect flip or long term rental. Cash or renovation financing preferred. SOLD AS IS. Roof is 6 years old. If bought with the other property for sale at 1620 Red Oak Street Charleston, WV 25387, price will be negotiable. Both properties are connected by an alley. Lots of potential for these 2 properties. Don't miss out on this opportunity. This deal won't last long. Call for your private tour today!
Key facts
- Classic features
- Vintage home
- Solid structures
Tags
Property features AI
Finance
- Other: Lot size approximately 0.158 acres
Exterior
- Parking: Other parking
- Utilities: Public water; Public sewer
- Home design: Single-family residence; 1 story
- Construction: Aluminum siding
- Exterior features: Shingle/composition roof
Interior
- Kitchen: Eat-in kitchen
- Bedrooms: Total of 6 rooms (bedroom count not specified)
- Flooring: Carpet; Hardwood; Laminate; Vinyl
- Bathrooms: 1 full bathroom
- Heating & cooling: Has heating (type not specified); Has cooling (type not specified)
- Interior features: Eat-in kitchen; Insulated windows
Neighborhood map
What this means for you Summary
Snapshot
- This is a 3-bed/1.0-bath single-family listed at $25k.
Deal economics
- At list price, monthly cash flow is $751 ($9k/yr) — positive.
- The deal already cash-flows at list — no discount required.
- Meets the 1% rule at list price ($1k rent vs $25k).
- Recommended offer: $22k (12.0% below list) — sets the bar for market timing.
- Cap rate 42.4% vs local median 3.8% in Charleston — top-decile yield for the area; either an underpriced asset or a hidden risk that comps aren't pricing in. Stress-test before assuming the spread holds.
Location & tenants
- Location reads 85/100 on livability (#3 in WV, #524 nationally) — a professional / high-income tenant draw. Strengths: amenities A+, commute A+, cost of living A+; Watch: crime F.
- Kanawha County Schools (suburban): math 29% / reading 40% proficiency, ranked #17 of 55 in WV (top 31%) — families likely to look elsewhere, expect single-tenant / working-renter base with shorter leases.
- Zoned schools: Mary C. Snow West Side Elementary (math 12% / reading 12%, grade F, #375 of 377 statewide, top 99%, 353 students, 0% FRL); West Side Middle School (math 7% / reading 18%, grade F, #109 of 109 statewide, top 100%, 377 students, 0% FRL); Capital High School (math 22% / reading 52%, grade F, #32 of 110 statewide, top 34%, 1,086 students, 0% FRL) — zoned schools average 0% FRL vs 46% district-wide (46 pts lower); this property's tenant base skews higher-income than the district average.
- Zoned-school proficiency averages 20% at this address vs 34% district-wide (-14 pts) — the specific schools serving this property underperform the Kanawha County Schools average; the district grade overstates school quality for this exact location.
- Market conditions: 24 active listings in the ZIP; 103 units permitted in Kanawha County in 2024 (0 in 5+ unit buildings).
Forward outlook
- Local home prices are declining (-2.8%/yr); year-one equity from $173 of loan paydown is wiped out by about $700 of value loss. Plan a longer hold.
- Kanawha County population projected at -17% by 2050 — secular population decline; favor cash flow + early exit over multi-decade hold.
- At projected returns (-2.8% appreciation + 3.0% rent growth), your $7k cash investment doubles in ~1 year — after that, you're playing with house money.
Negotiation context
- It's been on market 143 days — a 12% lower offer ($22k) is reasonable based on typical stale-listing flexibility.
- 5 sale attempts with the ask held roughly flat each time — persistent listings suggest the price (not the market) is what's stuck; bring a comps-based counter.
Risks & watch-outs
- Watch-outs: property tax is 4.2% of price; built in 1948 — expect roof / HVAC / electrical / plumbing capex.
Questions for the listing agent
- It's been on market 143 days. Have you received any prior offers? Is the seller open to a 12% concession, seller financing, or rate buy-down credit?
- Built in 1948 — when were the roof, HVAC, electrical panel, plumbing, and water heater last replaced?
- Property tax is high relative to price — has the assessment been appealed recently, and will the sale trigger a re-assessment?
- Why hasn't it sold? Are there any deal-killer items the seller is aware of (foundation, flood, title, zoning, code violations)?
- Is there a deadline driving the sale (1031 exchange, divorce, estate, relocation)? That informs how much negotiation room exists.
- Schools are A-rated — typically a magnet for longer-tenancy family renters. What's the average tenant stay here, and is there a school-zone premium baked into asking?
- Crime grade is F in this area — have there been break-ins, vandalism, or insurance claims at this property in the last 3 years? What carrier currently insures it and at what premium?
- What's the average days-on-market for RENTAL listings here right now (not sales)? A rising rental-DOM trend means longer vacancies and softer asking-rent achievability than the comps imply.
- What's the recent tenant-quality profile in this submarket — average credit score on applications, eviction rate, late-payment / NSF rate, and stable-employment percentage? A property-management company in the area should have these aggregated.
- How much new for-sale + rental construction is in the pipeline within 1–3 miles? Heavy new supply typically softens prices + rents 12–24 months out; constrained supply supports both.
Investment metrics
- 1% rule
- 4.97% ✓
- Cap rate
- 42.36%
- Cash-on-cash
- 128.80%
- DSCR
- 6.73
- GRM
- 1.7
CMA / ARV
- ARV (on-the-fly)
- $43,090
- Comps found
- 12
Show comp detail 12 sales within ~0.75 mi
| Address | Dist | Beds/Ba | Sqft | Sold | Price | $/sf | Match |
|---|---|---|---|---|---|---|---|
| 510 21st St W | 0.50mi | 2/1.5 (-1) | 1,368 (-2%) | 4mo | $60,000 | $44 | 64 |
| 916 Michael Ave | 0.10mi | 3/1.5 | 1,200 (-14%) | 12mo | $45,000 | $38 | 60 |
| 1106 Barton St | 0.34mi | 3/1.0 | 1,222 (-12%) | 10mo | $20,000 | $16 | 56 |
| 1440 Madison Ave | 0.47mi | 2/1.0 (-1) | 1,392 (+0%) | 21mo | $50,000 | $36 | 56 |
| 1230 Stuart St | 0.46mi | 2/1.0 (-1) | 1,360 (-2%) | 18mo | $15,000 | $11 | 55 |
| 1203 7th Ave | 0.56mi | 2/1.0 (-1) | 1,344 (-3%) | 15mo | $10,000 | $7 | 51 |
| 1504 Frame St | 0.21mi | 3/1.5 | 1,202 (-14%) | 18mo | $79,200 | $66 | 50 |
| 712 Adams St | 0.57mi | 3/1.0 | 1,232 (-11%) | 8mo | $24,500 | $20 | 48 |
| 618 Hunt Ave | 0.61mi | 3/2.5 | 1,312 (-6%) | 11mo | $85,000 | $65 | 47 |
| 700 Adams St | 0.58mi | 3/1.0 | 1,300 (-6%) | 20mo | $40,000 | $31 | 45 |
| 706 Garvin Ave | 0.70mi | 4/1.0 (+1) | 1,370 (-1%) | 23mo | $25,500 | $19 | 41 |
| 826 W Washington St | 0.73mi | 3/1.0 | 1,258 (-10%) | 14mo | $31,000 | $25 | 38 |
Match score weights: distance 35% · size 25% · config 20% · recency 20%. Top-matched comps best support the ARV.
Projected returns pro-forma
-2.8% appreciation · 3.0% rent growth · sell at horizon
- IRR
- —
- Equity multiple
- 7.30×
- Total profit
- $44,065
- Equity at exit
- $3,952
- IRR
- —
- Equity multiple
- 15.34×
- Total profit
- $100,386
- Equity at exit
- $2,549
Cash invested: $7,000 (down + closing). Projections, not guarantees.
Landlord ↔ Tenant lean methodology
- Overall (STATE)
- 83 Strongly Landlord-Friendly
- State West Virginia
- 83 Strongly Landlord-Friendly · R+22
- County
- — inherits STATE
- City
- — inherits STATE
ZIP-level market 25387
- Home prices YoY
- -1.3%
- Active inventory
- 24
- Price-to-rent
- 1.7×
Monthly cashflow live
- Estimated rent
- $1,241 medium interval (Pro) →
- Mortgage (P&I)
- −$131
- Tax from tax record
- −$88 /mo · $1,054/yr
- Insurance
- −$10
- HOA
- −$0
- Vacancy / Maint / Mgmt
- −$261
- Net cashflow
- $751
Break-even live
UW: 25.0% down · 7.5% · 30yr · 1.5% tax · 5.0% vac · 8.0% maint · 8.0% mgmt
Financing live
Cash to close
- Down payment
- $6,250
- Closing costs
- $750
- Reserves months
- —
- Total cash needed
- —
Loan-product check · same deal, 3 products live
Conventional
25% down · 7.5% · 30yr
- Down + closing
- —
- Monthly P&I
- —
- Monthly cashflow
- —
- DSCR
- —
- Eligible?
- —
Personal DTI + credit; lowest rate.
DSCR
20% down · 8.5% · 30yr
- Down + closing
- —
- Monthly P&I
- —
- Monthly cashflow
- —
- DSCR
- —
- Eligible?
- —
No personal income docs; deal must DSCR.
Hard money
10% down · 12.0% · 12mo
- Down + closing
- —
- Monthly P&I
- —
- Monthly cashflow
- —
- DSCR
- —
- Eligible?
- —
Short-term bridge; refi at stabilization.
Listing history 28 events
-
2026-06-19days on market $25,000 Active 143 DOM
-
2026-06-18days on market $25,000 Active 142 DOM
-
2026-06-17days on market $25,000 Active 141 DOM
-
2026-06-16days on market $25,000 Active 140 DOM
-
2026-06-15days on market $25,000 Active 139 DOM
-
2026-06-14days on market $25,000 Active 137 DOM
-
2026-06-12days on market $25,000 Active 136 DOM
-
2026-06-09days on market $25,000 Active 133 DOM
-
2026-06-08days on market $25,000 Active 132 DOM
-
2026-06-07days on market $25,000 Active 131 DOM
-
2026-06-05days on market $25,000 Active 128 DOM
-
2026-06-03days on market $25,000 Active 127 DOM
-
2026-06-02days on market $25,000 Active 126 DOM
-
2026-06-01days on market $25,000 Active 125 DOM
-
2026-05-31days on market $25,000 Active 124 DOM
-
2026-05-30days on market $25,000 Active 123 DOM
-
2026-03-28status Active
-
2026-03-15status Pending
-
2026-01-15$25,000 Active
-
2025-10-17status Active
-
2025-10-09status Pending
-
2025-09-23price $25,000
-
2025-09-02price $30,000
-
2025-07-10status Active
-
2025-07-07status Pending
-
2025-06-12historical Active Under Contract
-
2025-05-14$35,000 Active
-
1999-07-14soldstatus $37,000
ⓘ Source: listings_history table (triggers on properties + properties_extension) + one-shot
backfill from property_details.listing_events for pre-trigger history.
Tax reassessment forecast WV · Resets to sale price
- Current annual tax
- $1,054 · $88/mo
- Projected year-2 tax
- $1,054 · $88/mo
- Expected delta
- $0/yr ($0/mo · 0.0%)
ⓘ Screening estimate from a state-policy table — verify with the county assessor before closing.
Climate risk First Street
- Flood 1/10 Low FEMA zone X (unshaded) · 0% chance over 30 yrs
- Wildfire 4/10 Moderate
- Heat 4/10 Moderate 7 d/yr ≥101°F today · 19 d/yr by 30 yrs out
- Wind 2/10 Low 100% chance of damaging wind over 30 yrs
- Air quality 1/10 Low 0 unhealthy d/yr today · 0 by 30 yrs out
Nearby sold comps map
Loading sold comps map…
Walkable amenities ~0.75 mi
Loading nearby amenities…
Taxation est. · year 1
- Rental income
- $14,896
- − Mortgage interest
- −$1,400
- − Property taxes
- −$1,054
- − Insurance
- −$125
- − Repairs & maintenance
- −$1,192
- − Management
- −$1,192
- − Depreciation
- −$727
- Taxable income
- $9,206
- Est. tax owed @ 24.0%
- −$2,209
- After-tax cash flow
- $6,806/yr
For passive investors: Depreciation is non-cash, so a rental often shows a tax loss while cash-flowing — sheltering income. Rental losses are passive: they offset passive income freely, and up to $25,000/yr can offset ordinary (W-2) income if you actively participate and your MAGI is under $100k (phasing out to $0 by $150k); unused losses carry forward. On sale, claimed depreciation is recaptured at up to 25%, and gains may owe capital-gains tax (a 1031 exchange can defer both). Figures are a year-1 estimate at your 24.0% rate — not tax advice; consult a CPA.
Schools (NCES district)
- District
- Kanawha County Schools
- NCES district ID
- 5400600
- Math proficiency
- 29% ▼ -13.00%
- Reading proficiency
- 40% ▼ -7.00%
- Median HH income
- $44,329
- Composite
- 29.35/100
- National rank
- #6540
- State rank
- #17 of 55 in WV
Livability — Charleston
- Score
- 85/100
- State rank
- #3
- US rank
- #524
Category grades
Schools grade is shown separately in the Schools card above.
Census & demographics
- Census place
- Charleston, WV
- City population
- 33,502
- Population (ZIP)
- 5,173
Population outlook (Kanawha County) Hauer SSP2
- Today (2025)
- 178,946 people
- By 2030
- 172,906 · -3.4%
- By 2040
- 159,874 · -10.7%
- By 2050
- 148,148 · -17.2%
- By 2075
- 123,257 · -31.1%
- By 2100
- 96,454 · -46.1%
Race, ethnicity, and origin ACS 2023
- Neighborhood character
- Predominantly White (69%)
- Race & ethnicity
- White 69% Black 15% Two or more races 14% Hispanic / Latino 1%
- Common ancestry
- Iranian 2% Serbian 2% Slovak 1%
- Foreign-born
- 1%
Political lean MEDSL · Kanawha
- 2024 margin
- R (+17.4) · D 40.2% · R 57.6% · Other 2.2%
- 2008→2024 swing
- -17.0pp toward R · 2008: -0.4pp · 2024: -17.4pp
- All cycles
- 2024: R+17.4 2020: R+14.7 2016: R+20.6 2012: R+11.9 2008: R+0.4
Not yet ingested
- Civics
- —
Market trends
- HPI YoY
- ▼ -2.80%
- Current HPI
- 212.6658
- Rent YoY
- —
- Metro
- —
- State GDP YoY
- —
- F500 in state
- 0
Price history
-32.4% since first listed12 events — show timeline
- 2026-03-28 Relisted — KVBOR
- 2026-03-15 Pending — KVBOR
- 2026-01-15 Listed $25,000 KVBOR
- 2025-10-17 Relisted — KVBOR
- 2025-10-09 Pending — KVBOR
- 2025-09-23 Price Changed $25,000 KVBOR
- 2025-09-02 Price Changed $30,000 KVBOR
- 2025-07-10 Relisted — KVBOR
- 2025-07-07 Pending — KVBOR
- 2025-06-12 Contingent — KVBOR
- 2025-05-14 Listed $35,000 KVBOR
- 1999-07-14 Sold (Public Records) $37,000 Public Records
Property tax history
+3.3%/yrLatest (2025): $1,054 · +11.4% YoY. Source: county tax records.
Cash-flow waterfall
monthlySold comps — $/sqft
last 12 mo · ≤1 miLoading sold comps…