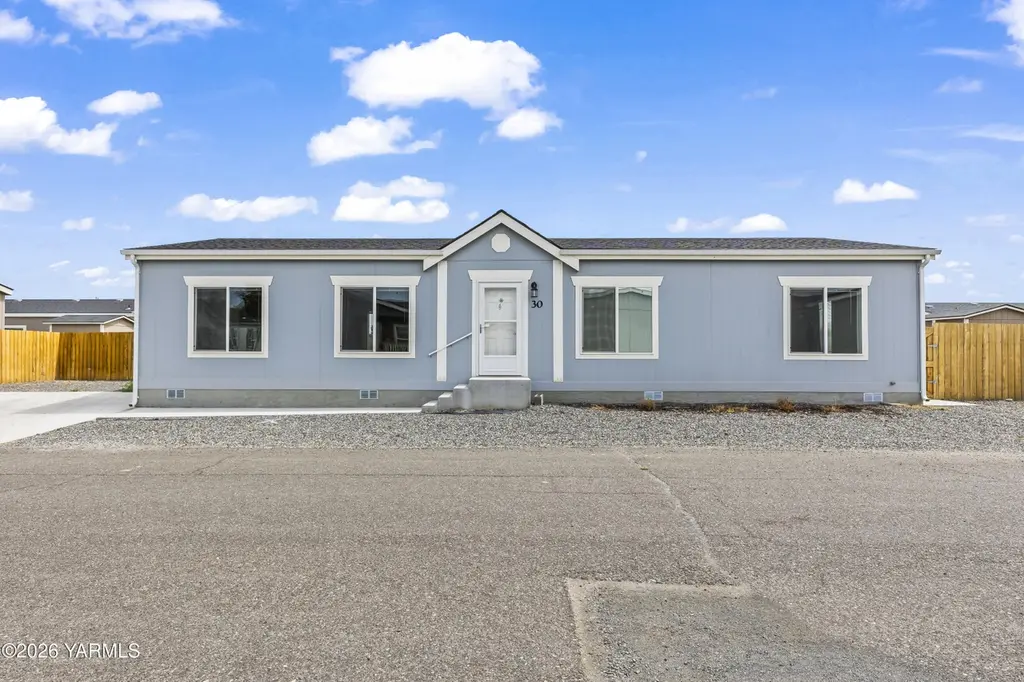
2802 S 5th Ave #30 · Union Gap, WA
Flood risk No data
- FEMA flood zone
- —
- Chance of flooding over 30 yrs
- —
- Est. flood insurance / yr
- —
Fire risk No data
- Est. fire insurance / yr
- —
Heat risk No data
- Hot days now (above threshold)
- —
- Hot days in 30 yrs
- —
Wind risk No data
- Chance of severe wind over 30 yrs
- —
Air-quality risk No data
- Unhealthy air days now
- —
- Unhealthy air days in 30 yrs
- —
Risk factors via First Street. Map © Google.
Why this score? — see what drove the B- grade
The composite is a weighted blend of 9 inputs, each scored 0–100. Each bar is that input's sub-score; the figure is the points it added to the 100-point composite (weight × sub-score).
- Cash flow +30.0/30.0
- DSCR +10.0/10.0
- 1% rule +8.1/10.0
- ARV discount +5.4/15.0
- Schools +4.9/10.0
- Condition / age +4.0/5.0
- Livability +3.3/5.0
- Rent growth +2.5/5.0
- Appreciation +0.0/10.0
$143,000
🖨 Deal sheet 📄 Offer letter ✓ Due diligence
Listing remarks MLS
Welcome to this beautifully maintained 3-bedroom, 2-bath manufactured home built in 2021,ideally located in the heart of Union Gap. This home features a modern open-concept layout thatseamlessly connects the kitchen, dining, and living areas--perfect for both everyday living andentertaining. Enjoy contemporary finishes throughout, along with a spacious primary suite complete with aprivate bathroom. With its newer construction, thoughtful design, and excellent condition, thishome is truly move-in ready and offers the perfect blend of comfort and style. Conveniently situated just minutes from shopping, dining, and easy freeway access, this homeprovides both modern living and prime location
Key facts
- Move-in ready
- Newer construction
- Private bathroom
Tags
Neighborhood map
What this means for you Summary
Snapshot
- This is a 3-bed/2.0-bath single-family listed at $143k. Condition is rated good.
Deal economics
- At list price, monthly cash flow is $612 ($7k/yr) — positive.
- The deal already cash-flows at list — no discount required.
- Meets the 1% rule at list price ($2k rent vs $143k).
- Recommended offer: $130k (9.0% below list) — sets the bar for market timing.
- Cap rate 11.4% vs local median 4.5% in Union Gap — top-decile yield for the area; either an underpriced asset or a hidden risk that comps aren't pricing in. Stress-test before assuming the spread holds.
Location & tenants
- Location reads 66/100 on livability (#315 in WA) — a middle-class / working-renter tenant base. Strengths: cost of living A+, housing A+, health & safety A-; Watch: schools D, crime F, amenities F.
- Union Gap School District (suburban): math 54% / reading 59% proficiency, ranked #105 of 291 in WA (top 36%) — acceptable for families but not a draw, mixed tenant base, ~2y average lease; 71% free/reduced lunch — lower-income household profile, screen leases tightly.
- Market conditions: 172 active listings in the ZIP; 5 comparable units currently listed for rent nearby; rentals at typical pace (median 21d on market — plan ~3-4 weeks tenant-placement turnaround); 468 units permitted in Yakima County in 2024 (23 in 5+ unit buildings).
Forward outlook
- Local home prices are declining (-3.0%/yr); year-one equity from $989 of loan paydown is wiped out by about $4k of value loss. Plan a longer hold.
- Yakima County population projected at +6% by 2050 — modest demand growth; plan on rents tracking national, not racing it.
- At projected returns (-3.0% appreciation + 3.0% rent growth), your $40k cash investment doubles in ~7 years — after that, you're playing with house money.
Negotiation context
- It's been on market 100 days — a 9% lower offer ($130k) is reasonable based on typical stale-listing flexibility.
- 6 sale attempts since 2y ago with the ask held roughly flat each time — persistent listings suggest the price (not the market) is what's stuck; bring a comps-based counter.
Questions for the listing agent
- It's been on market 100 days. Have you received any prior offers? Is the seller open to a 9% concession, seller financing, or rate buy-down credit?
- Why hasn't it sold? Are there any deal-killer items the seller is aware of (foundation, flood, title, zoning, code violations)?
- Is there a deadline driving the sale (1031 exchange, divorce, estate, relocation)? That informs how much negotiation room exists.
- Schools are D-rated, which usually means shorter tenancies and higher turnover. Who's the typical renter profile here, and what's been the actual vacancy rate?
- Crime grade is F in this area — have there been break-ins, vandalism, or insurance claims at this property in the last 3 years? What carrier currently insures it and at what premium?
- What's the average days-on-market for RENTAL listings here right now (not sales)? A rising rental-DOM trend means longer vacancies and softer asking-rent achievability than the comps imply.
- What's the recent tenant-quality profile in this submarket — average credit score on applications, eviction rate, late-payment / NSF rate, and stable-employment percentage? A property-management company in the area should have these aggregated.
- How much new for-sale + rental construction is in the pipeline within 1–3 miles? Heavy new supply typically softens prices + rents 12–24 months out; constrained supply supports both.
Investment metrics
- 1% rule
- 1.31% ✓
- Cap rate
- 11.43%
- Cash-on-cash
- 18.34%
- DSCR
- 1.82
- GRM
- 6.4
CMA / ARV
- ARV (median comp)
- $136,515
- List price
- $143,000
- Delta
- 4.75%
- Verdict
- FAIR
- Comps
- 6 within 1.0 mi
Show comp detail 1 sale within ~0.75 mi
| Address | Dist | Beds/Ba | Sqft | Sold | Price | $/sf | Match |
|---|---|---|---|---|---|---|---|
| 2203 S 5th Ave | 0.67mi | 3/1.0 | 1,424 (-6%) | 8mo | $250,000 | $176 | 49 |
Match score weights: distance 35% · size 25% · config 20% · recency 20%. Top-matched comps best support the ARV.
Projected returns pro-forma
-3.0% appreciation · 3.0% rent growth · sell at horizon
- IRR
- 10.0%
- Equity multiple
- 1.39×
- Total profit
- $15,753
- Equity at exit
- $21,322
- IRR
- 19.1%
- Equity multiple
- 2.59×
- Total profit
- $63,717
- Equity at exit
- $12,364
Cash invested: $40,040 (down + closing). Projections, not guarantees.
Landlord ↔ Tenant lean methodology
- Overall (STATE)
- 28 Tenant-Leaning
- State Washington
- 28 Tenant-Leaning · D+8
- County
- — inherits STATE
- City
- — inherits STATE
ZIP-level market 98903
- Home prices YoY
- -21.8%
- Active inventory
- 172
- Price-to-rent
- 6.4×
Monthly cashflow live
- Estimated rent
- $1,876 high interval (Pro) →
- Mortgage (P&I)
- −$750
- Tax from tax record
- −$61 /mo · $728/yr
- Insurance
- −$60
- HOA
- −$0
- Vacancy / Maint / Mgmt
- −$394
- Net cashflow
- $612
Break-even live
UW: 25.0% down · 7.5% · 30yr · 1.5% tax · 5.0% vac · 8.0% maint · 8.0% mgmt
Financing live
Cash to close
- Down payment
- $35,750
- Closing costs
- $4,290
- Reserves months
- —
- Total cash needed
- —
Loan-product check · same deal, 3 products live
Conventional
25% down · 7.5% · 30yr
- Down + closing
- —
- Monthly P&I
- —
- Monthly cashflow
- —
- DSCR
- —
- Eligible?
- —
Personal DTI + credit; lowest rate.
DSCR
20% down · 8.5% · 30yr
- Down + closing
- —
- Monthly P&I
- —
- Monthly cashflow
- —
- DSCR
- —
- Eligible?
- —
No personal income docs; deal must DSCR.
Hard money
10% down · 12.0% · 12mo
- Down + closing
- —
- Monthly P&I
- —
- Monthly cashflow
- —
- DSCR
- —
- Eligible?
- —
Short-term bridge; refi at stabilization.
Rent comps 5 comps
| Address | Beds | Baths | Sqft | Rent | $/sqft | DOM | Units | Dist |
|---|---|---|---|---|---|---|---|---|
| Samantha Ct Union Gap, WA | 3.0 | 2.5 | 1437 | $1,900 | $1.32 | 21d | 1 | 0.68mi |
| 2212 S 1st Ave Unit 1-3 Union Gap, WA | 3.0 | 2.0 | 1200 | $1,900 | $1.58 | 13d | 1 | 0.69mi |
| 1917 Landon Ave Union Gap, WA | 3.0 | 2.0 | 1400 | $2,100 | $1.50 | 43d | 1 | 1.03mi |
| 809 W Washington Ave Yakima, WA | 2.0 | 2.0 | 1264 | $1,595 | $1.26 | 13d | 1 | 1.15mi |
| 1106 Spokane St Yakima, WA | 3.0 | 1.0 | 1400 | $1,795 | $1.28 | 21d | 1 | 1.30mi |
Listing history 42 events
-
2026-06-19days on market $143,000 Active 100 DOM
-
2026-06-18days on market $143,000 Active 99 DOM
-
2026-06-17days on market $143,000 Active 98 DOM
-
2026-06-16days on market $143,000 Active 97 DOM
-
2026-06-15days on market $143,000 Active 96 DOM
-
2026-06-14days on market $143,000 Active 94 DOM
-
2026-06-13days on market $143,000 Active 93 DOM
-
2026-06-10days on market $143,000 Active 91 DOM
-
2026-06-09days on market $143,000 Active 90 DOM
-
2026-06-08days on market $143,000 Active 89 DOM
-
2026-06-07days on market $143,000 Active 88 DOM
-
2026-06-03days on market $143,000 Active 84 DOM
-
2026-06-02days on market $143,000 Active 83 DOM
-
2026-06-01days on market $143,000 Active 82 DOM
-
2026-05-31days on market $143,000 Active 81 DOM
-
2026-05-30days on market $143,000 Active 80 DOM
-
2026-03-11$143,000 Active 696-char remark
Show marketing remark (696 chars)
Welcome to this beautifully maintained 3-bedroom, 2-bath manufactured home built in 2021,ideally located in the heart of Union Gap. This home features a modern open-concept layout thatseamlessly connects the kitchen, dining, and living areas--perfect for both everyday living andentertaining. Enjoy contemporary finishes throughout, along with a spacious primary suite complete with aprivate bathroom. With its newer construction, thoughtful design, and excellent condition, thishome is truly move-in ready and offers the perfect blend of comfort and style. Conveniently situated just minutes from shopping, dining, and easy freeway access, this homeprovides both modern living and prime location
-
2026-02-03price $143,000
-
2025-10-21price $145,000
-
2025-08-08$150,000 Active
-
2025-07-14price $155,000
-
2025-07-14price $155,000
-
2025-06-09price $165,000
-
2025-06-09price $165,000
-
2025-04-03price $165,500
-
2025-03-21price $165,500
-
2025-03-11price $170,000
-
2025-03-11price $170,000
-
2025-03-11price $175,000
-
2025-03-11price $175,000
-
2025-03-03price $170,000
-
2025-03-03price $170,000
-
2025-01-02price $175,000
-
2025-01-02price $175,000
-
2024-12-05$180,000 Active
-
2024-12-05$180,000 Active
-
2024-08-07soldstatus $175,000 Closed
-
2024-08-07soldstatus $175,000 Closed
-
2024-06-03historical Active Under Contract
-
2024-06-03status Pending
-
2024-03-11$180,000 Active
-
2024-03-11$180,000 Active
ⓘ Source: listings_history table (triggers on properties + properties_extension) + one-shot
backfill from property_details.listing_events for pre-trigger history.
Tax reassessment forecast WA · Resets to sale price
- Current annual tax
- $728 · $61/mo
- Projected year-2 tax
- $1,401 · $117/mo
- Expected delta
- +$674/yr (+$56/mo · 92.5%)
ⓘ Screening estimate from a state-policy table — verify with the county assessor before closing.
Nearby sold comps map
Loading sold comps map…
Walkable amenities ~0.75 mi
Loading nearby amenities…
Taxation est. · year 1
- Rental income
- $22,511
- − Mortgage interest
- −$8,010
- − Property taxes
- −$728
- − Insurance
- −$715
- − Repairs & maintenance
- −$1,801
- − Management
- −$1,801
- − Depreciation
- −$4,160
- Taxable income
- $5,297
- Est. tax owed @ 24.0%
- −$1,271
- After-tax cash flow
- $6,071/yr
For passive investors: Depreciation is non-cash, so a rental often shows a tax loss while cash-flowing — sheltering income. Rental losses are passive: they offset passive income freely, and up to $25,000/yr can offset ordinary (W-2) income if you actively participate and your MAGI is under $100k (phasing out to $0 by $150k); unused losses carry forward. On sale, claimed depreciation is recaptured at up to 25%, and gains may owe capital-gains tax (a 1031 exchange can defer both). Figures are a year-1 estimate at your 24.0% rate — not tax advice; consult a CPA.
Condition & rehab AI · 12 photos
This move-in ready manufactured home is in excellent condition with modern finishes and a prime location.
Value-add opportunities
- Both Painting the exterior and interior walls — Fresh paint can enhance curb appeal and interior aesthetics
- Both Landscaping the yard — A well-maintained yard can improve curb appeal and attract potential buyers
- Both Adding smart home features — Smart home features can increase both resale and rental value by making the home more convenient and energy-efficient
Renovation cost estimate screening
Value-add ROI direction
- Both Painting the exterior and interior walls — Fresh paint can enhance curb appeal and interior aesthetics ↑
- Both Landscaping the yard — A well-maintained yard can improve curb appeal and attract potential buyers ↑
- Both Adding smart home features — Smart home features can increase both resale and rental value by making the home more convenient and energy-efficient ↑
ⓘ Cost ranges are severity-bucket heuristics (US national rule-of-thumb). Get contractor quotes + a written scope before underwriting a rehab budget.
Schools (NCES district)
- District
- Union Gap School District
- NCES district ID
- 5309150
- Math proficiency
- 54% ▬ 0.00%
- Reading proficiency
- 59% ▲ 4.00%
- Median HH income
- $35,603
- Composite
- 48.54/100
- National rank
- #4614
- State rank
- #105 of 291 in WA
Livability — Union Gap
- Score
- 66/100
- State rank
- #315
- US rank
- #11294
Category grades
Schools grade is shown separately in the Schools card above.
Census & demographics
- Census place
- Union Gap, WA
- Population (ZIP)
- 19,010
Population outlook (Yakima County) Hauer SSP2
- Today (2025)
- 256,514 people
- By 2030
- 259,403 · +1.1%
- By 2040
- 265,677 · +3.6%
- By 2050
- 273,061 · +6.5%
- By 2075
- 296,991 · +15.8%
- By 2100
- 315,291 · +22.9%
Race, ethnicity, and origin ACS 2023
- Neighborhood character
- Diverse neighborhood (Simpson 0.58)
- Race & ethnicity
- White 49% Hispanic / Latino 42% Two or more races 19% Asian 3% Native American 3%
- Hispanic origin (detail)
- Mexican 38%
- Common ancestry
- Italian 3% Portuguese 2% Lithuanian 1%
- Foreign-born
- 15% · Canada, Vietnam
- Languages at home
- 63% English-only · Spanish 33% Other Asian/Pacific 1% Other Indo-European 1%
Political lean MEDSL · Yakima
- 2024 margin
- R (+14.3) · D 41.6% · R 55.9% · Other 2.5%
- 2008→2024 swing
- -3.8pp toward R · 2008: -10.6pp · 2024: -14.3pp
- All cycles
- 2024: R+14.3 2020: R+7.7 2016: R+15.4 2012: R+15.1 2008: R+10.6
Not yet ingested
- Civics
- —
Market trends
- HPI YoY
- ▼ -83.90%
- Current HPI
- 300.5753
- Rent YoY
- —
- Metro
- —
- State GDP YoY
- ▲ 4.65%
- F500 in state
- 22
Industry mix (Fortune 500 HQ in WA)
| Industry | F500 HQs | Revenue |
|---|---|---|
| Retail | 2 | $269B |
|
||
| Technology / Retail | 1 | $638B |
|
||
| Technology | 1 | $245B |
|
||
| Telecommunications | 1 | $38B |
|
||
| Food / Beverage | 1 | $36B |
|
||
| Automotive / Trucks | 1 | $34B |
|
||
Price history
-20.6% since first listed26 events — show timeline
- 2026-03-11 Listed $143,000 YAMLS
- 2026-02-03 Price Changed $143,000 YAMLS
- 2025-10-21 Price Changed $145,000 YAMLS
- 2025-08-08 Listed $150,000 YAMLS
- 2025-07-14 Price Changed $155,000 PACMLS
- 2025-07-14 Price Changed $155,000 YAMLS
- 2025-06-09 Price Changed $165,000 PACMLS
- 2025-06-09 Price Changed $165,000 YAMLS
- 2025-04-03 Price Changed $165,500 PACMLS
- 2025-03-21 Price Changed $165,500 YAMLS
- 2025-03-11 Price Changed $170,000 PACMLS
- 2025-03-11 Price Changed $170,000 YAMLS
- 2025-03-11 Price Changed $175,000 PACMLS
- 2025-03-11 Price Changed $175,000 YAMLS
- 2025-03-03 Price Changed $170,000 PACMLS
- 2025-03-03 Price Changed $170,000 YAMLS
- 2025-01-02 Price Changed $175,000 PACMLS
- 2025-01-02 Price Changed $175,000 YAMLS
- 2024-12-05 Listed $180,000 PACMLS
- 2024-12-05 Listed $180,000 YAMLS
- 2024-08-07 Sold (MLS) $175,000 YAMLS
- 2024-08-07 Sold (MLS) $175,000 PACMLS
- 2024-06-03 Contingent — PACMLS
- 2024-06-03 Pending — YAMLS
- 2024-03-11 Listed $180,000 YAMLS
- 2024-03-11 Listed $180,000 PACMLS
Property tax history
-6.4%/yrLatest (2026): $728 · -9.1% YoY. Source: county tax records.
Cash-flow waterfall
monthlySold comps — $/sqft
last 12 mo · ≤1 miLoading sold comps…