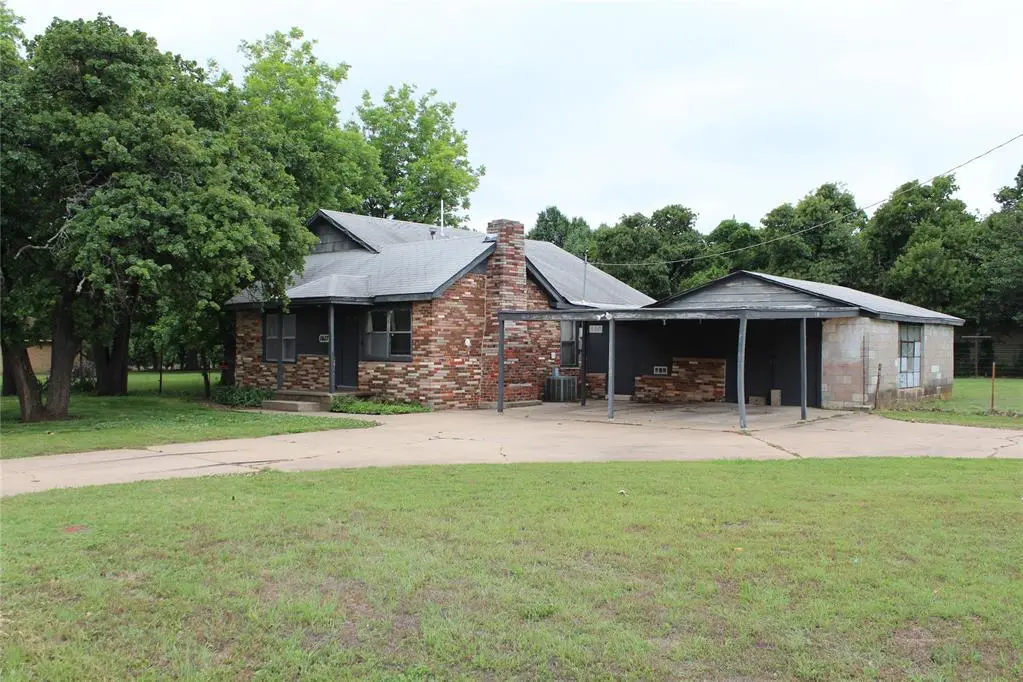
1617 N Westminster Rd · Nicoma Park, OK
Flood risk 1/10 · Minimal
- FEMA flood zone
- X (unshaded)
- Chance of flooding over 30 yrs
- 0.0%
- Est. flood insurance / yr
- $507 – $1,088
Fire risk 5/10 · Moderate
- Est. fire insurance / yr
- $2,463 – $4,575
Heat risk 5/10 · Moderate
- Hot days now (above 107°F)
- 7 days/yr
- Hot days in 30 yrs
- 19 days/yr
Wind risk 3/10 · Minor
- Chance of severe wind over 30 yrs
- 5.0%
Air-quality risk 2/10 · Minimal
- Unhealthy air days now
- 1 days/yr
- Unhealthy air days in 30 yrs
- 2 days/yr
Risk factors via First Street. Map © Google.
Why this score? — see what drove the D+ grade
The composite is a weighted blend of 9 inputs, each scored 0–100. Each bar is that input's sub-score; the figure is the points it added to the 100-point composite (weight × sub-score).
- ARV discount +15.0/15.0
- Cash flow +13.6/30.0
- DSCR +4.1/10.0
- Rent growth +3.9/5.0
- Livability +3.3/5.0
- 1% rule +3.2/10.0
- Schools +2.8/10.0
- Condition / age +2.5/5.0
- Appreciation +0.0/10.0
$150,000
🖨 Deal sheet (PDF) 📄 Offer letter ✓ Due diligence
Listing remarks
Huge Potential! Are you looking for a "Fixer Upper"? Here it is! This home has tons of potential and with some creativity and work could be an amazing home! Located on a . 84 acre lot with beautiful, mature pecan trees. Inside there are wood floors, spacious rooms, a concrete storm shelter, and an old garage space that's been used as a work shop in times past. The home now has a carport and a big circle drive in front. For utilities, electricity and gas are available, along with city sewer, and it has it's own water well. Yes, the home needs work, so bring an open mind and see the potential to make this property into your next home!
Key facts
- Mature pecan trees
- Big circle drive
- Water well
Tags
Property features AI
Finance
- Other: Living area reported as 1,310 (source: assessor); Lot dimensions approximately 225 x 162; Lot size about 0.84 acres; Vacant and not occupied; Manual geocode; directions available
- Financial info: Sold/offered as-is
- HOA & community: No mandatory association dues
Exterior
- Parking: Circle drive; Concrete parking surface
- Utilities: Public utilities available; Private well available
- Home design: Single-family residence; One level; Property faces east; Residential property
- Construction: Brick and frame construction; Composition roof; Aluminum frame windows; Conventional foundation; Built (existing property)
- Exterior features: Corner lot; Section line lot; Combination fencing; Below-ground storm shelter
Interior
- Bedrooms: 3 bedrooms
- Bathrooms: 1 full bathroom
- Heating & cooling: Window unit(s) for cooling
- Interior features: Covered porch; No fireplace; In-law plan not present
Neighborhood map
What this means for you Summary
Snapshot
- This is a 2-bed/1.0-bath single-family listed at $150k.
Deal economics
- At list price, monthly cash flow is $8 ($99/yr) — positive.
- The deal already cash-flows at list — no discount required.
- To meet the 1% rule (rent ≥ 1% of price), the offer needs to be $122k (18.4% below list).
- Recommended offer: $122k (18.4% below list) — sets the bar for 1% rule.
Location & tenants
- Location reads 66/100 on livability (#109 in OK) — a middle-class / working-renter tenant base. Strengths: cost of living A+, housing A+; Watch: health & safety C-, amenities F, commute F.
- Choctaw-Nicoma Park (suburban): math 28% / reading 32% proficiency, ranked #48 of 270 in OK (top 18%) — families likely to look elsewhere, expect single-tenant / working-renter base with shorter leases.
- Zoned schools: Nicoma Park Es (441 students, 0% FRL); Nicoma Park Ms (math 23% / reading 29%, grade F, #79 of 345 statewide, top 24%, 622 students, 0% FRL); Choctaw Hs (math 26% / reading 37%, grade F, #73 of 447 statewide, top 16%, 1,811 students, 0% FRL) — zoned schools average 0% FRL vs 34% district-wide (34 pts lower); this property's tenant base skews higher-income than the district average.
- Market conditions: Rents rising fast (+5.7%/yr); 167 active listings in the ZIP; 12 comparable units currently listed for rent nearby; rentals at typical pace (median 19d on market — plan ~3-4 weeks tenant-placement turnaround); 5,365 units permitted in Oklahoma County in 2024 (569 in 5+ unit buildings).
Forward outlook
- Local home prices are declining (-3.0%/yr); year-one equity from $1k of loan paydown is wiped out by about $4k of value loss. Plan a longer hold.
- Oklahoma County population projected at +41% by 2050 — long-run rental-demand tailwind backs the buy-and-hold thesis.
Negotiation context
- It's been on market 24 days — a 2% lower offer ($148k) is reasonable based on typical stale-listing flexibility.
Risks & watch-outs
- Watch-outs: built in 1920 — expect roof / HVAC / electrical / plumbing capex.
- Climate carrying-cost: moderate wildfire risk; extreme-heat days projected 7→19/yr by 2055 (HVAC capex compounding) — expect insurance premiums to compound above CPI over the hold.
Questions for the listing agent
- Built in 1920 — when were the roof, HVAC, electrical panel, plumbing, and water heater last replaced?
- Is there a deadline driving the sale (1031 exchange, divorce, estate, relocation)? That informs how much negotiation room exists.
- Schools are D-rated, which usually means shorter tenancies and higher turnover. Who's the typical renter profile here, and what's been the actual vacancy rate?
- The area grade is low — what's the realistic commute time and amenity access for the typical tenant pool here? Any planned neighborhood developments (good or bad) we should know about?
- What's the average days-on-market for RENTAL listings here right now (not sales)? A rising rental-DOM trend means longer vacancies and softer asking-rent achievability than the comps imply.
- What's the recent tenant-quality profile in this submarket — average credit score on applications, eviction rate, late-payment / NSF rate, and stable-employment percentage? A property-management company in the area should have these aggregated.
- How much new for-sale + rental construction is in the pipeline within 1–3 miles? Heavy new supply typically softens prices + rents 12–24 months out; constrained supply supports both.
Investment metrics
- 1% rule
- 0.82% ✗
- Cap rate
- 6.36%
- Cash-on-cash
- 0.24%
- DSCR
- 1.01
- GRM
- 10.2
CMA / ARV
- ARV (on-the-fly)
- $209,328
- Comps found
- 12
Show comp detail 12 sales within ~0.75 mi
| Address | Dist | Beds/Ba | Sqft | Sold | Price | $/sf | Match |
|---|---|---|---|---|---|---|---|
| 1801 N Westminster Rd | 0.12mi | 2/2.0 | 1,188 (+1%) | 2mo | $220,000 | $185 | 87 |
| 11010 Draper Ave | 0.09mi | 2/1.0 | 1,092 (-7%) | 3mo | $132,500 | $121 | 82 |
| 10817 NE 16th St | 0.15mi | 3/1.0 (+1) | 1,160 (-1%) | 7mo | $125,000 | $108 | 80 |
| 1940 Ives Way | 0.34mi | 2/2.0 | 1,236 (+5%) | 3mo | $220,000 | $178 | 69 |
| 1221 Whitehurst Ln | 0.34mi | 3/1.5 (+1) | 1,192 (+1%) | 7mo | $190,000 | $159 | 69 |
| 11027 E Draper Ave | 0.16mi | 3/2.0 (+1) | 1,228 (+4%) | 9mo | $223,000 | $182 | 69 |
| 1214 N Westminster Rd | 0.36mi | 3/2.0 (+1) | 1,282 (+9%) | 4mo | $180,000 | $140 | 56 |
| 10720 NE 10th St | 0.62mi | 3/2.0 (+1) | 1,195 (+2%) | 8mo | $219,900 | $184 | 52 |
| 1116 N Timber Rd | 0.45mi | 2/2.0 | 1,015 (-14%) | 1mo | $310,000 | $305 | 52 |
| 1520 Patricia Dr | 0.50mi | 3/1.0 (+1) | 1,040 (-12%) | 6mo | $120,000 | $115 | 47 |
| 10313 NE 17 St | 0.65mi | 2/1.0 | 1,036 (-12%) | 11mo | $188,300 | $182 | 41 |
| 11379 Kirkwin Ln | 0.61mi | 3/1.5 (+1) | 1,005 (-14%) | 12mo | $160,000 | $159 | 31 |
Match score weights: distance 35% · size 25% · config 20% · recency 20%. Top-matched comps best support the ARV.
Projected returns pro-forma
-3.0% appreciation · 5.73% rent growth · sell at horizon
- IRR
- -13.2%
- Equity multiple
- 0.52×
- Total profit
- $-20,358
- Equity at exit
- $22,365
- IRR
- -0.7%
- Equity multiple
- 0.95×
- Total profit
- $-2,189
- Equity at exit
- $12,969
Cash invested: $42,000 (down + closing). Projections, not guarantees.
Landlord ↔ Tenant lean methodology
- Overall (STATE)
- 83 Strongly Landlord-Friendly
- State Oklahoma
- 83 Strongly Landlord-Friendly · R+20
- County
- — inherits STATE
- City
- — inherits STATE
ZIP-level market 73130
- Home prices YoY
- -21.0%
- Rents YoY
- 5.7%
- Active inventory
- 167
- Price-to-rent
- 10.2×
Monthly cashflow live
- Estimated rent
- $1,223 high interval (Pro) →
- Mortgage (P&I)
- −$787
- Tax from tax record
- −$109 /mo · $1,308/yr
- Insurance
- −$62
- HOA
- −$0
- Vacancy / Maint / Mgmt
- −$257
- Net cashflow
- $8
Break-even live
Sensitivity live
| Price | -10% $93 | -5% $51 | +0% $8 | +5% $-34 | +10% $-77 |
|---|---|---|---|---|---|
| Rent | -10% $-88 | -5% $-40 | +0% $8 | +5% $57 | +10% $105 |
| Rate | -1.0pp $84 | -0.5pp $46 | base $8 | +0.5pp $-31 | +1.0pp $-70 |
UW: 25.0% down · 7.5% · 30yr · 1.5% tax · 5.0% vac · 8.0% maint · 8.0% mgmt
Financing live
Cash to close
- Down payment
- $37,500
- Closing costs
- $4,500
- Reserves months
- —
- Total cash needed
- —
Loan-product check · same deal, 3 products live
Conventional
25% down · 7.5% · 30yr
- Down + closing
- —
- Monthly P&I
- —
- Monthly cashflow
- —
- DSCR
- —
- Eligible?
- —
Personal DTI + credit; lowest rate.
DSCR
20% down · 8.5% · 30yr
- Down + closing
- —
- Monthly P&I
- —
- Monthly cashflow
- —
- DSCR
- —
- Eligible?
- —
No personal income docs; deal must DSCR.
Hard money
10% down · 12.0% · 12mo
- Down + closing
- —
- Monthly P&I
- —
- Monthly cashflow
- —
- DSCR
- —
- Eligible?
- —
Short-term bridge; refi at stabilization.
Rent comps 12 comps
| Address | Beds | Baths | Sqft | Rent | $/sqft | DOM | Units | Dist |
|---|---|---|---|---|---|---|---|---|
| 1520 Patricia Dr Oklahoma City, OK | 3.0 | 1.0 | 1040 | $1,200 | $1.15 | 45d | 1 | 0.51mi |
| 10400 Caton Pl Oklahoma City, OK | 3.0 | 2.0 | 1164 | $1,280 | $1.10 | 25d | 1 | 0.59mi |
| 10220 Isaac Dr Oklahoma City, OK | 3.0 | 1.0 | 1106 | $1,250 | $1.13 | 45d | 1 | 0.72mi |
| 2547 Nichols Dr Unit 1 Choctaw, OK | 1.0 | 1.0 | 725 | $780 | $1.08 | 6d | 1 | 0.98mi |
| 1817 Tim Dr Oklahoma City, OK | 3.0 | 2.0 | 1373 | $1,399 | $1.02 | 3d | 1 | 1.03mi |
| 1809 Michell Dr Oklahoma City, OK | 3.0 | 1.0 | 1125 | $1,095 | $0.97 | 4d | 1 | 1.12mi |
| 801 Royal Ave Oklahoma City, OK | 3.0 | 1.0 | 951 | $1,200 | $1.26 | 18d | 1 | 1.28mi |
| 1617 N Christine Dr Oklahoma City, OK | 2.0 | 2.0 | 962 | $1,050 | $1.09 | 25d | 1 | 1.36mi |
| 1525 N Christine Dr Oklahoma City, OK | 3.0 | 1.5 | 1264 | $1,035 | $0.82 | 4d | 1 | 1.36mi |
| 1525 McGregor Dr Oklahoma City, OK | 3.0 | 1.5 | 1012 | $1,275 | $1.26 | 3d | 1 | 1.41mi |
| 633 Lotus Ave Oklahoma City, OK | 3.0 | 1.0 | 1038 | $1,300 | $1.25 | 12d | 1 | 1.43mi |
| 9528 McIntosh Ave Oklahoma City, OK | 3.0 | 2.0 | 1164 | $1,195 | $1.03 | 45d | 1 | 1.44mi |
Listing history 15 events
-
2026-06-21days on market $150,000 Active 24 DOM
-
2026-06-18days on market $150,000 Active 21 DOM
-
2026-06-17days on market $150,000 Active 20 DOM
-
2026-06-16days on market $150,000 Active 19 DOM
-
2026-06-15days on market $150,000 Active 18 DOM
-
2026-06-13days on market $150,000 Active 16 DOM
-
2026-06-13days on market $150,000 Active 15 DOM
-
2026-06-09days on market $150,000 Active 12 DOM
-
2026-06-08days on market $150,000 Active 11 DOM
-
2026-06-07days on market $150,000 Active 10 DOM
-
2026-06-03days on market $150,000 Active 6 DOM
-
2026-06-02days on market $150,000 Active 5 DOM
-
2026-06-01days on market $150,000 Active 4 DOM
-
2026-05-31days on market $150,000 Active 3 DOM
-
2026-05-28$150,000 Active
ⓘ Source: listings_history table (triggers on properties + properties_extension) + one-shot
backfill from property_details.listing_events for pre-trigger history.
Tax reassessment forecast OK · Resets to sale price
- Current annual tax
- $1,308 · $109/mo
- Projected year-2 tax
- $1,350 · $112/mo
- Expected delta
- +$42/yr (+$4/mo · 3.2%)
ⓘ Screening estimate from a state-policy table — verify with the county assessor before closing.
Climate risk First Street
- Flood 1/10 Low FEMA zone X (unshaded) · 0% chance over 30 yrs
- Wildfire 5/10 Major
- Heat 5/10 Major 7 d/yr ≥107°F today · 19 d/yr by 30 yrs out
- Wind 3/10 Moderate 5% chance of damaging wind over 30 yrs
- Air quality 2/10 Low 1 unhealthy d/yr today · 2 by 30 yrs out
Nearby sold comps map
Loading sold comps map…
Walkable amenities ~0.75 mi
Loading nearby amenities…
Taxation est. · year 1
- Rental income
- $14,679
- − Mortgage interest
- −$8,402
- − Property taxes
- −$1,308
- − Insurance
- −$750
- − Repairs & maintenance
- −$1,174
- − Management
- −$1,174
- − Depreciation
- −$4,364
- Taxable loss
- −$2,493
- Est. tax savings @ 24.0%
- +$598
- After-tax cash flow
- $698/yr
For passive investors: Depreciation is non-cash, so a rental often shows a tax loss while cash-flowing — sheltering income. Rental losses are passive: they offset passive income freely, and up to $25,000/yr can offset ordinary (W-2) income if you actively participate and your MAGI is under $100k (phasing out to $0 by $150k); unused losses carry forward. On sale, claimed depreciation is recaptured at up to 25%, and gains may owe capital-gains tax (a 1031 exchange can defer both). Figures are a year-1 estimate at your 24.0% rate — not tax advice; consult a CPA.
Schools (NCES district)
- District
- Choctaw-Nicoma Park
- NCES district ID
- 4007620
- Math proficiency
- 28% ▼ -10.00%
- Reading proficiency
- 32% ▼ -12.00%
- Median HH income
- $69,072
- Composite
- 28.02/100
- National rank
- #6847
- State rank
- #48 of 270 in OK
Livability — Nicoma Park
- Score
- 66/100
- State rank
- #109
- US rank
- #11551
Category grades
Schools grade is shown separately in the Schools card above.
Census & demographics
- Census place
- Nicoma Park, OK
- County
- Oklahoma County · 771,644 people
- Metro
- Oklahoma City, OK
- Population (ZIP)
- 21,476
- Household income
- $71,189
- Rent vs Own
- Severe rent burden
- 378.0
Population outlook (Oklahoma County) Hauer SSP2
- Today (2025)
- 911,875 people
- By 2030
- 982,413 · +7.7%
- By 2040
- 1,130,468 · +24.0%
- By 2050
- 1,288,422 · +41.3%
- By 2075
- 1,711,482 · +87.7%
- By 2100
- 2,088,448 · +129.0%
Race, ethnicity, and origin ACS 2023
- Neighborhood character
- Diverse neighborhood (Simpson 0.60)
- Race & ethnicity
- White 60% Black 18% Two or more races 14% Hispanic / Latino 7% Asian 2% Native American 2%
- Hispanic origin (detail)
- Mexican 6%
- Common ancestry
- Lithuanian 2% Slovak 2% Italian 2%
- Foreign-born
- 3% · Canada
- Languages at home
- 95% English-only · Spanish 3% Tagalog/Filipino 1%
Political lean MEDSL · Oklahoma
- 2024 margin
- Toss-up / Even · D 48.0% · R 49.7% · Other 2.3%
- 2008→2024 swing
- +15.1pp toward D · 2008: -16.8pp · 2024: -1.7pp
- All cycles
- 2024: R+1.7 2020: R+1.1 2016: R+10.5 2012: R+16.7 2008: R+16.8
Not yet ingested
- Civics
- —
Market trends
- HPI YoY
- ▼ -65.22%
- Current HPI
- 245.8385
- Rent YoY
- ▲ 5.73%
- Metro
- Oklahoma City, OK
- State GDP YoY
- ▲ 1.55%
- F500 in state
- 6
Industry mix (Fortune 500 HQ in OK)
| Industry | F500 HQs | Revenue |
|---|---|---|
| Energy | 3 | $48B |
|
||
Price history
1 event — show timeline
- 2026-05-28 Listed $150,000 MLSOK
Property tax history
+4.6%/yrLatest (2025): $1,308 · +5.8% YoY. Source: county tax records.
Cash-flow waterfall
monthlySold comps — $/sqft
last 12 mo · ≤1 miLoading sold comps…