2776 Center St · Stevinson, CA
Flood risk 1/10 · Minimal
- FEMA flood zone
- X (unshaded)
- Chance of flooding over 30 yrs
- 0.0%
- Est. flood insurance / yr
- $507 – $1,088
Fire risk 7/10 · Major
- Est. fire insurance / yr
- $659 – $1,223
Heat risk 7/10 · Major
- Hot days now (above 104°F)
- 7 days/yr
- Hot days in 30 yrs
- 16 days/yr
Wind risk 1/10 · Minimal
- Chance of severe wind over 30 yrs
- —
Air-quality risk 10/10 · Severe
- Unhealthy air days now
- 28 days/yr
- Unhealthy air days in 30 yrs
- 29 days/yr
Risk factors via First Street. Map © Google.
Why this score? — see what drove the C- grade
The composite is a weighted blend of 9 inputs, each scored 0–100. Each bar is that input's sub-score; the figure is the points it added to the 100-point composite (weight × sub-score).
- Cash flow +19.5/30.0
- ARV discount +7.5/15.0
- DSCR +6.2/10.0
- 1% rule +4.6/10.0
- Appreciation +4.5/10.0
- Schools +3.3/10.0
- Rent growth +2.5/5.0
- Condition / age +2.5/5.0
- Livability +1.6/5.0
$125,000
🖨 Deal sheet (PDF) 📄 Offer letter ✓ Due diligence
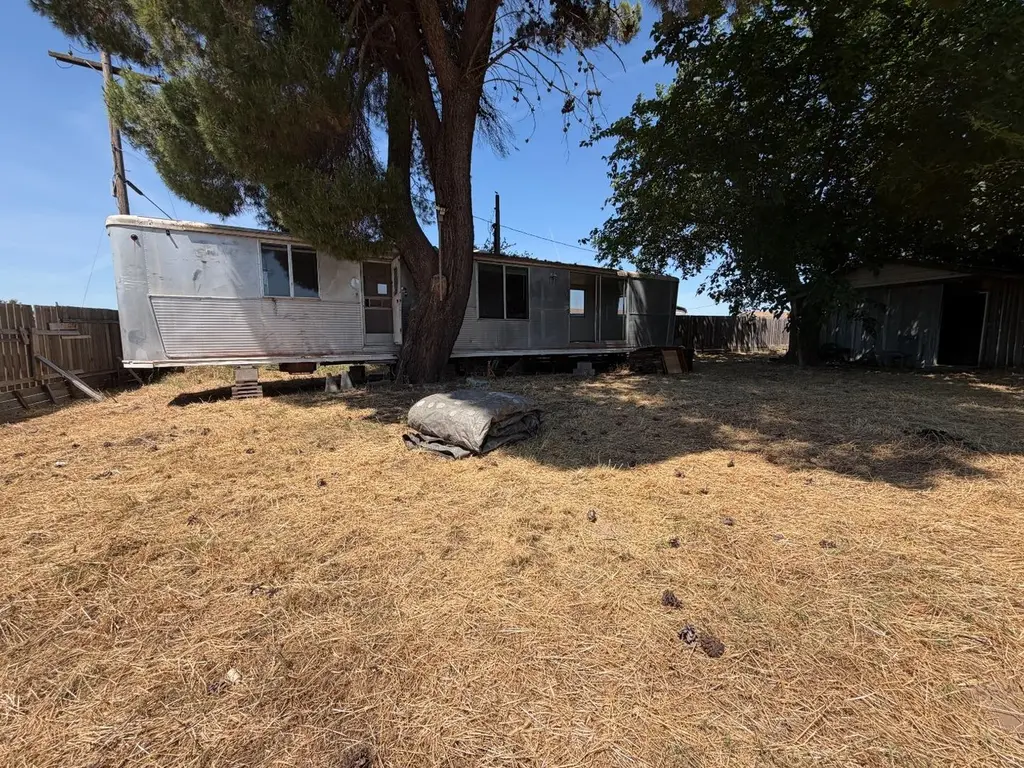
Listing remarks MLS
Little Parcel with Lots of Potential! Located in the peaceful agricultural community of Stevinson, this 8,212-square-foot parcel offers both charm and opportunity. The property features an existing well and septic system that the county has indicated to the seller may support a one-bedroom residence. A vintage trailer/Mobile needing lots of TLC sits on site that is ready for somebody with the right vision. Registration is in hand for Mobile Home with serial numbers and decal. A small shed was being converted for use but was never finished, and building supplies remain for the next owner to complete or repurpose. There is temporary electric box on a pole on site, though it will likely require a new panel and is not hooked up. This property is ready for a buyer looking for a project and a little place to call home in one of the Central Valleys most down-to-earth, rural towns.
Key facts
- Small shed
- Existing well
- Septic system
Tags
Property features AI
Finance
- Other: Park home serial number: 9500110136; Property primary ID: 746104
- Financial info: Local property tax (LPT)
Exterior
- Parking: No designated parking spaces listed; Owned park home site (space owned)
- Utilities: Well water; Existing septic; Public utilities available; Power on pole
- Home design: 500 living area (approx.)
- Exterior features: Other roof (see remarks)
Interior
- Bedrooms: 1 bedroom
- Flooring: Carpet; Laminate
- Bathrooms: 1 full bathroom
- Interior features: Carpet and laminate flooring; Dining bar
Neighborhood map
What this means for you Summary
Snapshot
- This is a 1-bed/1.0-bath single-family listed at $125k.
Deal economics
- At list price, monthly cash flow is $142 ($2k/yr) — positive.
- The deal already cash-flows at list — no discount required.
- To meet the 1% rule (rent ≥ 1% of price), the offer needs to be $120k (4.0% below list).
- Recommended offer: $120k (4.0% below list) — sets the bar for 1% rule.
Location & tenants
- Location reads 32/100 on livability (#1,458 in CA) — a limited-amenity area; tenant pool skews transient or value-seeking. Strengths: crime A; Watch: schools F, amenities F, commute F.
- Hilmar Unified (rural): math 26% / reading 43% proficiency, ranked #890 of 1,400 in CA (top 64%) — families likely to look elsewhere, expect single-tenant / working-renter base with shorter leases.
- Market conditions: 9 active listings in the ZIP; 1 comparable units currently listed for rent nearby; 459 units permitted in Merced County in 2024 (0 in 5+ unit buildings).
Forward outlook
- Local home prices are declining (-1.0%/yr); year-one equity from $864 of loan paydown is wiped out by about $1k of value loss. Plan a longer hold.
- Merced County population projected at +12% by 2050 — modest demand growth; plan on rents tracking national, not racing it.
Negotiation context
- Only 6 days on market — expect competitive offers; lowballing is unlikely to land.
- 5 sale attempts with the ask held roughly flat each time — persistent listings suggest the price (not the market) is what's stuck; bring a comps-based counter.
- Current owner paid $100k; 25% above their basis — modest negotiation headroom, anchor on the comps not their cost.
Risks & watch-outs
- Watch-outs: built in 1959 — expect roof / HVAC / electrical / plumbing capex.
- Climate carrying-cost: major wildfire risk; extreme-heat days projected 7→16/yr by 2055 (HVAC capex compounding) — expect insurance premiums to compound above CPI over the hold.
Questions for the listing agent
- Built in 1959 — when were the roof, HVAC, electrical panel, plumbing, and water heater last replaced?
- Is there a deadline driving the sale (1031 exchange, divorce, estate, relocation)? That informs how much negotiation room exists.
- Schools are F-rated, which usually means shorter tenancies and higher turnover. Who's the typical renter profile here, and what's been the actual vacancy rate?
- What's the average days-on-market for RENTAL listings here right now (not sales)? A rising rental-DOM trend means longer vacancies and softer asking-rent achievability than the comps imply.
- What's the recent tenant-quality profile in this submarket — average credit score on applications, eviction rate, late-payment / NSF rate, and stable-employment percentage? A property-management company in the area should have these aggregated.
- How much new for-sale + rental construction is in the pipeline within 1–3 miles? Heavy new supply typically softens prices + rents 12–24 months out; constrained supply supports both.
Investment metrics
- 1% rule
- 0.96% ✗
- Cap rate
- 7.66%
- Cash-on-cash
- 4.87%
- DSCR
- 1.22
- GRM
- 8.7
CMA / ARV
No comps found within radius.
Projected returns pro-forma
-0.98% appreciation · 3.0% rent growth · sell at horizon
- IRR
- -0.2%
- Equity multiple
- 0.99×
- Total profit
- $-248
- Equity at exit
- $30,309
- IRR
- 6.4%
- Equity multiple
- 1.62×
- Total profit
- $21,684
- Equity at exit
- $31,942
Cash invested: $35,000 (down + closing). Projections, not guarantees.
Landlord ↔ Tenant lean methodology
- Overall (STATE)
- 18 Strongly Tenant-Friendly
- State California
- 18 Strongly Tenant-Friendly · D+13
- County
- — inherits STATE
- City
- — inherits STATE
ZIP-level market 95374
- Home prices YoY
- -0.8%
- Active inventory
- 9
- Price-to-rent
- 8.7×
Monthly cashflow live
- Estimated rent
- $1,200 medium interval (Pro) →
- Mortgage (P&I)
- −$656
- Tax from tax record
- −$98 /mo · $1,179/yr
- Insurance
- −$52
- HOA
- −$0
- Vacancy / Maint / Mgmt
- −$252
- Net cashflow
- $142
Break-even live
Sensitivity live
| Price | -10% $213 | -5% $178 | +0% $142 | +5% $107 | +10% $71 |
|---|---|---|---|---|---|
| Rent | -10% $47 | -5% $95 | +0% $142 | +5% $190 | +10% $237 |
| Rate | -1.0pp $205 | -0.5pp $174 | base $142 | +0.5pp $110 | +1.0pp $77 |
UW: 25.0% down · 7.5% · 30yr · 1.5% tax · 5.0% vac · 8.0% maint · 8.0% mgmt
Financing live
Cash to close
- Down payment
- $31,250
- Closing costs
- $3,750
- Reserves months
- —
- Total cash needed
- —
Loan-product check · same deal, 3 products live
Conventional
25% down · 7.5% · 30yr
- Down + closing
- —
- Monthly P&I
- —
- Monthly cashflow
- —
- DSCR
- —
- Eligible?
- —
Personal DTI + credit; lowest rate.
DSCR
20% down · 8.5% · 30yr
- Down + closing
- —
- Monthly P&I
- —
- Monthly cashflow
- —
- DSCR
- —
- Eligible?
- —
No personal income docs; deal must DSCR.
Hard money
10% down · 12.0% · 12mo
- Down + closing
- —
- Monthly P&I
- —
- Monthly cashflow
- —
- DSCR
- —
- Eligible?
- —
Short-term bridge; refi at stabilization.
Rent comps 1 comps
| Address | Beds | Baths | Sqft | Rent | $/sqft | DOM | Units | Dist |
|---|---|---|---|---|---|---|---|---|
| 20096 Enid St Stevinson, CA | 1.0 | 1.0 | 600 | $1,200 | $2.00 | 8d | 1 | 0.18mi |
Listing history 14 events
-
2026-06-18days on market $125,000 Active 6 DOM
-
2026-06-17days on market $125,000 Active 5 DOM
-
2026-06-16days on market $125,000 Active 4 DOM
-
2026-06-15days on market $125,000 Active 3 DOM
-
2026-06-13pricedays on market $125,000 Active 1 DOM
-
2026-06-10days on market $165,000 Active 12 DOM
-
2026-06-09days on market $165,000 Active 11 DOM
-
2026-06-08days on market $165,000 Active 10 DOM
-
2026-06-07days on market $165,000 Active 9 DOM
-
2026-06-02days on market $165,000 Active 4 DOM
-
2026-06-01days on market $165,000 Active 3 DOM
-
2026-05-31days on market $165,000 Active 2 DOM
-
2026-05-30remarks 699-char remark
-
2026-05-30$165,000 Active 1 DOM
ⓘ Source: listings_history table (triggers on properties + properties_extension) + one-shot
backfill from property_details.listing_events for pre-trigger history.
Tax reassessment forecast CA · Resets to sale price
- Current annual tax
- $1,179 · $98/mo
- Projected year-2 tax
- $1,179 · $98/mo
- Expected delta
- $0/yr ($0/mo · 0.0%)
ⓘ Screening estimate from a state-policy table — verify with the county assessor before closing.
Climate risk First Street
- Flood 1/10 Low FEMA zone X (unshaded) · 0% chance over 30 yrs
- Wildfire 7/10 Severe
- Heat 7/10 Severe 7 d/yr ≥104°F today · 16 d/yr by 30 yrs out
- Wind 1/10 Low
- Air quality 10/10 Extreme 28 unhealthy d/yr today · 29 by 30 yrs out
Nearby sold comps map
Loading sold comps map…
Walkable amenities ~0.75 mi
Loading nearby amenities…
Taxation est. · year 1
- Rental income
- $14,400
- − Mortgage interest
- −$7,002
- − Property taxes
- −$1,179
- − Insurance
- −$625
- − Repairs & maintenance
- −$1,152
- − Management
- −$1,152
- − Depreciation
- −$3,636
- Taxable loss
- −$346
- Est. tax savings @ 24.0%
- +$83
- After-tax cash flow
- $1,789/yr
For passive investors: Depreciation is non-cash, so a rental often shows a tax loss while cash-flowing — sheltering income. Rental losses are passive: they offset passive income freely, and up to $25,000/yr can offset ordinary (W-2) income if you actively participate and your MAGI is under $100k (phasing out to $0 by $150k); unused losses carry forward. On sale, claimed depreciation is recaptured at up to 25%, and gains may owe capital-gains tax (a 1031 exchange can defer both). Figures are a year-1 estimate at your 24.0% rate — not tax advice; consult a CPA.
Schools (NCES district)
- District
- Hilmar Unified
- NCES district ID
- 0617220
- Math proficiency
- 26% ▲ 7.00%
- Reading proficiency
- 43% ▲ 8.00%
- Median HH income
- $52,781
- Composite
- 32.82/100
- National rank
- #10742
- State rank
- #890 of 1400 in CA
Livability — Stevinson
- Score
- 32/100
- State rank
- #1458
- US rank
- #27853
Category grades
Schools grade is shown separately in the Schools card above.
Census & demographics
- Census place
- Stevinson, CA
- Population (ZIP)
- 1,652
Population outlook (Merced County) Hauer SSP2
- Today (2025)
- 285,501 people
- By 2030
- 293,437 · +2.8%
- By 2040
- 308,808 · +8.2%
- By 2050
- 321,011 · +12.4%
- By 2075
- 338,497 · +18.6%
- By 2100
- 330,493 · +15.8%
Race, ethnicity, and origin ACS 2023
- Neighborhood character
- Majority Hispanic (55%)
- Race & ethnicity
- Hispanic / Latino 55% White 43% Two or more races 16% Asian 2%
- Hispanic origin (detail)
- Mexican 53%
- Common ancestry
- Russian 10%
- Foreign-born
- 26% · Canada
- Languages at home
- 50% English-only · Spanish 44% Other Indo-European 5%
Political lean MEDSL · Merced
- 2024 margin
- Toss-up / Even · D 46.5% · R 50.9% · Other 2.6%
- 2008→2024 swing
- -12.7pp toward R · 2008: 8.3pp · 2024: -4.4pp
- All cycles
- 2024: R+4.4 2020: D+10.6 2016: D+7.9 2012: D+5.4 2008: D+8.3
Not yet ingested
- Civics
- —
Market trends
- HPI YoY
- ▼ -0.98%
- Current HPI
- 118.6921
- Rent YoY
- —
- Metro
- —
- State GDP YoY
- ▲ 3.21%
- F500 in state
- 116
Industry mix (Fortune 500 HQ in CA)
| Industry | F500 HQs | Revenue |
|---|---|---|
| Technology | 27 | $1,492B |
|
||
| Financial Services | 3 | $174B |
|
||
| Retail | 3 | $44B |
|
||
| Insurance | 3 | $26B |
|
||
| Media / Entertainment | 2 | $115B |
|
||
| Pharmaceuticals / Biotech | 2 | $62B |
|
||
Price history
+25.0% since first listed9 events — show timeline
- 2026-06-12 Listed $125,000 MLSListings
- 2026-06-12 Price Changed $125,000 bridgeMLS, Bay East AOR, or Contra Costa AOR
- 2026-06-12 Price Changed $125,000 MLSListings
- 2026-06-12 Listed $125,000 bridgeMLS, Bay East AOR, or Contra Costa AOR
- 2026-05-29 Listed $165,000 MLSListings
- 2026-05-29 Listed $165,000 bridgeMLS, Bay East AOR, or Contra Costa AOR
- 2026-04-03 Listing Removed — bridgeMLS, Bay East AOR, or Contra Costa AOR
- 2025-11-10 Listed — bridgeMLS, Bay East AOR, or Contra Costa AOR
- 2023-08-17 Sold (Public Records) $100,000 Public Records
Property tax history
+8.3%/yrLatest (2025): $1,179 · +5.2% YoY. Source: county tax records.
Cash-flow waterfall
monthlySold comps — $/sqft
last 12 mo · ≤1 miLoading sold comps…