 Duplex
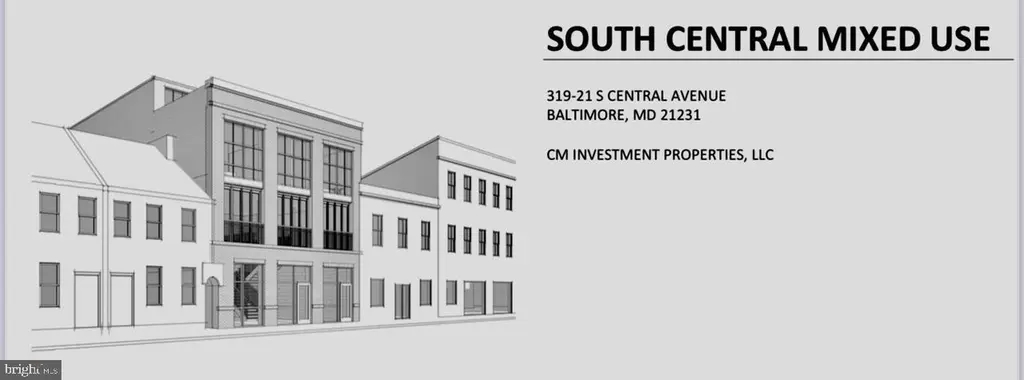
319-321 S Central Ave · Baltimore, MD
Flood risk No data
- FEMA flood zone
- —
- Chance of flooding over 30 yrs
- —
- Est. flood insurance / yr
- —
Fire risk No data
- Est. fire insurance / yr
- —
Heat risk No data
- Hot days now (above threshold)
- —
- Hot days in 30 yrs
- —
Wind risk No data
- Chance of severe wind over 30 yrs
- —
Air-quality risk No data
- Unhealthy air days now
- —
- Unhealthy air days in 30 yrs
- —
Risk factors via First Street. Map © Google.
Why this score? — see what drove the C+ grade
The composite is a weighted blend of 9 inputs, each scored 0–100. Each bar is that input's sub-score; the figure is the points it added to the 100-point composite (weight × sub-score).
- Cash flow +23.9/30.0
- ARV discount +15.0/15.0
- DSCR +7.7/10.0
- 1% rule +5.7/10.0
- Livability +3.8/5.0
- Rent growth +2.6/5.0
- Condition / age +2.5/5.0
- Schools +1.0/10.0
- Appreciation +0.0/10.0
$399,000
🖨 Deal sheet 📄 Offer letter ✓ Due diligence
Multi-family units
County records classify this as Multi-Family (2-4 Unit). Listing-text estimate: 2 units. confirmed
Listing remarks MLS
Welcome to 319-321 South Central Ave! Resting next to historic Little Italy and the vibrant & bustling Harbor East communities, you’ll find this redevelopment property offers a prime location with a very high traffic count! Approved mixed use plans along with costing are available upon request. This project is ready for permits and zoning is flexible with numerous uses. This amazing opportunity is located directly across the street from the wildly successful Canal Street Malt House redevelopment property. Schedule your showing today. Offered at $399,000
Key facts
- 2,614 sq ft lot
- Built 1920
- Listed 84 days
Neighborhood map
What this means for you Summary
Snapshot
- This is a 2 × 2-bed/?-bath units multifamily listed at $399k.
Deal economics
- At list price, monthly cash flow is $774 ($9k/yr) — positive. Per door: $387/mo.
- The deal already cash-flows at list — no discount required.
- Meets the 1% rule at list price ($4k rent vs $399k).
- Recommended offer: $375k (6.0% below list) — sets the bar for market timing.
- Cap rate 8.6% vs local median 6.0% in Baltimore — top-decile yield for the area; either an underpriced asset or a hidden risk that comps aren't pricing in. Stress-test before assuming the spread holds.
Location & tenants
- Location reads 76/100 on livability (#90 in MD, #3,396 nationally) — a middle-class / working-renter tenant base. Strengths: amenities A+, commute A+, housing A+; Watch: schools D, crime F.
- Baltimore City Public Schools (urban): math 7% / reading 16% proficiency, ranked #24 of 24 in MD (top 100%) — low school quality limits family demand, transient renter base, plan for 1-2y turnover; 79% free/reduced lunch — lower-income household profile, screen leases tightly.
- Market conditions: Rents flat; 134 active listings in the ZIP; 40 comparable units currently listed for rent nearby; rentals at typical pace (median 22d on market — plan ~3-4 weeks tenant-placement turnaround); 1,273 units permitted in Baltimore city in 2024 (1,104 in 5+ unit buildings).
- At $4,253/mo this rent would consume 86% of the median local household income ($59k/yr) (locally 1863% of renters already pay >50% of income on rent) — very limited rent-growth headroom before tenants either downsize or default.
Forward outlook
- Local home prices are declining (-3.0%/yr); year-one equity from $3k of loan paydown is wiped out by about $12k of value loss. Plan a longer hold.
- Baltimore County population projected to shrink 4% by 2050 — rents likely to lag national; underwrite the cash flow, not the appreciation.
Negotiation context
- It's been on market 84 days — a 6% lower offer ($375k) is reasonable based on typical stale-listing flexibility.
- 4 sale attempts since 20y ago with the ask held roughly flat each time — persistent listings suggest the price (not the market) is what's stuck; bring a comps-based counter.
- Current owner paid $54k; list at $399k implies a 639% gain — meaningful room to come down on a strong offer.
Risks & watch-outs
- Watch-outs: built in 1920 — expect roof / HVAC / electrical / plumbing capex.
Questions for the listing agent
- It's been on market 84 days. Have you received any prior offers? Is the seller open to a 6% concession, seller financing, or rate buy-down credit?
- Can we see the unit-by-unit rent roll, current vacancy, and any below-market leases? What's the average tenancy length?
- What capital expenditures (roof, boiler, parking lot, exteriors) have been made in the last 5 years, and what's planned in the next 2?
- Built in 1920 — when were the roof, HVAC, electrical panel, plumbing, and water heater last replaced?
- Why hasn't it sold? Are there any deal-killer items the seller is aware of (foundation, flood, title, zoning, code violations)?
- Is there a deadline driving the sale (1031 exchange, divorce, estate, relocation)? That informs how much negotiation room exists.
- Schools are D-rated, which usually means shorter tenancies and higher turnover. Who's the typical renter profile here, and what's been the actual vacancy rate?
- Crime grade is F in this area — have there been break-ins, vandalism, or insurance claims at this property in the last 3 years? What carrier currently insures it and at what premium?
- What's the average days-on-market for RENTAL listings here right now (not sales)? A rising rental-DOM trend means longer vacancies and softer asking-rent achievability than the comps imply.
- What's the recent tenant-quality profile in this submarket — average credit score on applications, eviction rate, late-payment / NSF rate, and stable-employment percentage? A property-management company in the area should have these aggregated.
- How much new apartment / multifamily construction is in the pipeline within 1–3 miles? Heavy new supply (>2% of stock underway) typically softens rents 12–24 months out; light construction supports rent growth.
Investment metrics
- 1% rule
- 1.07% ✓
- Cap rate
- 8.62%
- Cash-on-cash
- 8.32%
- DSCR
- 1.37
- GRM
- 7.8
CMA / ARV
- ARV (median comp)
- $523,584
- List price
- $399,000
- Delta
- -23.79%
- Verdict
- UNDERPRICED
- Comps
- 17 within 1.0 mi
Show comp detail 4 sales within ~0.75 mi
| Address | Dist | Beds/Ba | Sqft | Sold | Price | $/sf | Match |
|---|---|---|---|---|---|---|---|
| 521 S Wolfe St | 0.51mi | 4/— | 1,600 (+4%) | 12mo | $560,000 | $350 | 60 |
| 1709 Bank St | 0.33mi | 3/2.0 (-1) | 1,362 (-12%) | 6mo | $415,000 | $305 | 51 |
| 512 S Washington St | 0.55mi | 4/— | 1,760 (+14%) | 11mo | $427,500 | $243 | 42 |
| 1820 Fleet St | 0.48mi | 3/— (-1) | 1,752 (+14%) | 14mo | $515,000 | $294 | 38 |
Match score weights: distance 35% · size 25% · config 20% · recency 20%. Top-matched comps best support the ARV.
Projected returns pro-forma
-3.0% appreciation · 0.59% rent growth · sell at horizon
- IRR
- -6.3%
- Equity multiple
- 0.77×
- Total profit
- $-25,460
- Equity at exit
- $59,492
- IRR
- 0.3%
- Equity multiple
- 1.02×
- Total profit
- $1,776
- Equity at exit
- $34,498
Cash invested: $111,720 (down + closing). Projections, not guarantees.
Landlord ↔ Tenant lean methodology
- Overall (CITY)
- 12 Strongly Tenant-Friendly
- State Maryland
- 27 Tenant-Leaning · D+14
- County
- — inherits STATE
- City Baltimore
- 12 Strongly Tenant-Friendly · D+58
ZIP-level market 21202
- Home prices YoY
- -8.0%
- Rents YoY
- 0.6%
- Active inventory
- 134
- Price-to-rent
- 15.6×
Monthly cashflow live
- Estimated rent
- $4,253 high interval (Pro) →
- Mortgage (P&I)
- −$2,092
- Tax from tax record
- −$327 /mo · $3,925/yr
- Insurance
- −$166
- HOA
- −$0
- Vacancy / Maint / Mgmt
- −$893
- Net cashflow
- $774
Break-even live
2-unit breakdown (identical units grouped — click to expand)
| Units | Beds | Baths | Est. rent |
|---|---|---|---|
| 2× units | 2 | — | $4,252 |
| #1 | 2 | — | $2,126 |
| #2 | 2 | — | $2,126 |
| Total (2 units) | $4,253 | ||
UW: 25.0% down · 7.5% · 30yr · 1.5% tax · 5.0% vac · 8.0% maint · 8.0% mgmt
Financing live
Cash to close
- Down payment
- $99,750
- Closing costs
- $11,970
- Reserves months
- —
- Total cash needed
- —
Loan-product check · same deal, 3 products live
Conventional
25% down · 7.5% · 30yr
- Down + closing
- —
- Monthly P&I
- —
- Monthly cashflow
- —
- DSCR
- —
- Eligible?
- —
Personal DTI + credit; lowest rate.
DSCR
20% down · 8.5% · 30yr
- Down + closing
- —
- Monthly P&I
- —
- Monthly cashflow
- —
- DSCR
- —
- Eligible?
- —
No personal income docs; deal must DSCR.
Hard money
10% down · 12.0% · 12mo
- Down + closing
- —
- Monthly P&I
- —
- Monthly cashflow
- —
- DSCR
- —
- Eligible?
- —
Short-term bridge; refi at stabilization.
Rent comps 40 comps
| Address | Beds | Baths | Sqft | Rent | $/sqft | DOM | Units | Dist |
|---|---|---|---|---|---|---|---|---|
| 424 S Eden St Baltimore, MD | 4.0 | 3.5 | 1830 | $3,200 | $1.75 | 24d | 1 | 0.09mi |
| 430 S Bond St Baltimore, MD | 3.0 | 2.5 | 1842 | $2,875 | $1.56 | 18d | 1 | 0.21mi |
| 555 President St Baltimore, MD | 3.0 | 1.0–4.0 | 1352 | $5,373 | $3.97 | 2d | 1 | 0.23mi |
| 706 S Bethel St Baltimore, MD | 3.0 | 2.0 | 1500 | $3,300 | $2.20 | 44d | 1 | 0.36mi |
| 104 N Dallas St Baltimore, MD | 3.0 | 2.5 | 1584 | $2,500 | $1.58 | 22d | 1 | 0.40mi |
| 1802 Gough St Baltimore, MD | 3.0 | 2.0 | 1368 | $2,595 | $1.90 | 44d | 1 | 0.41mi |
| 1816 Gough St Baltimore, MD | 4.0 | 2.0 | 1248 | $3,500 | $2.80 | 24d | 1 | 0.43mi |
| 1818 E Pratt St Apt A Baltimore, MD | 3.0 | 2.5 | 1736 | $2,500 | $1.44 | 18d | 1 | 0.46mi |
| 1402 Point St Baltimore, MD | 2.0–3.0 | 2.5–3.0 | 1470 | $5,730 | $3.90 | 3d | 3 | 0.46mi |
| 1904 Bank St Baltimore, MD | 3.0 | 3.5 | 1792 | $3,250 | $1.81 | 44d | 1 | 0.48mi |
| 1911 Eastern Ave Baltimore, MD | 4.0 | 4.0 | 1520 | $2,600 | $1.71 | 24d | 1 | 0.51mi |
| 414 Water St Baltimore, MD | 1.0–3.0 | 1.0–2.5 | 751 | $3,600 | $4.79 | 3d | 7 | 0.57mi |
| 414 Water St Baltimore, MD | 1.0–3.0 | 1.0–2.5 | 751 | $3,600 | $4.79 | 2d | 6 | 0.57mi |
| 2013 Fleet St Baltimore, MD | 3.0 | 2.5 | 1565 | $3,100 | $1.98 | 13d | 1 | 0.60mi |
| 513 S Chester St Baltimore, MD | 4.0 | 4.5 | 1534 | $3,000 | $1.96 | 18d | 1 | 0.66mi |
| 2015 E Fairmount Ave Baltimore, MD | 3.0 | 3.5 | 1402 | $2,500 | $1.78 | 44d | 1 | 0.67mi |
| 624 Stirling St Baltimore, MD | 4.0 | 3.0 | 1812 | $2,450 | $1.35 | 44d | 1 | 0.76mi |
| 2115 E Fairmount Ave Baltimore, MD | 3.0 | 2.5 | 1736 | $2,795 | $1.61 | 24d | 1 | 0.77mi |
| 1418 E Monument St Baltimore, MD | 2.0–4.0 | 1.0–2.0 | 1265 | $1,920 | $1.52 | 15d | 5 | 0.77mi |
| 107 N Chester St Unit 2 Baltimore, MD | 3.0 | 1.0 | 1750 | $2,750 | $1.57 | 44d | 1 | 0.77mi |
| 2210 Cambridge St Baltimore, MD | 3.0 | 3.5 | 1450 | $2,725 | $1.88 | 44d | 1 | 0.78mi |
| 100 E Redwood St Baltimore, MD | 3.0 | 1.0–2.0 | 950 | $4,751 | $5.00 | 2d | 23 | 0.78mi |
| 2217 Fleet St Baltimore, MD | 3.0 | 2.0 | 1598 | $2,700 | $1.69 | 11d | 1 | 0.78mi |
| 301 Warren Ave Baltimore, MD | 1.0–3.0 | 1.0–2.5 | 1533 | $3,865 | $2.52 | 2d | 9 | 0.81mi |
| 22 Light St Baltimore, MD | 2.0–3.0 | 1.0–2.0 | 956 | $1,395 | $1.46 | 3d | 1 | 0.81mi |
| 2040 Orleans St Baltimore, MD | 4.0 | 1.5 | 1974 | $2,100 | $1.06 | 15d | 1 | 0.83mi |
| 351 Greenmount Ave Baltimore, MD | 3.0 | 1.5 | 1616 | $1,850 | $1.14 | 44d | 1 | 0.85mi |
| 1226 E Madison St Baltimore, MD | 3.0 | 1.0 | 1100 | $2,179 | $1.98 | 4d | 1 | 0.86mi |
| 2242 E Fairmount Ave Baltimore, MD | 3.0 | 2.0 | 1345 | $2,850 | $2.12 | 44d | 1 | 0.86mi |
| 2313 Foster Ave Baltimore, MD | 3.0 | 2.5 | 1974 | $2,900 | $1.47 | 44d | 1 | 0.88mi |
| 2209 Mullikin St Baltimore, MD | 3.0 | 2.5 | 1512 | $1,900 | $1.26 | 4d | 1 | 0.88mi |
| 206 E Cross St Baltimore, MD | 4.0 | 2.0 | 2168 | $3,000 | $1.38 | 4d | 1 | 0.90mi |
| 143 N Patterson Park Ave Baltimore, MD | 4.0 | 3.5 | 1650 | $3,700 | $2.24 | 24d | 1 | 0.91mi |
| 1153 Riverside Ave Baltimore, MD | 4.0 | 2.0 | 1838 | $2,800 | $1.52 | 44d | 1 | 0.91mi |
| 2208 Orleans St Baltimore, MD | 3.0 | 1.0 | 1310 | $1,775 | $1.35 | 44d | 1 | 0.91mi |
| 1232 Ashland Ave Baltimore, MD | 3.0 | 1.0 | 1200 | $1,600 | $1.33 | 22d | 1 | 0.93mi |
| 2317 E Fayette St Baltimore, MD | 3.0 | 1.5 | 1315 | $2,000 | $1.52 | 13d | 1 | 0.93mi |
| 651 E Clement St Baltimore, MD | 3.0 | 3.5 | 1292 | $2,800 | $2.17 | 44d | 1 | 0.94mi |
| 918 N Central Ave Baltimore, MD | 3.0 | 1.0 | 1514 | $1,400 | $0.92 | 15d | 1 | 0.97mi |
| 931 N Central Ave Baltimore, MD | 3.0 | 1.0 | 1085 | $1,400 | $1.29 | 24d | 1 | 0.98mi |
Listing history 24 events
-
2026-06-18days on market $399,000 Active 84 DOM
-
2026-06-17days on market $399,000 Active 83 DOM
-
2026-06-16days on market $399,000 Active 82 DOM
-
2026-06-15days on market $399,000 Active 81 DOM
-
2026-06-13days on market $399,000 Active 79 DOM
-
2026-06-09days on market $399,000 Active 75 DOM
-
2026-06-08days on market $399,000 Active 74 DOM
-
2026-06-07days on market $399,000 Active 73 DOM
-
2026-06-04days on market $399,000 Active 70 DOM
-
2026-06-03days on market $399,000 Active 69 DOM
-
2026-06-02days on market $399,000 Active 68 DOM
-
2026-06-01days on market $399,000 Active 67 DOM
-
2026-05-31days on market $399,000 Active 66 DOM
-
2026-03-26$399,000 Active 571-char remark
Show marketing remark (571 chars)
Welcome to 319-321 South Central Ave! Resting next to historic Little Italy and the vibrant & bustling Harbor East communities, you’ll find this redevelopment property offers a prime location with a very high traffic count! Approved mixed use plans along with costing are available upon request. This project is ready for permits and zoning is flexible with numerous uses. This amazing opportunity is located directly across the street from the wildly successful Canal Street Malt House redevelopment property. Schedule your showing today. Offered at $399,000
-
2010-12-14historical 240-char remark
Show marketing remark (240 chars)
Check out the SIZE and location of these wide shells (package deal with 319 S Central!) Approved zoning and plans. They are only a couple blocks from Inner Harbor/East, Fells Point, across the street from Little Italy and next to Lemongrass
-
2010-12-10soldstatus $54,000 Sold 240-char remark
Show marketing remark (240 chars)
Check out the SIZE and location of these wide shells (package deal with 319 S Central!) Approved zoning and plans. They are only a couple blocks from Inner Harbor/East, Fells Point, across the street from Little Italy and next to Lemongrass
-
2010-12-10soldstatus $54,000
Show marketing remark (240 chars)
Check out the SIZE and location of these wide shells (package deal with 319 S Central!) Approved zoning and plans. They are only a couple blocks from Inner Harbor/East, Fells Point, across the street from Little Italy and next to Lemongrass
-
2010-10-27status Contract 240-char remark
Show marketing remark (240 chars)
Check out the SIZE and location of these wide shells (package deal with 319 S Central!) Approved zoning and plans. They are only a couple blocks from Inner Harbor/East, Fells Point, across the street from Little Italy and next to Lemongrass
-
2010-10-26historical
-
2010-08-11$70,000 Active 240-char remark
Show marketing remark (240 chars)
Check out the SIZE and location of these wide shells (package deal with 319 S Central!) Approved zoning and plans. They are only a couple blocks from Inner Harbor/East, Fells Point, across the street from Little Italy and next to Lemongrass
-
2010-08-10$70,000
-
2006-09-01soldstatus $500,000
-
2006-06-28historical
-
2006-02-06$500,000
ⓘ Source: listings_history table (triggers on properties + properties_extension) + one-shot
backfill from property_details.listing_events for pre-trigger history.
Tax reassessment forecast MD · Partial reset (capped growth)
- Current annual tax
- $3,925 · $327/mo
- Projected year-2 tax
- $4,137 · $345/mo
- Expected delta
- +$212/yr (+$18/mo · 5.4%)
ⓘ Screening estimate from a state-policy table — verify with the county assessor before closing.
Nearby sold comps map
Loading sold comps map…
Walkable amenities ~0.75 mi
Loading nearby amenities…
Taxation est. · year 1
- Rental income
- $51,036
- − Mortgage interest
- −$22,350
- − Property taxes
- −$3,925
- − Insurance
- −$1,995
- − Repairs & maintenance
- −$4,083
- − Management
- −$4,083
- − Depreciation
- −$11,607
- Taxable income
- $2,993
- Est. tax owed @ 24.0%
- −$718
- After-tax cash flow
- $8,572/yr
For passive investors: Depreciation is non-cash, so a rental often shows a tax loss while cash-flowing — sheltering income. Rental losses are passive: they offset passive income freely, and up to $25,000/yr can offset ordinary (W-2) income if you actively participate and your MAGI is under $100k (phasing out to $0 by $150k); unused losses carry forward. On sale, claimed depreciation is recaptured at up to 25%, and gains may owe capital-gains tax (a 1031 exchange can defer both). Figures are a year-1 estimate at your 24.0% rate — not tax advice; consult a CPA.
Schools (NCES district)
- District
- Baltimore City Public Schools
- NCES district ID
- 2400090
- Math proficiency
- 7% ▼ -9.00%
- Reading proficiency
- 16% ▼ -5.00%
- Median HH income
- $42,108
- Composite
- 10.08/100
- National rank
- #9805
- State rank
- #24 of 24 in MD
Livability — Baltimore
- Score
- 76/100
- State rank
- #90
- US rank
- #3396
Category grades
Schools grade is shown separately in the Schools card above.
Census & demographics
- Census place
- Baltimore, MD
- County
- Baltimore City · 558,601 people
- City population
- 588,727
- Metro
- Baltimore-Columbia-Towson, MD
- Population (ZIP)
- 20,683
- Household income
- $59,377
- Rent vs Own
- Severe rent burden
- 1863.0
Population outlook (Baltimore County) Hauer SSP2
- Today (2025)
- 624,249 people
- By 2030
- 621,541 · -0.4%
- By 2040
- 609,756 · -2.3%
- By 2050
- 597,249 · -4.3%
- By 2075
- 552,236 · -11.5%
- By 2100
- 513,934 · -17.7%
Race, ethnicity, and origin ACS 2023
- Neighborhood character
- Diverse neighborhood (Simpson 0.63)
- Race & ethnicity
- Black 52% White 31% Hispanic / Latino 7% Two or more races 6% Asian 5%
- Hispanic origin (detail)
- Mexican 2%
- Common ancestry
- Lithuanian 2% Romanian 2% Slovak 1%
- Foreign-born
- 12% · Canada, South Korea, China
- Languages at home
- 87% English-only · Spanish 4% Other Indo-European 2% Arabic 1%
Political lean MEDSL · Baltimore
- 2024 margin
- Solid D (+73.0) · D 85.2% · R 12.2% · Other 2.6%
- 2008→2024 swing
- -2.5pp toward R · 2008: 75.5pp · 2024: 73.0pp
- All cycles
- 2024: D+73.0 2020: D+76.6 2016: D+74.6 2012: D+76.4 2008: D+75.5
Not yet ingested
- Civics
- —
Market trends
- HPI YoY
- ▼ -25.44%
- Current HPI
- 291.3702
- Rent YoY
- ▲ 0.59%
- Metro
- Baltimore-Columbia-Towson, MD
- State GDP YoY
- ▲ 2.97%
- F500 in state
- 12
Industry mix (Fortune 500 HQ in MD)
| Industry | F500 HQs | Revenue |
|---|---|---|
| Aerospace / Defense | 1 | $71B |
|
||
| Utilities | 1 | $25B |
|
||
| Hotels | 1 | $24B |
|
||
| Consumer Goods | 1 | $7B |
|
||
| Real Estate | 1 | $6B |
|
||
| Chemicals | 1 | $2B |
|
||
Price history
-20.2% since first listed11 events — show timeline
- 2026-03-26 Listed $399,000 BRIGHT MLS
- 2010-12-14 Delisted — MRIS
- 2010-12-10 Sold (MLS) $54,000 BRIGHT MLS
- 2010-12-10 Sold (MLS) $54,000 MRIS
- 2010-10-27 Pending — MRIS
- 2010-10-26 Listing Removed — BRIGHT MLS
- 2010-08-11 Listed $70,000 MRIS
- 2010-08-10 Listed $70,000 BRIGHT MLS
- 2006-09-01 Sold (MLS) $500,000 MRIS
- 2006-06-28 Delisted — MRIS
- 2006-02-06 Listed $500,000 MRIS
Cash-flow waterfall
monthlySold comps — $/sqft
last 12 mo · ≤1 miLoading sold comps…