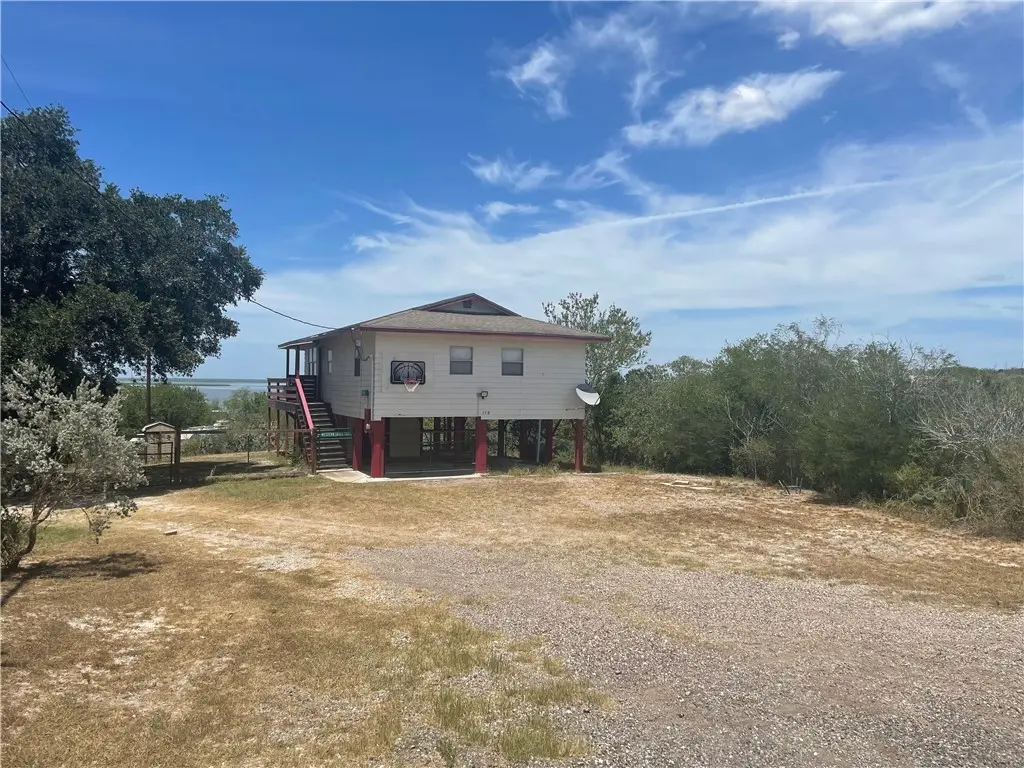
118 E Lake View Trl · Sandia, TX
Flood risk 1/10 · Minimal
- FEMA flood zone
- X (unshaded)
- Chance of flooding over 30 yrs
- 0.0%
- Est. flood insurance / yr
- $507 – $1,088
Fire risk 3/10 · Minor
- Est. fire insurance / yr
- $1,222 – $2,270
Heat risk 9/10 · Severe
- Hot days now (above 110°F)
- 7 days/yr
- Hot days in 30 yrs
- 22 days/yr
Wind risk 9/10 · Severe
- Chance of severe wind over 30 yrs
- 99.0%
Air-quality risk 1/10 · Minimal
- Unhealthy air days now
- 0 days/yr
- Unhealthy air days in 30 yrs
- 0 days/yr
Risk factors via First Street. Map © Google.
Why this score? — see what drove the D+ grade
The composite is a weighted blend of 9 inputs, each scored 0–100. Each bar is that input's sub-score; the figure is the points it added to the 100-point composite (weight × sub-score).
- Cash flow +16.7/30.0
- ARV discount +11.7/15.0
- DSCR +5.2/10.0
- Schools +4.8/10.0
- 1% rule +3.7/10.0
- Livability +2.7/5.0
- Rent growth +2.5/5.0
- Condition / age +2.5/5.0
- Appreciation +0.0/10.0
$145,000
🖨 Deal sheet (PDF) 📄 Offer letter ✓ Due diligence
Listing remarks MLS
Lake Corpus Christi Views – Sandia, TX Escape to the lake with this charming 2-bedroom, 1-bath home featuring a spacious bonus room, perfect for guests, a game room, or office space. Situated on a ¼-acre fully fenced lot in the Pernitas Point Subdivision, this home offers beautiful water views and is located just minutes from the neighborhood boat ramp. Enjoy a large parking area with an RV hookup, making it ideal for hosting get-togethers or storing your outdoor toys. With quick access to fishing, boating, and lake adventures, this property is perfect as a weekend getaway, investment property, or short-term rental. Experience laid-back lake life in Sandia—schedule your showing today!
Key facts
- Fully fenced lot
- Large parking area
- Rv hookup
Tags
Neighborhood map
What this means for you Summary
Snapshot
- This is a 2-bed/1.0-bath single-family listed at $145k.
Deal economics
- At list price, monthly cash flow is $90 ($1k/yr) — positive.
- The deal already cash-flows at list — no discount required.
- To meet the 1% rule (rent ≥ 1% of price), the offer needs to be $126k (13.0% below list).
- Recommended offer: $126k (13.0% below list) — sets the bar for 1% rule.
Location & tenants
- Location reads 54/100 on livability (#1,389 in TX) — a working-class tenant base; expect higher turnover. Strengths: cost of living A+, crime A; Watch: health & safety C-, amenities F, commute F.
- George West ISD (rural): math 55% / reading 59% proficiency, ranked #95 of 826 in TX (top 12%) — acceptable for families but not a draw, mixed tenant base, ~2y average lease.
- Zoned schools: George West Pri (math 67% / reading 77%, grade A-, #110 of 4,322 statewide, top 3%, 396 students, 68% FRL); George West El (math 51% / reading 53%, grade C+, #301 of 1,662 statewide, top 19%, 249 students, 64% FRL); George West H S (math 52% / reading 62%, grade C, #333 of 1,632 statewide, top 22%, 280 students, 58% FRL).
- Market conditions: 119 active listings in the ZIP; 12 units permitted in Live Oak County in 2024 (0 in 5+ unit buildings).
Forward outlook
- Local home prices are declining (-3.0%/yr); year-one equity from $1k of loan paydown is wiped out by about $4k of value loss. Plan a longer hold.
- Live Oak County population projected at +33% by 2050 — long-run rental-demand tailwind backs the buy-and-hold thesis.
Negotiation context
- It's been on market 109 days — a 9% lower offer ($132k) is reasonable based on typical stale-listing flexibility.
- 3 sale attempts since 21y ago with the ask held roughly flat each time — persistent listings suggest the price (not the market) is what's stuck; bring a comps-based counter.
Risks & watch-outs
- Climate carrying-cost: severe wind risk, 99% chance of damaging wind over 30y; extreme-heat days projected 7→22/yr by 2055 (HVAC capex compounding) — expect insurance premiums to compound above CPI over the hold.
Questions for the listing agent
- It's been on market 109 days. Have you received any prior offers? Is the seller open to a 13% concession, seller financing, or rate buy-down credit?
- Why hasn't it sold? Are there any deal-killer items the seller is aware of (foundation, flood, title, zoning, code violations)?
- Is there a deadline driving the sale (1031 exchange, divorce, estate, relocation)? That informs how much negotiation room exists.
- Schools are F-rated, which usually means shorter tenancies and higher turnover. Who's the typical renter profile here, and what's been the actual vacancy rate?
- The area grade is low — what's the realistic commute time and amenity access for the typical tenant pool here? Any planned neighborhood developments (good or bad) we should know about?
- What's the average days-on-market for RENTAL listings here right now (not sales)? A rising rental-DOM trend means longer vacancies and softer asking-rent achievability than the comps imply.
- What's the recent tenant-quality profile in this submarket — average credit score on applications, eviction rate, late-payment / NSF rate, and stable-employment percentage? A property-management company in the area should have these aggregated.
- How much new for-sale + rental construction is in the pipeline within 1–3 miles? Heavy new supply typically softens prices + rents 12–24 months out; constrained supply supports both.
Investment metrics
- 1% rule
- 0.87% ✗
- Cap rate
- 7.04%
- Cash-on-cash
- 2.66%
- DSCR
- 1.12
- GRM
- 9.6
CMA / ARV
- ARV (median comp)
- $160,010
- List price
- $145,000
- Delta
- -9.38%
- Verdict
- FAIR
- Comps
- 6 within 1.0 mi
Show comp detail 1 sale within ~0.75 mi
| Address | Dist | Beds/Ba | Sqft | Sold | Price | $/sf | Match |
|---|---|---|---|---|---|---|---|
| 109 Saddle | 0.74mi | 2/1.0 | 768 (-14%) | 14mo | $99,900 | $130 | 32 |
Match score weights: distance 35% · size 25% · config 20% · recency 20%. Top-matched comps best support the ARV.
Projected returns pro-forma
-3.0% appreciation · 3.0% rent growth · sell at horizon
- IRR
- -12.1%
- Equity multiple
- 0.56×
- Total profit
- $-17,797
- Equity at exit
- $21,620
- IRR
- -3.0%
- Equity multiple
- 0.80×
- Total profit
- $-8,269
- Equity at exit
- $12,537
Cash invested: $40,600 (down + closing). Projections, not guarantees.
Landlord ↔ Tenant lean methodology
- Overall (STATE)
- 87 Strongly Landlord-Friendly
- State Texas
- 87 Strongly Landlord-Friendly · R+5
- County
- — inherits STATE
- City
- — inherits STATE
ZIP-level market 78383
- Home prices YoY
- -12.8%
- Active inventory
- 119
- Price-to-rent
- 9.6×
Monthly cashflow live
- Estimated rent
- $1,261 medium interval (Pro) →
- Mortgage (P&I)
- −$760
- Tax from tax record
- −$85 /mo · $1,022/yr
- Insurance
- −$60
- HOA
- −$0
- Vacancy / Maint / Mgmt
- −$265
- Net cashflow
- $90
Break-even live
Sensitivity live
| Price | -10% $172 | -5% $131 | +0% $90 | +5% $49 | +10% $8 |
|---|---|---|---|---|---|
| Rent | -10% $-9 | -5% $40 | +0% $90 | +5% $140 | +10% $190 |
| Rate | -1.0pp $163 | -0.5pp $127 | base $90 | +0.5pp $53 | +1.0pp $14 |
UW: 25.0% down · 7.5% · 30yr · 1.5% tax · 5.0% vac · 8.0% maint · 8.0% mgmt
Financing live
Cash to close
- Down payment
- $36,250
- Closing costs
- $4,350
- Reserves months
- —
- Total cash needed
- —
Loan-product check · same deal, 3 products live
Conventional
25% down · 7.5% · 30yr
- Down + closing
- —
- Monthly P&I
- —
- Monthly cashflow
- —
- DSCR
- —
- Eligible?
- —
Personal DTI + credit; lowest rate.
DSCR
20% down · 8.5% · 30yr
- Down + closing
- —
- Monthly P&I
- —
- Monthly cashflow
- —
- DSCR
- —
- Eligible?
- —
No personal income docs; deal must DSCR.
Hard money
10% down · 12.0% · 12mo
- Down + closing
- —
- Monthly P&I
- —
- Monthly cashflow
- —
- DSCR
- —
- Eligible?
- —
Short-term bridge; refi at stabilization.
Listing history 24 events
-
2026-06-21days on market $145,000 Active 109 DOM
-
2026-06-19days on market $145,000 Active 107 DOM
-
2026-06-18days on market $145,000 Active 106 DOM
-
2026-06-17days on market $145,000 Active 105 DOM
-
2026-06-16days on market $145,000 Active 104 DOM
-
2026-06-15days on market $145,000 Active 103 DOM
-
2026-06-14days on market $145,000 Active 101 DOM
-
2026-06-12days on market $145,000 Active 100 DOM
-
2026-06-09days on market $145,000 Active 97 DOM
-
2026-06-08days on market $145,000 Active 96 DOM
-
2026-06-07days on market $145,000 Active 95 DOM
-
2026-06-05days on market $145,000 Active 93 DOM
-
2026-06-02days on market $145,000 Active 90 DOM
-
2026-06-01days on market $145,000 Active 89 DOM
-
2026-05-31days on market $145,000 Active 88 DOM
-
2026-05-30days on market $145,000 Active 87 DOM
-
2026-02-01$145,000 Active 804-char remark
Show marketing remark (804 chars)
Lake Corpus Christi Views – Sandia, TX Escape to the lake with this charming 2-bedroom, 1-bath home featuring a spacious bonus room, perfect for guests, a game room, or office space. Situated on a ¼-acre fully fenced lot in the Pernitas Point Subdivision, this home offers beautiful water views and is located just minutes from the neighborhood boat ramp. Enjoy a large parking area with an RV hookup, making it ideal for hosting get-togethers or storing your outdoor toys. With quick access to fishing, boating, and lake adventures, this property is perfect as a weekend getaway, investment property, or short-term rental. Experience laid-back lake life in Sandia—schedule your showing‌‌‌‌‌‌‌‌‌‌‌‌ today!
-
2025-07-30$145,000 Active
-
2022-08-29soldstatus
-
2022-08-29soldstatus
-
2019-10-16soldstatus
-
2005-07-05soldstatus
-
2005-06-29soldstatus
-
2005-03-09$68,900
ⓘ Source: listings_history table (triggers on properties + properties_extension) + one-shot
backfill from property_details.listing_events for pre-trigger history.
Tax reassessment forecast TX · Resets to sale price
- Current annual tax
- $1,022 · $85/mo
- Projected year-2 tax
- $2,654 · $221/mo
- Expected delta
- +$1,631/yr (+$136/mo · 159.6%)
ⓘ Screening estimate from a state-policy table — verify with the county assessor before closing.
Climate risk First Street
- Flood 1/10 Low FEMA zone X (unshaded) · 0% chance over 30 yrs
- Wildfire 3/10 Moderate
- Heat 9/10 Extreme 7 d/yr ≥110°F today · 22 d/yr by 30 yrs out
- Wind 9/10 Extreme 99% chance of damaging wind over 30 yrs
- Air quality 1/10 Low 0 unhealthy d/yr today · 0 by 30 yrs out
Nearby sold comps map
Loading sold comps map…
Walkable amenities ~0.75 mi
Loading nearby amenities…
Taxation est. · year 1
- Rental income
- $15,131
- − Mortgage interest
- −$8,122
- − Property taxes
- −$1,022
- − Insurance
- −$725
- − Repairs & maintenance
- −$1,210
- − Management
- −$1,210
- − Depreciation
- −$4,218
- Taxable loss
- −$1,378
- Est. tax savings @ 24.0%
- +$331
- After-tax cash flow
- $1,412/yr
For passive investors: Depreciation is non-cash, so a rental often shows a tax loss while cash-flowing — sheltering income. Rental losses are passive: they offset passive income freely, and up to $25,000/yr can offset ordinary (W-2) income if you actively participate and your MAGI is under $100k (phasing out to $0 by $150k); unused losses carry forward. On sale, claimed depreciation is recaptured at up to 25%, and gains may owe capital-gains tax (a 1031 exchange can defer both). Figures are a year-1 estimate at your 24.0% rate — not tax advice; consult a CPA.
Schools (NCES district)
- District
- George West ISD
- NCES district ID
- 4820550
- Math proficiency
- 55% ▼ -7.00%
- Reading proficiency
- 59% ▲ 2.00%
- Median HH income
- $45,721
- Composite
- 48.17/100
- National rank
- #2175
- State rank
- #95 of 826 in TX
Livability — Sandia
- Score
- 54/100
- State rank
- #1389
- US rank
- #23821
Category grades
Schools grade is shown separately in the Schools card above.
Census & demographics
- Population (ZIP)
- 4,306
Population outlook (Live Oak County) Hauer SSP2
- Today (2025)
- 13,886 people
- By 2030
- 14,793 · +6.5%
- By 2040
- 16,633 · +19.8%
- By 2050
- 18,511 · +33.3%
- By 2075
- 23,859 · +71.8%
- By 2100
- 26,396 · +90.1%
Race, ethnicity, and origin ACS 2023
- Neighborhood character
- Diverse neighborhood (Simpson 0.57)
- Race & ethnicity
- White 51% Hispanic / Latino 40% Two or more races 17% Black 4% Pacific Islander 1%
- Hispanic origin (detail)
- Mexican 29%
- Common ancestry
- Lithuanian 3% Romanian 3% Italian 1%
- Foreign-born
- 5% · Canada
- Languages at home
- 80% English-only · Spanish 19% Other Asian/Pacific 1%
Political lean MEDSL · Live Oak
- 2024 margin
- Solid R (+69.6) · D 14.9% · R 84.6%
- 2008→2024 swing
- -20.6pp toward R · 2008: -49.0pp · 2024: -69.6pp
- All cycles
- 2024: R+69.6 2020: R+66.9 2016: R+63.5 2012: R+54.5 2008: R+49.0
Not yet ingested
- Civics
- —
Market trends
- HPI YoY
- ▼ -26.06%
- Current HPI
- 178.3727
- Rent YoY
- —
- Metro
- —
- State GDP YoY
- ▲ 3.95%
- F500 in state
- 110
Industry mix (Fortune 500 HQ in TX)
| Industry | F500 HQs | Revenue |
|---|---|---|
| Energy | 16 | $1,198B |
|
||
| Technology | 5 | $198B |
|
||
| Engineering / Construction | 4 | $72B |
|
||
| Energy Services | 3 | $60B |
|
||
| Utilities | 3 | $41B |
|
||
| Healthcare | 2 | $330B |
|
||
Price history
+110.4% since first listed8 events — show timeline
- 2026-02-01 Listed $145,000 CBMLS
- 2025-07-30 Listed $145,000 CBMLS
- 2022-08-29 Sold (Public Records) — Public Records
- 2022-08-29 Sold (Public Records) — Public Records
- 2019-10-16 Sold (Public Records) — Public Records
- 2005-07-05 Sold (Public Records) — Public Records
- 2005-06-29 Sold (MLS) — CBMLS
- 2005-03-09 Listed $68,900 CBMLS
Property tax history
+1.1%/yrLatest (2025): $1,022 · +1.9% YoY. Source: county tax records.
Cash-flow waterfall
monthlySold comps — $/sqft
last 12 mo · ≤1 miLoading sold comps…