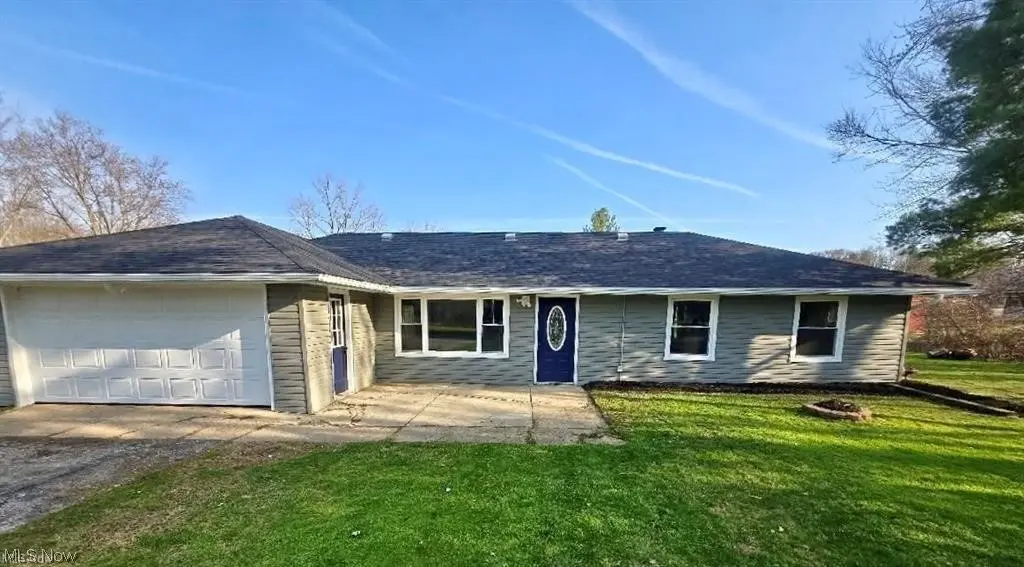
2353 W Hale Dr · Hudson, OH
Flood risk 1/10 · Minimal
- FEMA flood zone
- X (unshaded)
- Chance of flooding over 30 yrs
- 0.0%
- Est. flood insurance / yr
- $507 – $1,088
Fire risk 1/10 · Minimal
- Est. fire insurance / yr
- $713 – $1,323
Heat risk 2/10 · Minimal
- Hot days now (above 96°F)
- 7 days/yr
- Hot days in 30 yrs
- 17 days/yr
Wind risk 1/10 · Minimal
- Chance of severe wind over 30 yrs
- —
Air-quality risk 3/10 · Minor
- Unhealthy air days now
- 2 days/yr
- Unhealthy air days in 30 yrs
- 4 days/yr
Risk factors via First Street. Map © Google.
Why this score? — see what drove the D grade
The composite is a weighted blend of 9 inputs, each scored 0–100. Each bar is that input's sub-score; the figure is the points it added to the 100-point composite (weight × sub-score).
- Cash flow +11.5/30.0
- Schools +7.9/10.0
- ARV discount +7.5/15.0
- Livability +4.4/5.0
- DSCR +3.4/10.0
- 1% rule +3.1/10.0
- Rent growth +2.5/5.0
- Condition / age +2.5/5.0
- Appreciation +0.0/10.0
$309,900
🖨 Deal sheet (PDF) 📄 Offer letter ✓ Due diligence
Listing remarks
Welcome to your dream RANCH home, a haven of modern comfort and style, ideally situated on almost an acre of land in the highly rated Hudson School district. This stunning residence boasts three bedrooms with new carpet and two fully updated bathrooms, featuring all brand-new fixtures that shine with contemporary elegance. These updates include the vanities, showers, tile, toilets and flooring! As you step inside, be embraced by the warmth of fresh paint and brand-new flooring that extends throughout the house, setting the stage for your family's cherished memories. The heart of the home, a fully updated kitchen, is equipped with a suite of new appliances, including a dishwasher, microwave,
Key facts
- New gutters
- Updated bathrooms
- New appliances
Tags
Property features AI
Finance
- Financial info: Annual property tax listed (financial details provided separately)
Exterior
- Parking: Attached 2-car garage; Paved parking
- Utilities: Well water; Septic tank
- Home design: Single-story home; Vinyl siding
- Construction: Built (year from public records); Asphalt/fiberglass roof; Slab foundation
- Exterior features: Lot approximately 0.81 acres
Interior
- Kitchen: Dishwasher; Microwave; Range
- Bedrooms: 3 main-level bedrooms
- Bathrooms: 2 full bathrooms (both on the main level)
- Heating & cooling: Forced air heating (gas and oil); Central air; Ceiling fans
- Interior features: 6 total rooms
- Laundry & utility: Washer/dryer not specified
Neighborhood map
What this means for you Summary
Snapshot
- This is a 3-bed/1.5-bath single-family listed at $310k.
Deal economics
- At list price, monthly cash flow is $-102 ($-1k/yr) — negative.
- To cash-flow at today's rent, offer at most $292k (5.8% below list).
- To meet the 1% rule (rent ≥ 1% of price), the offer needs to be $251k (19.1% below list).
- Recommended offer: $251k (19.1% below list) — sets the bar for 1% rule.
- Cap rate 5.9% vs local median 2.6% in Hudson — top-decile yield for the area; either an underpriced asset or a hidden risk that comps aren't pricing in. Stress-test before assuming the spread holds.
Location & tenants
- Location reads 88/100 on livability (#20 in OH, #196 nationally) — a professional / high-income tenant draw. Strengths: crime A+, amenities A+, employment A+; Watch: commute F, cost of living F.
- Hudson City (suburban): math 84% / reading 88% proficiency, ranked #4 of 656 in OH (top 1%) — strong family-tenant draw, lease renewals of 3-5y typical; only 4% free/reduced lunch — higher-income household profile.
- Zoned schools: Ellsworth Hill Elementary School (663 students, 4% FRL); Hudson Middle School (math 83% / reading 88%, grade A+, #15 of 654 statewide, top 2%, 1,038 students, 4% FRL); Hudson High School (math 71% / reading 89%, grade A, #31 of 781 statewide, top 4%, 1,507 students, 5% FRL) — zoned schools at 4% FRL track the district average.
- Market conditions: 95 active listings in the ZIP; high-income renter base; 1,114 units permitted in Summit County in 2024 (397 in 5+ unit buildings).
- This rent is only 18% of the median local income ($169k/yr) — well below the 30% rent-burden line; pricing power to push rent on renewal without tenant pushback.
Forward outlook
- Local home prices are declining (-3.0%/yr); year-one equity from $2k of loan paydown is wiped out by about $9k of value loss. Plan a longer hold.
- Summit County population projected to shrink 6% by 2050 — rents likely to lag national; underwrite the cash flow, not the appreciation.
Negotiation context
- It's been on market 34 days — a 3% lower offer ($301k) is reasonable based on typical stale-listing flexibility.
- 11 sale attempts since 19y ago; this cycle's ask has dropped $20k (6%) from the opening price — seller is motivated, your offer sets the floor, not the list.
- Current owner paid $180k; list at $310k implies a 72% gain — meaningful room to come down on a strong offer.
Questions for the listing agent
- What do current leases actually rent for vs. the listed asking? Can we see a recent rent roll and the last 12 months of T-12 income?
- It's been on market 34 days. Have you received any prior offers? Is the seller open to a 19% concession, seller financing, or rate buy-down credit?
- Built in 1960 — when were the roof, HVAC, electrical panel, plumbing, and water heater last replaced?
- Is there a deadline driving the sale (1031 exchange, divorce, estate, relocation)? That informs how much negotiation room exists.
- Schools are A-rated — typically a magnet for longer-tenancy family renters. What's the average tenant stay here, and is there a school-zone premium baked into asking?
- The area grade is low — what's the realistic commute time and amenity access for the typical tenant pool here? Any planned neighborhood developments (good or bad) we should know about?
- What's the average days-on-market for RENTAL listings here right now (not sales)? A rising rental-DOM trend means longer vacancies and softer asking-rent achievability than the comps imply.
- What's the recent tenant-quality profile in this submarket — average credit score on applications, eviction rate, late-payment / NSF rate, and stable-employment percentage? A property-management company in the area should have these aggregated.
- How much new for-sale + rental construction is in the pipeline within 1–3 miles? Heavy new supply typically softens prices + rents 12–24 months out; constrained supply supports both.
Investment metrics
- 1% rule
- 0.81% ✗
- Cap rate
- 5.90%
- Cash-on-cash
- -1.40%
- DSCR
- 0.94
- GRM
- 10.3
CMA / ARV
- ARV (on-the-fly)
- $181,200
- Comps found
- 1
Show comp detail 1 sale within ~0.75 mi
| Address | Dist | Beds/Ba | Sqft | Sold | Price | $/sf | Match |
|---|---|---|---|---|---|---|---|
| 152 Harper Rd | 0.55mi | 2/1.0 (-1) | 1,291 (+8%) | 10mo | $195,000 | $151 | 46 |
Match score weights: distance 35% · size 25% · config 20% · recency 20%. Top-matched comps best support the ARV.
Projected returns pro-forma
-3.0% appreciation · 3.0% rent growth · sell at horizon
- IRR
- -18.6%
- Equity multiple
- 0.35×
- Total profit
- $-56,686
- Equity at exit
- $46,207
- IRR
- -11.0%
- Equity multiple
- 0.34×
- Total profit
- $-57,686
- Equity at exit
- $26,794
Cash invested: $86,772 (down + closing). Projections, not guarantees.
Landlord ↔ Tenant lean methodology
- Overall (STATE)
- 73 Landlord-Friendly
- State Ohio
- 73 Landlord-Friendly · R+6
- County
- — inherits STATE
- City
- — inherits STATE
ZIP-level market 44236
- Active inventory
- 95
- Price-to-rent
- 10.3×
Monthly cashflow live
- Estimated rent
- $2,508 medium interval (Pro) →
- Mortgage (P&I)
- −$1,625
- Tax from tax record
- −$328 /mo · $3,941/yr
- Insurance
- −$129
- HOA
- −$0
- Vacancy / Maint / Mgmt
- −$527
- Net cashflow
- $-102
Break-even live
Sensitivity live
| Price | -10% $74 | -5% $-14 | +0% $-102 | +5% $-189 | +10% $-277 |
|---|---|---|---|---|---|
| Rent | -10% $-300 | -5% $-201 | +0% $-102 | +5% $-3 | +10% $97 |
| Rate | -1.0pp $54 | -0.5pp $-23 | base $-102 | +0.5pp $-182 | +1.0pp $-264 |
UW: 25.0% down · 7.5% · 30yr · 1.5% tax · 5.0% vac · 8.0% maint · 8.0% mgmt
Financing live
Cash to close
- Down payment
- $77,475
- Closing costs
- $9,297
- Reserves months
- —
- Total cash needed
- —
Loan-product check · same deal, 3 products live
Conventional
25% down · 7.5% · 30yr
- Down + closing
- —
- Monthly P&I
- —
- Monthly cashflow
- —
- DSCR
- —
- Eligible?
- —
Personal DTI + credit; lowest rate.
DSCR
20% down · 8.5% · 30yr
- Down + closing
- —
- Monthly P&I
- —
- Monthly cashflow
- —
- DSCR
- —
- Eligible?
- —
No personal income docs; deal must DSCR.
Hard money
10% down · 12.0% · 12mo
- Down + closing
- —
- Monthly P&I
- —
- Monthly cashflow
- —
- DSCR
- —
- Eligible?
- —
Short-term bridge; refi at stabilization.
Listing history 39 events
-
2026-06-22pricedays on market $309,900 Active 34 DOM
-
2026-06-18days on market $314,900 Active 31 DOM
-
2026-06-17days on market $314,900 Active 30 DOM
-
2026-06-16days on market $314,900 Active 29 DOM
-
2026-06-15days on market $314,900 Active 28 DOM
-
2026-06-14pricedays on market $314,900 Active 26 DOM
-
2026-06-10days on market $319,900 Active 23 DOM
-
2026-06-09days on market $319,900 Active 22 DOM
-
2026-06-08days on market $319,900 Active 21 DOM
-
2026-06-07pricedays on market $319,900 Active 20 DOM
-
2026-06-03days on market $324,900 Active 16 DOM
-
2026-06-02days on market $324,900 Active 15 DOM
-
2026-06-01days on market $324,900 Active 14 DOM
-
2026-05-31days on market $324,900 Active 13 DOM
-
2026-05-31pricedays on market $324,900 Active 12 DOM
-
2026-05-18$329,900 Active
-
2026-05-12historical
-
2026-03-26price $324,900
-
2026-02-24$329,900 Active
-
2025-09-03soldstatus $180,000
-
2025-04-21status Active
-
2025-04-21historical
-
2025-01-16historical
-
2025-01-15$219,900 Active
-
2024-11-01price $224,900
-
2024-08-15status Active
-
2024-07-15historical Contingent
-
2024-07-02$229,900 Active
-
2024-05-26historical
-
2024-04-17status Active
-
2024-04-17price $229,850
-
2024-03-24status Active
-
2024-03-13status Pending
-
2024-03-08$199,850 Active
-
2008-08-30historical
-
2008-08-30historical
-
2007-06-27$115,000
-
2007-06-27$115,000
-
1988-02-19soldstatus $17,450
ⓘ Source: listings_history table (triggers on properties + properties_extension) + one-shot
backfill from property_details.listing_events for pre-trigger history.
Tax reassessment forecast OH · Partial reset (capped growth)
- Current annual tax
- $3,941 · $328/mo
- Projected year-2 tax
- $4,388 · $366/mo
- Expected delta
- +$447/yr (+$37/mo · 11.3%)
ⓘ Screening estimate from a state-policy table — verify with the county assessor before closing.
Climate risk First Street
- Flood 1/10 Low FEMA zone X (unshaded) · 0% chance over 30 yrs
- Wildfire 1/10 Low
- Heat 2/10 Low 7 d/yr ≥96°F today · 17 d/yr by 30 yrs out
- Wind 1/10 Low
- Air quality 3/10 Moderate 2 unhealthy d/yr today · 4 by 30 yrs out
Nearby sold comps map
Loading sold comps map…
Walkable amenities ~0.75 mi
Loading nearby amenities…
Taxation est. · year 1
- Rental income
- $30,093
- − Mortgage interest
- −$17,359
- − Property taxes
- −$3,941
- − Insurance
- −$1,550
- − Repairs & maintenance
- −$2,407
- − Management
- −$2,407
- − Depreciation
- −$9,015
- Taxable loss
- −$6,587
- Est. tax savings @ 24.0%
- +$1,581
- After-tax cash flow
- $362/yr
For passive investors: Depreciation is non-cash, so a rental often shows a tax loss while cash-flowing — sheltering income. Rental losses are passive: they offset passive income freely, and up to $25,000/yr can offset ordinary (W-2) income if you actively participate and your MAGI is under $100k (phasing out to $0 by $150k); unused losses carry forward. On sale, claimed depreciation is recaptured at up to 25%, and gains may owe capital-gains tax (a 1031 exchange can defer both). Figures are a year-1 estimate at your 24.0% rate — not tax advice; consult a CPA.
Schools (NCES district)
- District
- Hudson City
- NCES district ID
- 3905002
- Math proficiency
- 84% ▼ -7.00%
- Reading proficiency
- 88% ▼ -1.00%
- Median HH income
- $114,390
- Composite
- 78.78/100
- National rank
- #68
- State rank
- #4 of 656 in OH
Livability — Hudson
- Score
- 88/100
- State rank
- #20
- US rank
- #196
Category grades
Schools grade is shown separately in the Schools card above.
Census & demographics
- Census place
- Hudson, OH
- County
- Summit County · 440,783 people
- City population
- 25,941
- Metro
- Akron, OH
- Population (ZIP)
- 25,941
- Household income
- $168,595
- Rent vs Own
- Severe rent burden
- 276.0
Population outlook (Summit County) Hauer SSP2
- Today (2025)
- 546,583 people
- By 2030
- 544,028 · -0.5%
- By 2040
- 531,363 · -2.8%
- By 2050
- 514,923 · -5.8%
- By 2075
- 481,765 · -11.9%
- By 2100
- 432,265 · -20.9%
Race, ethnicity, and origin ACS 2023
- Neighborhood character
- Predominantly White (88%)
- Race & ethnicity
- White 88% Two or more races 4% Black 4% Asian 3% Hispanic / Latino 2%
- Common ancestry
- Romanian 7% Slovak 3% Lithuanian 3%
- Foreign-born
- 6% · Canada, China, South Korea
- Languages at home
- 93% English-only · Other Indo-European 1% Chinese 1% Spanish 1%
Political lean MEDSL · Summit
- 2024 margin
- Lean D (+7.0) · D 53.0% · R 46.0%
- 2008→2024 swing
- -9.6pp toward R · 2008: 16.6pp · 2024: 7.0pp
- All cycles
- 2024: D+7.0 2020: D+9.6 2016: D+8.2 2012: D+14.8 2008: D+16.6
Not yet ingested
- Civics
- —
Market trends
- HPI YoY
- ▼ -238.26%
- Current HPI
- 218.638
- Rent YoY
- —
- Metro
- Akron, OH
- State GDP YoY
- ▲ 1.98%
- F500 in state
- 48
Industry mix (Fortune 500 HQ in OH)
| Industry | F500 HQs | Revenue |
|---|---|---|
| Insurance | 3 | $145B |
|
||
| Industrial Machinery | 3 | $49B |
|
||
| Financial Services | 3 | $24B |
|
||
| Consumer Goods | 2 | $93B |
|
||
| Aerospace / Defense | 2 | $47B |
|
||
| Utilities | 2 | $33B |
|
||
Price history
+1790.5% since first listed24 events — show timeline
- 2026-05-18 Listed $329,900 MLSNOW
- 2026-05-12 Listing Removed — MLSNOW
- 2026-03-26 Price Changed $324,900 MLSNOW
- 2026-02-24 Listed $329,900 MLSNOW
- 2025-09-03 Sold (Public Records) $180,000 Public Records
- 2025-04-21 Relisted — MLSNOW
- 2025-04-21 Listing Removed — MLSNOW
- 2025-01-16 Listing Removed — MLSNOW
- 2025-01-15 Listed $219,900 MLSNOW
- 2024-11-01 Price Changed $224,900 MLSNOW
- 2024-08-15 Relisted — MLSNOW
- 2024-07-15 Contingent — MLSNOW
- 2024-07-02 Listed $229,900 MLSNOW
- 2024-05-26 Listing Removed — MLSNOW
- 2024-04-17 Relisted — MLSNOW
- 2024-04-17 Price Changed $229,850 MLSNOW
- 2024-03-24 Relisted — MLSNOW
- 2024-03-13 Pending — MLSNOW
- 2024-03-08 Listed $199,850 MLSNOW
- 2008-08-30 Listing Removed — MLSNOW
- 2008-08-30 Listing Removed — MLSNOW
- 2007-06-27 Listed $115,000 MLSNOW
- 2007-06-27 Listed $115,000 MLSNOW
- 1988-02-19 Sold (Public Records) $17,450 Public Records
Property tax history
+2.1%/yrLatest (2025): $3,941 · -10.5% YoY. Source: county tax records.
Cash-flow waterfall
monthlySold comps — $/sqft
last 12 mo · ≤1 miLoading sold comps…