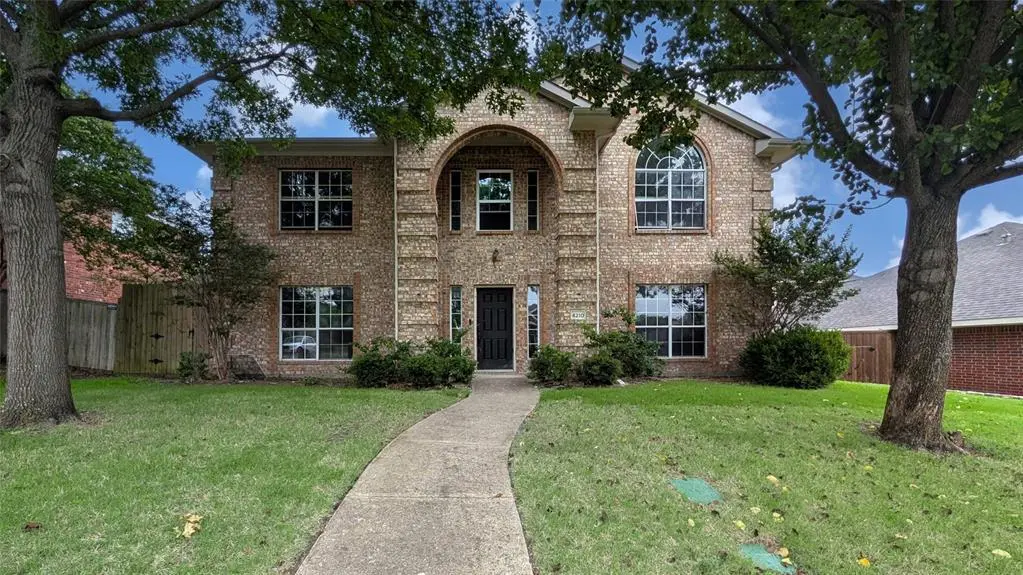
4210 Glistening Spgs · Rowlett, TX
Flood risk 1/10 · Minimal
- FEMA flood zone
- X (unshaded)
- Chance of flooding over 30 yrs
- 0.0%
- Est. flood insurance / yr
- $507 – $1,088
Fire risk 3/10 · Minor
- Est. fire insurance / yr
- $1,222 – $2,270
Heat risk 7/10 · Major
- Hot days now (above 110°F)
- 7 days/yr
- Hot days in 30 yrs
- 24 days/yr
Wind risk 6/10 · Moderate
- Chance of severe wind over 30 yrs
- 27.0%
Air-quality risk 2/10 · Minimal
- Unhealthy air days now
- 2 days/yr
- Unhealthy air days in 30 yrs
- 2 days/yr
Risk factors via First Street. Map © Google.
Why this score? — see what drove the B- grade
The composite is a weighted blend of 9 inputs, each scored 0–100. Each bar is that input's sub-score; the figure is the points it added to the 100-point composite (weight × sub-score).
- Cash flow +24.6/30.0
- ARV discount +15.0/15.0
- 1% rule +8.8/10.0
- DSCR +8.0/10.0
- Livability +3.8/5.0
- Schools +2.9/10.0
- Condition / age +2.5/5.0
- Rent growth +2.2/5.0
- Appreciation +1.6/10.0
$260,000
🖨 Deal sheet 📄 Offer letter ✓ Due diligence
Listing remarks MLS
Be home for the holidays! Large home with a great flow between the kitchen, formal dining, and two living areas; making it perfect for entertaining! Gated neighborhood is tucked away in a quiet area but close to 190. New roof installed August 2017. Lovingly maintained. Cozy family room features brick fireplace. Guest bath. Pretty moldings. Large center island in kitchen. Walk in Pantry. Gas cook-top. Window over sink looks out to large backyard. Rear driveway has lots of parking. Wood fence, storage bldg. Covered patio. Upstairs features 4 large bedrooms. Master Bath has updated shower with nice finishes and new tile floors. Separate vanities and garden tub. Ample storage space in closets. Refrigerator stays.
Key facts
- Roof in good shape
- Bricks in good shape
- 9,017 sq ft lot
Tags
Property features AI
Finance
- Other: Listing possession at closing/funding; Listing status: Active
- Financial info: Accepts Cash, Conventional, and VA financing
- HOA & community: Mandatory HOA; HOA fee $456 annually; HOA covers grounds maintenance; HOA management: Goodwin resident Care
Exterior
- Parking: Attached 2-car garage (approx. 20' x 20'); 2 covered parking spaces; On-street parking available; Carport spaces: 0
- Utilities: City water; City sewer; Not in a municipal utility district
- Home design: Single family residence; Residential property; Two-story; Preowned (built in 2001)
- Construction: Brick construction; Composition roof; Slab foundation; Built in 2001
- Exterior features: Lot under 0.5 acre (approx. 0.207 acres); Subdivision: Magnolia Spgs Ph 2a & 2b; Directions provided
Interior
- Kitchen: No appliances included
- Bedrooms: Four bedrooms; Primary bedroom on level 1
- Flooring: Concrete flooring
- Bathrooms: Two full bathrooms; One half bathroom
- Heating & cooling: Central heating (electric); Central air conditioning (electric)
- Interior features: Central vacuum; Two levels; One living area; One dining area; Five total rooms
- Laundry & utility: No laundry appliances listed
Neighborhood map
What this means for you Summary
Snapshot
- This is a 4-bed/2.5-bath single-family listed at $260k.
Deal economics
- At list price, monthly cash flow is $540 ($6k/yr) — positive.
- The deal already cash-flows at list — no discount required.
- Meets the 1% rule at list price ($4k rent vs $260k).
- Cap rate 8.8% vs local median 3.2% in Rowlett — top-decile yield for the area; either an underpriced asset or a hidden risk that comps aren't pricing in. Stress-test before assuming the spread holds.
Location & tenants
- Location reads 75/100 on livability (#147 in TX, #4,150 nationally) — a middle-class / working-renter tenant base. Strengths: employment A+, housing A+, crime A-; Watch: amenities F, commute F, health & safety D-.
- Garland ISD (suburban): math 27% / reading 37% proficiency, ranked #553 of 826 in TX (top 67%) — families likely to look elsewhere, expect single-tenant / working-renter base with shorter leases.
- Market conditions: Rents soft (-1.2%/yr); 295 active listings in the ZIP; 14 comparable units currently listed for rent nearby; rentals at typical pace (median 22d on market — plan ~3-4 weeks tenant-placement turnaround); solid renter incomes; 12,577 units permitted in Dallas County in 2024 (6,829 in 5+ unit buildings).
- This rent runs 41% of the median local income ($105k/yr) — at the standard rent-burdened threshold; future hikes will face affordability resistance.
Forward outlook
- Local home prices are declining (-3.0%/yr); year-one equity from $2k of loan paydown is wiped out by about $8k of value loss. Plan a longer hold.
- Dallas County population projected at +35% by 2050 — long-run rental-demand tailwind backs the buy-and-hold thesis.
Negotiation context
- Only 6 days on market — expect competitive offers; lowballing is unlikely to land.
- 3 sale attempts since 9y ago with the ask held roughly flat each time — persistent listings suggest the price (not the market) is what's stuck; bring a comps-based counter.
Risks & watch-outs
- Watch-outs: property tax is 3.6% of price.
- Climate carrying-cost: major wind risk, 27% chance of damaging wind over 30y; extreme-heat days projected 7→24/yr by 2055 (HVAC capex compounding) — expect insurance premiums to compound above CPI over the hold.
Questions for the listing agent
- Property tax is high relative to price — has the assessment been appealed recently, and will the sale trigger a re-assessment?
- What does the HOA fee cover, when was the last increase, and are there any pending special assessments or reserve-fund shortfalls?
- Is there a deadline driving the sale (1031 exchange, divorce, estate, relocation)? That informs how much negotiation room exists.
- What's the average days-on-market for RENTAL listings here right now (not sales)? A rising rental-DOM trend means longer vacancies and softer asking-rent achievability than the comps imply.
- What's the recent tenant-quality profile in this submarket — average credit score on applications, eviction rate, late-payment / NSF rate, and stable-employment percentage? A property-management company in the area should have these aggregated.
- How much new for-sale + rental construction is in the pipeline within 1–3 miles? Heavy new supply typically softens prices + rents 12–24 months out; constrained supply supports both.
Investment metrics
- 1% rule
- 1.38% ✓
- Cap rate
- 8.78%
- Cash-on-cash
- 8.90%
- DSCR
- 1.40
- GRM
- 6.0
CMA / ARV
- ARV (on-the-fly)
- $445,996
- Comps found
- 12
Show comp detail 12 sales within ~0.75 mi
| Address | Dist | Beds/Ba | Sqft | Sold | Price | $/sf | Match |
|---|---|---|---|---|---|---|---|
| 5210 Natchez Dr | 0.55mi | 4/3.0 | 2,649 (+2%) | 2mo | $475,000 | $179 | 67 |
| 5001 Bayonne Dr | 0.46mi | 4/2.5 | 2,417 (-7%) | 4mo | $416,000 | $172 | 64 |
| 2709 Lafayette Dr | 0.56mi | 4/3.0 | 2,509 (-3%) | 7mo | $474,820 | $189 | 60 |
| 4210 Pointe Loma Dr | 0.54mi | 4/2.0 | 2,355 (-9%) | 0mo | $350,000 | $149 | 57 |
| 4402 Running Brook Dr | 0.69mi | 4/3.5 | 2,681 (+3%) | 2mo | $450,000 | $168 | 56 |
| 5202 Gulfport Dr | 0.53mi | 4/2.5 | 2,835 (+9%) | 7mo | $425,000 | $150 | 54 |
| 4010 Bluffpoint Rd | 0.68mi | 4/2.5 | 2,816 (+9%) | 0mo | $439,900 | $156 | 54 |
| 3614 Finnian St | 0.53mi | 4/3.5 | 2,820 (+9%) | 4mo | $499,000 | $177 | 53 |
| 5214 Orlando Cir | 0.64mi | 4/2.5 | 2,772 (+7%) | 7mo | $429,900 | $155 | 53 |
| 2216 Sternpost Mews | 0.68mi | 3/2.5 (-1) | 2,441 (-6%) | 2mo | $539,900 | $221 | 51 |
| 3601 Amber Ave | 0.45mi | 3/2.0 (-1) | 2,240 (-14%) | 4mo | $365,000 | $163 | 46 |
| 3901 Pointe Loma Dr | 0.71mi | 4/2.0 | 2,355 (-9%) | 7mo | $499,900 | $212 | 44 |
Match score weights: distance 35% · size 25% · config 20% · recency 20%. Top-matched comps best support the ARV.
Projected returns pro-forma
-3.0% appreciation · 0.0% rent growth · sell at horizon
- IRR
- -6.9%
- Equity multiple
- 0.75×
- Total profit
- $-17,914
- Equity at exit
- $38,767
- IRR
- -2.6%
- Equity multiple
- 0.86×
- Total profit
- $-10,515
- Equity at exit
- $22,480
Cash invested: $72,800 (down + closing). Projections, not guarantees.
Landlord ↔ Tenant lean methodology
- Overall (STATE)
- 87 Strongly Landlord-Friendly
- State Texas
- 87 Strongly Landlord-Friendly · R+5
- County
- — inherits STATE
- City
- — inherits STATE
ZIP-level market 75088
- Home prices YoY
- -2.0%
- Rents YoY
- -1.2%
- Active inventory
- 295
- Price-to-rent
- 6.0×
Monthly cashflow live
- Estimated rent
- $3,588 high interval (Pro) →
- Mortgage (P&I)
- −$1,363
- Tax from tax record
- −$785 /mo · $9,423/yr
- Insurance
- −$108
- HOA
- −$38
- Vacancy / Maint / Mgmt
- −$754
- Net cashflow
- $540
Break-even live
UW: 25.0% down · 7.5% · 30yr · 1.5% tax · 5.0% vac · 8.0% maint · 8.0% mgmt
Financing live
Cash to close
- Down payment
- $65,000
- Closing costs
- $7,800
- Reserves months
- —
- Total cash needed
- —
Loan-product check · same deal, 3 products live
Conventional
25% down · 7.5% · 30yr
- Down + closing
- —
- Monthly P&I
- —
- Monthly cashflow
- —
- DSCR
- —
- Eligible?
- —
Personal DTI + credit; lowest rate.
DSCR
20% down · 8.5% · 30yr
- Down + closing
- —
- Monthly P&I
- —
- Monthly cashflow
- —
- DSCR
- —
- Eligible?
- —
No personal income docs; deal must DSCR.
Hard money
10% down · 12.0% · 12mo
- Down + closing
- —
- Monthly P&I
- —
- Monthly cashflow
- —
- DSCR
- —
- Eligible?
- —
Short-term bridge; refi at stabilization.
Rent comps 14 comps
| Address | Beds | Baths | Sqft | Rent | $/sqft | DOM | Units | Dist |
|---|---|---|---|---|---|---|---|---|
| 2514 Amy Ave Rowlett, TX | 3.0 | 2.0 | 1805 | $2,350 | $1.30 | 2d | 1 | 0.37mi |
| 5210 Orlando Cir Rowlett, TX | 4.0 | 2.5 | 2845 | $2,676 | $0.94 | 7d | 1 | 0.63mi |
| 4214 Osage Dr Rowlett, TX | 4.0 | 2.0 | 1757 | $2,600 | $1.48 | 43d | 1 | 0.72mi |
| 3913 Baywatch Dr Rowlett, TX | 5.0 | 3.0 | 2855 | $8,250 | $2.89 | 43d | 1 | 0.77mi |
| 3913 Baywatch Dr Unit 1019523P Rowlett, TX | 5.0 | 3.0 | 2583 | $10,864 | $4.21 | 22d | 1 | 0.77mi |
| 1600 President George Bush Hwy Rowlett, TX | 1.0–4.0 | 1.0–3.0 | 1333 | $3,015 | $2.26 | 1d | 44 | 0.83mi |
| 3721 Smartt St Rowlett, TX | 4.0 | 2.5 | 1977 | $2,500 | $1.26 | 20d | 1 | 0.91mi |
| 3104 Cambridge Dr Rowlett, TX | 4.0 | 3.0 | 3560 | $3,495 | $0.98 | 43d | 1 | 0.97mi |
| 3005 David Dr Rowlett, TX | 3.0 | 2.5 | 1907 | $2,400 | $1.26 | 7d | 1 | 1.02mi |
| 2913 David Dr Rowlett, TX | 4.0 | 3.0 | 2108 | $2,750 | $1.30 | 7d | 1 | 1.05mi |
| 2010 Indian Trl Rowlett, TX | 5.0 | 4.0 | 3602 | $10,950 | $3.04 | 43d | 1 | 1.15mi |
| 2010 Indian Trl Unit 1293860P Rowlett, TX | 5.0 | 4.0 | 3595 | $13,695 | $3.81 | 24d | 1 | 1.15mi |
| 1205 Marc Pl Rowlett, TX | 4.0 | 3.5 | 2261 | $3,900 | $1.72 | 20d | 1 | 1.38mi |
| 1221 Marc Pl Rowlett, TX | 3.0 | 3.5 | 2190 | $3,400 | $1.55 | 24d | 1 | 1.38mi |
HOA detail
- Monthly dues
- $38 · $456/yr
- Likely covers
- gassecurity
Listing history 6 events
-
2026-06-18days on market $260,000 Active 6 DOM
-
2026-06-17days on market $260,000 Active 5 DOM
-
2026-06-16days on market $260,000 Active 4 DOM
-
2026-06-15days on market $260,000 Active 3 DOM
-
2026-06-13remarks 478-char remark
-
2026-06-13$260,000 Active 1 DOM
ⓘ Source: listings_history table (triggers on properties + properties_extension) + one-shot
backfill from property_details.listing_events for pre-trigger history.
Tax reassessment forecast TX · Resets to sale price
- Current annual tax
- $9,423 · $785/mo
- Projected year-2 tax
- $9,423 · $785/mo
- Expected delta
- $0/yr ($0/mo · 0.0%)
ⓘ Screening estimate from a state-policy table — verify with the county assessor before closing.
Climate risk First Street
- Flood 1/10 Low FEMA zone X (unshaded) · 0% chance over 30 yrs
- Wildfire 3/10 Moderate
- Heat 7/10 Severe 7 d/yr ≥110°F today · 24 d/yr by 30 yrs out
- Wind 6/10 Major 27% chance of damaging wind over 30 yrs
- Air quality 2/10 Low 2 unhealthy d/yr today · 2 by 30 yrs out
Nearby sold comps map
Loading sold comps map…
Walkable amenities ~0.75 mi
Loading nearby amenities…
Taxation est. · year 1
- Rental income
- $43,060
- − Mortgage interest
- −$14,564
- − Property taxes
- −$9,423
- − Insurance
- −$1,300
- − Repairs & maintenance
- −$3,445
- − Management
- −$3,445
- − HOA
- −$456
- − Depreciation
- −$7,564
- Taxable income
- $2,863
- Est. tax owed @ 24.0%
- −$687
- After-tax cash flow
- $5,789/yr
For passive investors: Depreciation is non-cash, so a rental often shows a tax loss while cash-flowing — sheltering income. Rental losses are passive: they offset passive income freely, and up to $25,000/yr can offset ordinary (W-2) income if you actively participate and your MAGI is under $100k (phasing out to $0 by $150k); unused losses carry forward. On sale, claimed depreciation is recaptured at up to 25%, and gains may owe capital-gains tax (a 1031 exchange can defer both). Figures are a year-1 estimate at your 24.0% rate — not tax advice; consult a CPA.
Schools (NCES district)
- District
- Garland ISD
- NCES district ID
- 4820340
- Math proficiency
- 27% ▼ -23.00%
- Reading proficiency
- 37% ▼ -10.00%
- Median HH income
- $58,392
- Composite
- 28.63/100
- National rank
- #6706
- State rank
- #553 of 826 in TX
Livability — Rowlett
- Score
- 75/100
- State rank
- #147
- US rank
- #4150
Category grades
Schools grade is shown separately in the Schools card above.
Census & demographics
- Census place
- Rowlett, TX
- County
- Dallas County · 2,612,404 people
- City population
- 35,619
- Metro
- Dallas-Fort Worth-Arlington, TX
- Population (ZIP)
- 28,075
- Household income
- $105,313
- Rent vs Own
- Severe rent burden
- 626.0
Population outlook (Dallas County) Hauer SSP2
- Today (2025)
- 2,979,839 people
- By 2030
- 3,191,823 · +7.1%
- By 2040
- 3,619,611 · +21.5%
- By 2050
- 4,026,915 · +35.1%
- By 2075
- 4,957,073 · +66.4%
- By 2100
- 5,508,725 · +84.9%
Race, ethnicity, and origin ACS 2023
- Neighborhood character
- Diverse neighborhood (Simpson 0.62)
- Race & ethnicity
- White 56% Hispanic / Latino 19% Black 18% Two or more races 10% Asian 4%
- Hispanic origin (detail)
- Mexican 15%
- Common ancestry
- Slovak 3% Italian 2% Romanian 2%
- Foreign-born
- 10% · Canada, Vietnam
- Languages at home
- 84% English-only · Spanish 11% Other Indo-European 1% Other Asian/Pacific 1%
Political lean MEDSL · Dallas
- 2024 margin
- Strong D (+22.2) · D 60.2% · R 38.0% · Other 1.8%
- 2008→2024 swing
- +6.9pp toward D · 2008: 15.3pp · 2024: 22.2pp
- All cycles
- 2024: D+22.2 2020: D+31.6 2016: D+26.2 2012: D+15.4 2008: D+15.3
Not yet ingested
- Civics
- —
Market trends
- HPI YoY
- ▼ -6.72%
- Current HPI
- 328.27
- Rent YoY
- ▼ -1.22%
- Metro
- Dallas-Fort Worth-Arlington, TX
- State GDP YoY
- ▲ 3.95%
- F500 in state
- 110
Industry mix (Fortune 500 HQ in TX)
| Industry | F500 HQs | Revenue |
|---|---|---|
| Energy | 16 | $1,198B |
|
||
| Technology | 5 | $198B |
|
||
| Engineering / Construction | 4 | $72B |
|
||
| Energy Services | 3 | $60B |
|
||
| Utilities | 3 | $41B |
|
||
| Healthcare | 2 | $330B |
|
||
Price history
-1.8% since first listed12 events — show timeline
- 2026-06-12 Listed $260,000 NTREIS
- 2026-04-27 Sold (Public Records) — Public Records
- 2018-01-05 Sold (Public Records) — Public Records
- 2018-01-04 Sold (MLS) — NTREIS
- 2017-12-11 Pending — NTREIS
- 2017-12-08 Contingent — NTREIS
- 2017-11-01 Price Changed $249,900 NTREIS
- 2017-10-18 Listed $259,000 NTREIS
- 2017-10-16 Sold (MLS) — NTREIS
- 2017-10-03 Price Changed $259,000 NTREIS
- 2017-08-30 Listed $264,900 NTREIS
- 2005-10-27 Sold (Public Records) — Public Records
Property tax history
+4.3%/yrLatest (2025): $9,423 · +27.5% YoY. Source: county tax records.
Cash-flow waterfall
monthlySold comps — $/sqft
last 12 mo · ≤1 miLoading sold comps…