 Fourplex
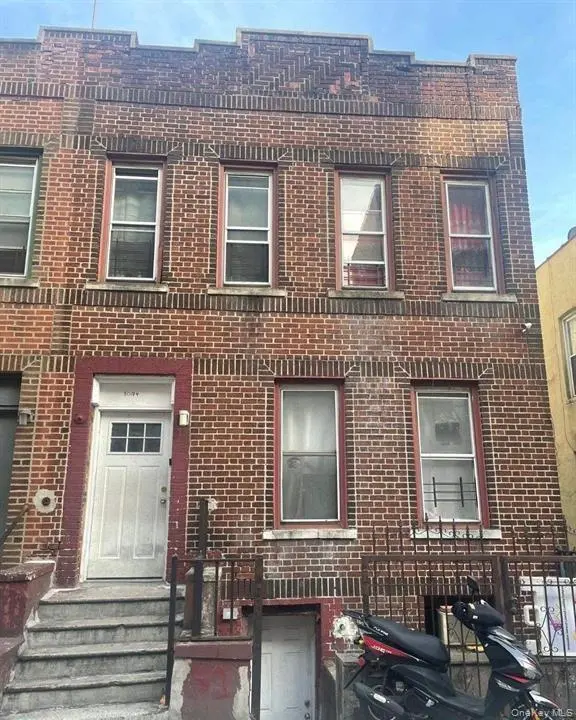
1094 Longfellow Ave · New York, NY
Flood risk 1/10 · Minimal
- FEMA flood zone
- X (unshaded)
- Chance of flooding over 30 yrs
- 0.0%
- Est. flood insurance / yr
- $507 – $1,088
Fire risk 1/10 · Minimal
- Est. fire insurance / yr
- $691 – $1,283
Heat risk 7/10 · Major
- Hot days now (above 99°F)
- 7 days/yr
- Hot days in 30 yrs
- 15 days/yr
Wind risk 6/10 · Moderate
- Chance of severe wind over 30 yrs
- 27.0%
Air-quality risk 4/10 · Minor
- Unhealthy air days now
- 5 days/yr
- Unhealthy air days in 30 yrs
- 6 days/yr
Risk factors via First Street. Map © Google.
Why this score? — see what drove the B- grade
The composite is a weighted blend of 9 inputs, each scored 0–100. Each bar is that input's sub-score; the figure is the points it added to the 100-point composite (weight × sub-score).
- Cash flow +27.6/30.0
- DSCR +9.7/10.0
- Appreciation +8.3/10.0
- 1% rule +7.2/10.0
- Schools +5.0/10.0
- Livability +3.8/5.0
- Rent growth +2.5/5.0
- Condition / age +2.5/5.0
- ARV discount +0.0/15.0
$1,199,000
🖨 Deal sheet (PDF) 📄 Offer letter ✓ Due diligence
Multi-family units
County records classify this as Multi-Family (2-4 Unit). Listing-text estimate: 4 units. confirmed
Listing remarks MLS
money Maker Property Or Live Rent Free, Rent Way Below Today Market Value, Just Installed Brand New Boiler Very Good Roof, Close To Transportation, Schools Shopping, Parks And More
Key facts
- Near schools
- Near shopping
- 4-family property
Tags
Property features AI
Exterior
- Parking: On-street parking
- Utilities: Public sewer; No additional utilities listed
- Home design: Quadruplex; Total building area approximately 3200
- Construction: Brick exterior
- Exterior features: Brick construction; Not waterfront
Interior
- Heating & cooling: Natural gas heating; Radiant heating; Wall/window air conditioning units
- Interior features: Recessed lighting; Soaking tub; Finished full walk-out basement
Neighborhood map
What this means for you Summary
Snapshot
- This is a 4 × 3-bed/2.0-bath units multifamily listed at $1.20M.
Deal economics
- At list price, monthly cash flow is $4k ($43k/yr) — positive. Per door: $893/mo.
- The deal already cash-flows at list — no discount required.
- Meets the 1% rule at list price ($15k rent vs $1.20M).
- Cap rate 9.9% vs local median 2.6% in New York — top-decile yield for the area; either an underpriced asset or a hidden risk that comps aren't pricing in. Stress-test before assuming the spread holds.
Location & tenants
- Location reads 75/100 on livability (#268 in NY, #4,188 nationally) — a middle-class / working-renter tenant base. Strengths: amenities A+, commute A+, health & safety A; Watch: crime F, cost of living F.
- Zoned schools: Elm Tree Elementary School (math 27% / reading 52%, grade F, #1,444 of 2,108 statewide, top 71%, 806 students, 94% FRL); Jhs 383 Philippa Schuyler (math 32% / reading 67%, grade C, #280 of 729 statewide, top 40%, 822 students, 85% FRL); Midwood High School (math 94% / reading 96%, grade A+, #83 of 1,100 statewide, top 8%, 4,062 students, 73% FRL).
- Market conditions: 38 active listings in the ZIP; 6,929 units permitted in Bronx County in 2024 (6,829 in 5+ unit buildings).
Forward outlook
- In year one you build about $88k of equity ($8k loan paydown + $80k appreciation (6.7% local appreciation)).
- Bronx County population projected at +21% by 2050 — long-run rental-demand tailwind backs the buy-and-hold thesis.
- At projected returns (6.7% appreciation + 3.0% rent growth), your $336k cash investment doubles in ~3 years — after that, you're playing with house money.
- By year 2, paydown + projected appreciation supports a ~$141k cash-out refi (75% LTV) — recoverable capital for the next deal without selling this one.
Negotiation context
- Only 12 days on market — expect competitive offers; lowballing is unlikely to land.
- 7 sale attempts since 20y ago with the ask held roughly flat each time — persistent listings suggest the price (not the market) is what's stuck; bring a comps-based counter.
- Current owner paid $550k; list at $1.20M implies a 118% gain — meaningful room to come down on a strong offer.
Risks & watch-outs
- Watch-outs: built in 1930 — expect roof / HVAC / electrical / plumbing capex.
- Climate carrying-cost: major wind risk, 27% chance of damaging wind over 30y; extreme-heat days projected 7→15/yr by 2055 (HVAC capex compounding) — expect insurance premiums to compound above CPI over the hold.
Questions for the listing agent
- Can we see the unit-by-unit rent roll, current vacancy, and any below-market leases? What's the average tenancy length?
- What capital expenditures (roof, boiler, parking lot, exteriors) have been made in the last 5 years, and what's planned in the next 2?
- Built in 1930 — when were the roof, HVAC, electrical panel, plumbing, and water heater last replaced?
- Is there a deadline driving the sale (1031 exchange, divorce, estate, relocation)? That informs how much negotiation room exists.
- Schools are B-rated — typically a magnet for longer-tenancy family renters. What's the average tenant stay here, and is there a school-zone premium baked into asking?
- Crime grade is F in this area — have there been break-ins, vandalism, or insurance claims at this property in the last 3 years? What carrier currently insures it and at what premium?
- What's the average days-on-market for RENTAL listings here right now (not sales)? A rising rental-DOM trend means longer vacancies and softer asking-rent achievability than the comps imply.
- What's the recent tenant-quality profile in this submarket — average credit score on applications, eviction rate, late-payment / NSF rate, and stable-employment percentage? A property-management company in the area should have these aggregated.
- How much new apartment / multifamily construction is in the pipeline within 1–3 miles? Heavy new supply (>2% of stock underway) typically softens rents 12–24 months out; light construction supports rent growth.
Investment metrics
- 1% rule
- 1.22% ✓
- Cap rate
- 9.87%
- Cash-on-cash
- 12.77%
- DSCR
- 1.57
- GRM
- 6.9
CMA / ARV
- ARV (on-the-fly)
- $1,011,200
- Comps found
- 12
Show comp detail 12 sales within ~0.75 mi
| Address | Dist | Beds/Ba | Sqft | Sold | Price | $/sf | Match |
|---|---|---|---|---|---|---|---|
| 1056 Longfellow Ave | 0.09mi | 7/4.0 | 3,200 (0%) | 1mo | $1,175,000 | $367 | 95 |
| 1032 Longfellow Ave | 0.14mi | 7/4.0 | 3,200 (0%) | 3mo | $1,200,000 | $375 | 91 |
| 1060 Longfellow Ave | 0.09mi | 10/4.0 | 3,200 (0%) | 12mo | $1,100,000 | $344 | 86 |
| 1506 E 172nd St | 0.50mi | 6/4.0 | 3,198 (-0%) | 2mo | $950,000 | $297 | 75 |
| 990 Jennings St | 0.34mi | 7/5.0 | 3,300 (+3%) | 10mo | $990,000 | $300 | 70 |
| 1238 Colgate Ave | 0.38mi | 5/2.0 | 2,802 (-12%) | 2mo | $835,000 | $298 | 60 |
| 832 Bryant Ave | 0.57mi | 7/3.0 | 3,120 (-2%) | 14mo | $980,000 | $314 | 57 |
| 811 E 168th St | 0.61mi | 5/3.0 | 3,090 (-3%) | 12mo | $975,000 | $316 | 56 |
| 1029 Rev James Polite Ave | 0.61mi | 7/4.0 | 3,024 (-6%) | 11mo | $960,000 | $317 | 53 |
| 1378 Bristow St #2 | 0.57mi | 9/3.0 | 3,400 (+6%) | 12mo | $875,000 | $257 | 53 |
| 1343 Bristow St | 0.55mi | 8/5.0 | 3,540 (+11%) | 16mo | $1,165,000 | $329 | 44 |
| 1206 Tinton Ave | 0.69mi | 7/2.0 | 3,507 (+10%) | 11mo | $900,000 | $257 | 43 |
Match score weights: distance 35% · size 25% · config 20% · recency 20%. Top-matched comps best support the ARV.
Projected returns pro-forma
6.66% appreciation · 3.0% rent growth · sell at horizon
- IRR
- 27.3%
- Equity multiple
- 2.85×
- Total profit
- $621,269
- Equity at exit
- $804,295
- IRR
- 25.2%
- Equity multiple
- 5.88×
- Total profit
- $1,638,637
- Equity at exit
- $1,504,312
Cash invested: $335,720 (down + closing). Projections, not guarantees.
Landlord ↔ Tenant lean methodology
- Overall (CITY)
- 0 Strongly Tenant-Friendly
- State New York
- 15 Strongly Tenant-Friendly · D+10
- County
- — inherits STATE
- City New York
- 0 Strongly Tenant-Friendly · D+34
ZIP-level market 10459
- Home prices YoY
- 2.5%
- Active inventory
- 38
- Price-to-rent
- 27.4×
Monthly cashflow live
- Estimated rent
- $14,572 medium interval (Pro) →
- Mortgage (P&I)
- −$6,288
- Tax from tax record
- −$1,152 /mo · $13,820/yr
- Insurance
- −$500
- HOA
- −$0
- Vacancy / Maint / Mgmt
- −$3,060
- Net cashflow
- $3,573
Break-even live
Sensitivity live
| Price | -10% $4,252 | -5% $3,912 | +0% $3,573 | +5% $3,234 | +10% $2,894 |
|---|---|---|---|---|---|
| Rent | -10% $2,422 | -5% $2,997 | +0% $3,573 | +5% $4,149 | +10% $4,724 |
| Rate | -1.0pp $4,177 | -0.5pp $3,878 | base $3,573 | +0.5pp $3,262 | +1.0pp $2,946 |
4-unit breakdown (identical units grouped — click to expand)
| Units | Beds | Baths | Est. rent |
|---|---|---|---|
| 4× units | 3 | 2 | $14,572 |
| #1 | 3 | 2 | $3,643 |
| #2 | 3 | 2 | $3,643 |
| #3 | 3 | 2 | $3,643 |
| #4 | 3 | 2 | $3,643 |
| Total (4 units) | $14,572 | ||
UW: 25.0% down · 7.5% · 30yr · 1.5% tax · 5.0% vac · 8.0% maint · 8.0% mgmt
Financing live
Cash to close
- Down payment
- $299,750
- Closing costs
- $35,970
- Reserves months
- —
- Total cash needed
- —
Loan-product check · same deal, 3 products live
Conventional
25% down · 7.5% · 30yr
- Down + closing
- —
- Monthly P&I
- —
- Monthly cashflow
- —
- DSCR
- —
- Eligible?
- —
Personal DTI + credit; lowest rate.
DSCR
20% down · 8.5% · 30yr
- Down + closing
- —
- Monthly P&I
- —
- Monthly cashflow
- —
- DSCR
- —
- Eligible?
- —
No personal income docs; deal must DSCR.
Hard money
10% down · 12.0% · 12mo
- Down + closing
- —
- Monthly P&I
- —
- Monthly cashflow
- —
- DSCR
- —
- Eligible?
- —
Short-term bridge; refi at stabilization.
Listing history 8 events
-
2026-06-21days on market $1,199,000 Active 12 DOM
-
2026-06-18days on market $1,199,000 Active 9 DOM
-
2026-06-17days on market $1,199,000 Active 8 DOM
-
2026-06-16days on market $1,199,000 Active 7 DOM
-
2026-06-15days on market $1,199,000 Active 6 DOM
-
2026-06-13days on market $1,199,000 Active 4 DOM
-
2026-06-10remarks 485-char remark
-
2026-06-10$1,199,000 Active 1 DOM
ⓘ Source: listings_history table (triggers on properties + properties_extension) + one-shot
backfill from property_details.listing_events for pre-trigger history.
Tax reassessment forecast NY · Partial reset (capped growth)
- Current annual tax
- $13,820 · $1,152/mo
- Projected year-2 tax
- $17,041 · $1,420/mo
- Expected delta
- +$3,222/yr (+$268/mo · 23.3%)
ⓘ Screening estimate from a state-policy table — verify with the county assessor before closing.
Climate risk First Street
- Flood 1/10 Low FEMA zone X (unshaded) · 0% chance over 30 yrs
- Wildfire 1/10 Low
- Heat 7/10 Severe 7 d/yr ≥99°F today · 15 d/yr by 30 yrs out
- Wind 6/10 Major 27% chance of damaging wind over 30 yrs
- Air quality 4/10 Moderate 5 unhealthy d/yr today · 6 by 30 yrs out
Nearby sold comps map
Loading sold comps map…
Walkable amenities ~0.75 mi
Loading nearby amenities…
Taxation est. · year 1
- Rental income
- $174,864
- − Mortgage interest
- −$67,163
- − Property taxes
- −$13,820
- − Insurance
- −$5,995
- − Repairs & maintenance
- −$13,989
- − Management
- −$13,989
- − Depreciation
- −$34,880
- Taxable income
- $25,028
- Est. tax owed @ 24.0%
- −$6,007
- After-tax cash flow
- $36,869/yr
For passive investors: Depreciation is non-cash, so a rental often shows a tax loss while cash-flowing — sheltering income. Rental losses are passive: they offset passive income freely, and up to $25,000/yr can offset ordinary (W-2) income if you actively participate and your MAGI is under $100k (phasing out to $0 by $150k); unused losses carry forward. On sale, claimed depreciation is recaptured at up to 25%, and gains may owe capital-gains tax (a 1031 exchange can defer both). Figures are a year-1 estimate at your 24.0% rate — not tax advice; consult a CPA.
Schools (NCES district)
No district data.
Livability — New York
- Score
- 75/100
- State rank
- #268
- US rank
- #4188
Category grades
Schools grade is shown separately in the Schools card above.
Census & demographics
- Census place
- New York, NY
- City population
- 7,731,280
- Population (ZIP)
- 49,753
Population outlook (Bronx County) Hauer SSP2
- Today (2025)
- 1,607,353 people
- By 2030
- 1,681,852 · +4.6%
- By 2040
- 1,824,421 · +13.5%
- By 2050
- 1,945,470 · +21.0%
- By 2075
- 2,187,887 · +36.1%
- By 2100
- 2,244,136 · +39.6%
Race, ethnicity, and origin ACS 2023
- Neighborhood character
- Predominantly Hispanic (66%)
- Race & ethnicity
- Hispanic / Latino 66% Black 29% Two or more races 16% White 1% Asian 1%
- Hispanic origin (detail)
- Mexican 4% Puerto Rican 22% Dominican 31%
- Common ancestry
- Hispanic 1%
- Foreign-born
- 29% · Canada
- Languages at home
- 36% English-only · Spanish 55% French/Haitian/Cajun 2% Other Indo-European 1%
Political lean MEDSL · Bronx
- 2024 margin
- Solid D (+45.4) · D 72.7% · R 27.3%
- 2008→2024 swing
- -32.3pp toward R · 2008: 77.8pp · 2024: 45.4pp
- All cycles
- 2024: D+45.4 2020: D+67.6 2016: D+79.1 2012: D+82.9 2008: D+77.8
Not yet ingested
- Civics
- —
Market trends
- HPI YoY
- ▲ 6.66%
- Current HPI
- 277.1628
- Rent YoY
- —
- Metro
- —
- State GDP YoY
- ▲ 2.60%
- F500 in state
- 92
Industry mix (Fortune 500 HQ in NY)
| Industry | F500 HQs | Revenue |
|---|---|---|
| Financial Services | 10 | $950B |
|
||
| Consumer Goods | 9 | $162B |
|
||
| Insurance | 4 | $225B |
|
||
| Telecommunications | 2 | $144B |
|
||
| Pharmaceuticals | 2 | $112B |
|
||
| Media / Entertainment | 2 | $69B |
|
||
Price history
+118.0% since first listed19 events — show timeline
- 2026-06-09 Listed $1,199,000 OneKey® MLS as Distributed by MLS Grid
- 2024-04-30 Listing Removed — OneKey® MLS as Distributed by MLS Grid
- 2024-03-28 Price Changed $985,000 OneKey® MLS as Distributed by MLS Grid
- 2024-03-27 Price Changed $925,000 OneKey® MLS as Distributed by MLS Grid
- 2024-03-24 Price Changed $850,000 OneKey® MLS as Distributed by MLS Grid
- 2024-02-15 Listed $995,000 OneKey® MLS as Distributed by MLS Grid
- 2014-01-27 Price Changed $375,000 HGMLS
- 2013-06-28 Delisted — HGMLS
- 2013-06-28 Listing Removed — OneKey® MLS as Distributed by MLS Grid
- 2013-05-28 Relisted — HGMLS
- 2013-05-07 Delisted — HGMLS
- 2012-05-06 Listed $349,000 OneKey® MLS as Distributed by MLS Grid
- 2012-05-06 Listed — HGMLS
- 2008-07-31 Delisted — HGMLS
- 2008-03-21 Listed — HGMLS
- 2007-02-08 Sold (Public Records) $550,000 Public Records
- 2007-01-31 Sold (MLS) $550,000 HGMLS
- 2006-12-19 Delisted — HGMLS
- 2006-10-18 Listed $550,000 HGMLS
Property tax history
+5.2%/yrLatest (2025): $13,820 · +57.1% YoY. Source: county tax records.
Cash-flow waterfall
monthlySold comps — $/sqft
last 12 mo · ≤1 miLoading sold comps…