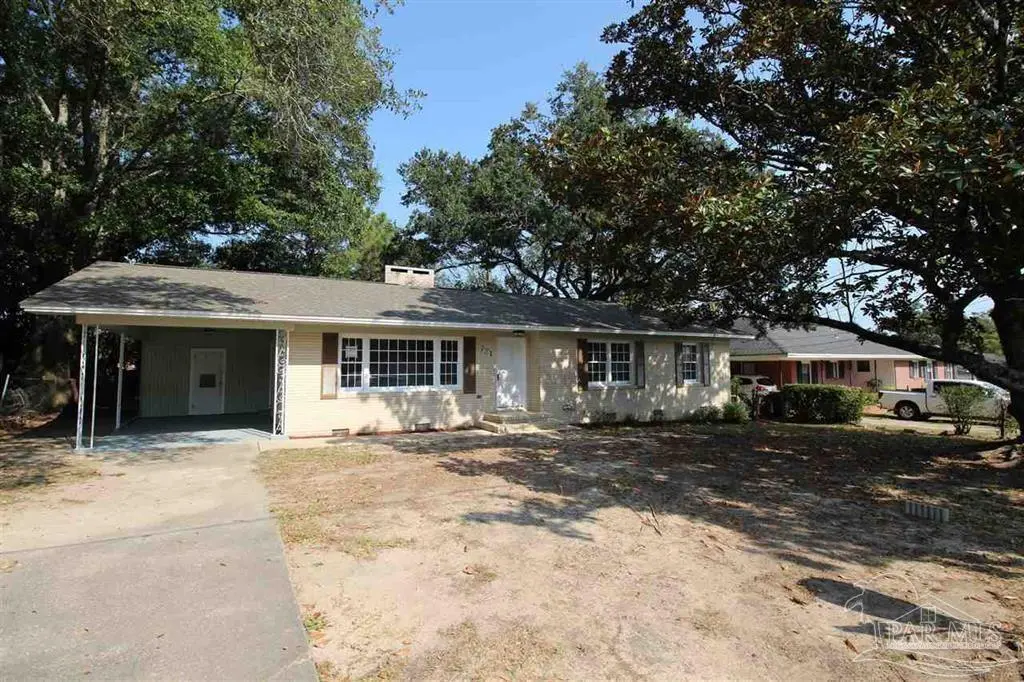
721 Gentian Dr · Pensacola, FL
Flood risk 1/10 · Minimal
- FEMA flood zone
- X (unshaded)
- Chance of flooding over 30 yrs
- 0.0%
- Est. flood insurance / yr
- $507 – $1,088
Fire risk 1/10 · Minimal
- Est. fire insurance / yr
- $947 – $1,759
Heat risk 10/10 · Severe
- Hot days now (above 105°F)
- 7 days/yr
- Hot days in 30 yrs
- 22 days/yr
Wind risk 9/10 · Severe
- Chance of severe wind over 30 yrs
- 99.0%
Air-quality risk 1/10 · Minimal
- Unhealthy air days now
- 0 days/yr
- Unhealthy air days in 30 yrs
- 0 days/yr
Risk factors via First Street. Map © Google.
Why this score? — see what drove the D- grade
The composite is a weighted blend of 9 inputs, each scored 0–100. Each bar is that input's sub-score; the figure is the points it added to the 100-point composite (weight × sub-score).
- Cash flow +13.1/30.0
- ARV discount +5.2/15.0
- Livability +4.2/5.0
- DSCR +3.9/10.0
- Schools +3.6/10.0
- 1% rule +3.3/10.0
- Rent growth +3.3/5.0
- Condition / age +2.5/5.0
- Appreciation +0.0/10.0
$219,000
🖨 Deal sheet 📄 Offer letter ✓ Due diligence
Listing remarks MLS
COMPLETELY REMODELED 3 BED 2 BATH Fireplace HOME – READY TO MOVE IN!!! With New 30yr Warranty Dimensional Shingle Roof, New 10yr Manufacturer Warranty AC System, New Paint Inside & Out, New Kitchen Cabinets & Granite Countertops, New Stainless Steel Appliances, , Fireplace, Refinished Hardwood Floors, New Carpeting, New Lighting & Fans, New Bathrooms, Peaceful Yard with Patio, there is no honey do list, just move in and relax. This home is comfortable and spacious and includes an open floor plan. Don't hesitate on this exceptional opportunity!
Key facts
- 9,583 sq ft lot
- Parking
- Built 1959
Property features AI
Finance
- HOA & community: No association
Exterior
- Parking: Carport (covered) providing 1 parking space; total 1 parking space
- Utilities: Public water; Public sewer; Electric with circuit breakers
- Home design: Single-story frame construction; One level; Resale property; Not attached to another property; Insulation as an energy efficiency feature
- Construction: Frame construction; Off-grade foundation
- Exterior features: Interior lot; Shingle roof; Paved public road access
Interior
- Kitchen: Stainless steel appliances; Dishwasher; Microwave; Refrigerator; Kitchen and dining combo
- Bedrooms: Master bedroom on the first floor (approx. 11 x 12); Second bedroom on the first floor (approx. 12 x 11); Third bedroom on the first floor (approx. 12 x 11)
- Flooring: Hardwood; Tile
- Bathrooms: Two full bathrooms on the first floor; Bathroom(s) not recently updated
- Heating & cooling: Central heating; Central air; Ceiling fan(s)
- Interior features: Hardwood and tile flooring; Updated kitchen
- Laundry & utility: Electric water heater
Neighborhood map
What this means for you Summary
Snapshot
- This is a 3-bed/2.0-bath single-family listed at $219k.
Deal economics
- At list price, monthly cash flow is $-7 ($-79/yr) — negative.
- To cash-flow at today's rent, offer at most $218k (0.5% below list).
- To meet the 1% rule (rent ≥ 1% of price), the offer needs to be $183k (16.6% below list).
- Recommended offer: $183k (16.6% below list) — sets the bar for 1% rule.
- Cap rate 6.3% vs local median 3.6% in Pensacola — top-decile yield for the area; either an underpriced asset or a hidden risk that comps aren't pricing in. Stress-test before assuming the spread holds.
Location & tenants
- Location reads 83/100 on livability (#53 in FL, #924 nationally) — a professional / high-income tenant draw. Strengths: commute A+, cost of living A+, housing A+.
- Escambia (suburban): math 40% / reading 45% proficiency, ranked #56 of 73 in FL (top 77%) — families likely to look elsewhere, expect single-tenant / working-renter base with shorter leases.
- Market conditions: Rents rising (+3.4%/yr); 240 active listings in the ZIP; 4 comparable units currently listed for rent nearby; rentals at typical pace (median 23d on market — plan ~3-4 weeks tenant-placement turnaround); 1,479 units permitted in Escambia County in 2024 (0 in 5+ unit buildings).
- This rent runs 31% of the median local income ($71k/yr) — at the standard rent-burdened threshold; future hikes will face affordability resistance.
Forward outlook
- Local home prices are declining (-3.0%/yr); year-one equity from $2k of loan paydown is wiped out by about $7k of value loss. Plan a longer hold.
- Escambia County population projected at +13% by 2050 — modest demand growth; plan on rents tracking national, not racing it.
Negotiation context
- Only 13 days on market — expect competitive offers; lowballing is unlikely to land.
- 8 sale attempts since 25y ago with the ask held roughly flat each time — persistent listings suggest the price (not the market) is what's stuck; bring a comps-based counter.
- Current owner paid $157k; 39% above their basis — modest negotiation headroom, anchor on the comps not their cost.
Risks & watch-outs
- Watch-outs: built in 1959 — expect roof / HVAC / electrical / plumbing capex.
- Climate carrying-cost: severe wind risk, 99% chance of damaging wind over 30y; extreme-heat days projected 7→22/yr by 2055 (HVAC capex compounding) — expect insurance premiums to compound above CPI over the hold.
Questions for the listing agent
- What do current leases actually rent for vs. the listed asking? Can we see a recent rent roll and the last 12 months of T-12 income?
- Built in 1959 — when were the roof, HVAC, electrical panel, plumbing, and water heater last replaced?
- Is there a deadline driving the sale (1031 exchange, divorce, estate, relocation)? That informs how much negotiation room exists.
- The area grade is low — what's the realistic commute time and amenity access for the typical tenant pool here? Any planned neighborhood developments (good or bad) we should know about?
- What's the average days-on-market for RENTAL listings here right now (not sales)? A rising rental-DOM trend means longer vacancies and softer asking-rent achievability than the comps imply.
- What's the recent tenant-quality profile in this submarket — average credit score on applications, eviction rate, late-payment / NSF rate, and stable-employment percentage? A property-management company in the area should have these aggregated.
- How much new for-sale + rental construction is in the pipeline within 1–3 miles? Heavy new supply typically softens prices + rents 12–24 months out; constrained supply supports both.
Investment metrics
- 1% rule
- 0.83% ✗
- Cap rate
- 6.26%
- Cash-on-cash
- -0.13%
- DSCR
- 0.99
- GRM
- 10.0
CMA / ARV
- ARV (on-the-fly)
- $208,208
- Comps found
- 12
Show comp detail 12 sales within ~0.75 mi
| Address | Dist | Beds/Ba | Sqft | Sold | Price | $/sf | Match |
|---|---|---|---|---|---|---|---|
| 778 Ash Dr | 0.17mi | 3/2.0 | 1,450 (-0%) | 5mo | $208,000 | $143 | 87 |
| 812 Ash Dr | 0.15mi | 3/2.0 | 1,480 (+2%) | 8mo | $167,000 | $113 | 84 |
| 704 Woodland Dr | 0.20mi | 3/2.0 | 1,357 (-7%) | 5mo | $160,000 | $118 | 75 |
| 725 Gentian Dr | 0.03mi | 3/2.0 | 1,639 (+13%) | 4mo | $100,000 | $61 | 74 |
| 241 Datura St | 0.30mi | 3/2.0 | 1,568 (+8%) | 6mo | $285,000 | $182 | 68 |
| 607 Chadwick St | 0.22mi | 4/2.0 (+1) | 1,336 (-8%) | 8mo | $215,000 | $161 | 64 |
| 715 Woodland Dr | 0.17mi | 4/2.0 (+1) | 1,622 (+11%) | 6mo | $205,000 | $126 | 63 |
| 4907 Springhill Dr | 0.65mi | 4/2.0 (+1) | 1,450 (-0%) | 2mo | $234,900 | $162 | 62 |
| 196 Highland Dr | 0.55mi | 4/2.0 (+1) | 1,482 (+2%) | 8mo | $200,000 | $135 | 60 |
| 175 Mango St | 0.34mi | 3/1.0 | 1,300 (-11%) | 6mo | $224,500 | $173 | 57 |
| 4929 Springhill Dr | 0.63mi | 2/2.0 (-1) | 1,352 (-7%) | 6mo | $105,000 | $78 | 49 |
| 1100 Barcia Dr | 0.72mi | 4/2.0 (+1) | 1,660 (+14%) | 6mo | $240,000 | $145 | 33 |
Match score weights: distance 35% · size 25% · config 20% · recency 20%. Top-matched comps best support the ARV.
Projected returns pro-forma
-3.0% appreciation · 3.39% rent growth · sell at horizon
- IRR
- -16.1%
- Equity multiple
- 0.43×
- Total profit
- $-35,198
- Equity at exit
- $32,654
- IRR
- -7.1%
- Equity multiple
- 0.54×
- Total profit
- $-28,261
- Equity at exit
- $18,935
Cash invested: $61,320 (down + closing). Projections, not guarantees.
Landlord ↔ Tenant lean methodology
- Overall (STATE)
- 87 Strongly Landlord-Friendly
- State Florida
- 87 Strongly Landlord-Friendly · R+3
- County
- — inherits STATE
- City
- — inherits STATE
ZIP-level market 32503
- Rents YoY
- 3.4%
- Active inventory
- 240
- Price-to-rent
- 10.0×
Monthly cashflow live
- Estimated rent
- $1,827 medium interval (Pro) →
- Mortgage (P&I)
- −$1,148
- Tax from tax record
- −$210 /mo · $2,519/yr
- Insurance
- −$91
- HOA
- −$0
- Vacancy / Maint / Mgmt
- −$384
- Net cashflow
- $-7
Break-even live
UW: 25.0% down · 7.5% · 30yr · 1.5% tax · 5.0% vac · 8.0% maint · 8.0% mgmt
Financing live
Cash to close
- Down payment
- $54,750
- Closing costs
- $6,570
- Reserves months
- —
- Total cash needed
- —
Loan-product check · same deal, 3 products live
Conventional
25% down · 7.5% · 30yr
- Down + closing
- —
- Monthly P&I
- —
- Monthly cashflow
- —
- DSCR
- —
- Eligible?
- —
Personal DTI + credit; lowest rate.
DSCR
20% down · 8.5% · 30yr
- Down + closing
- —
- Monthly P&I
- —
- Monthly cashflow
- —
- DSCR
- —
- Eligible?
- —
No personal income docs; deal must DSCR.
Hard money
10% down · 12.0% · 12mo
- Down + closing
- —
- Monthly P&I
- —
- Monthly cashflow
- —
- DSCR
- —
- Eligible?
- —
Short-term bridge; refi at stabilization.
Rent comps 4 comps
| Address | Beds | Baths | Sqft | Rent | $/sqft | DOM | Units | Dist |
|---|---|---|---|---|---|---|---|---|
| 4400 N 9th Ave Pensacola, FL | 3.0 | 1.5 | 1713 | $2,000 | $1.17 | 23d | 1 | 0.22mi |
| 531 Ditmar St Unit B Pensacola, FL | 2.0 | 1.0 | 1094 | $1,450 | $1.33 | 23d | 1 | 0.36mi |
| 538 Royce St Unit 1A Pensacola, FL | 2.0 | 1.0 | 1000 | $1,425 | $1.43 | 23d | 1 | 0.57mi |
| 3131 N 10th Ave Pensacola, FL | 3.0 | 1.5 | 1085 | $1,700 | $1.57 | 23d | 1 | 1.15mi |
Listing history 30 events
-
2026-06-18days on market $219,000 Active 13 DOM
-
2026-06-17days on market $219,000 Active 12 DOM
-
2026-06-16pricedays on market $219,000 Active 11 DOM
-
2026-06-15days on market $229,000 Active 10 DOM
-
2026-06-14days on market $229,000 Active 8 DOM
-
2026-06-10days on market $229,000 Active 5 DOM
-
2026-06-09days on market $229,000 Active 4 DOM
-
2026-06-08days on market $229,000 Active 3 DOM
-
2026-06-07statusdays on market $229,000 Active 2 DOM
-
2026-06-03remarks 699-char remark
-
2026-06-03pricestatusdays on market $229,000 Coming Soon 1 DOM
-
2026-05-18price $209,000 991-char remark
-
2026-05-11$217,000 Active 991-char remark
-
2020-01-21soldstatus $157,000
-
2020-01-15soldstatus $157,000 567-char remark
Show marketing remark (567 chars)
COMPLETELY REMODELED 3 BED 2 BATH Fireplace HOME – READY TO MOVE IN!!! With New 30yr Warranty Dimensional Shingle Roof, New 10yr Manufacturer Warranty AC System, New Paint Inside & Out, New Kitchen Cabinets & Granite Countertops, New Stainless Steel Appliances, , Fireplace, Refinished Hardwood Floors, New Carpeting, New Lighting & Fans, New Bathrooms, Peaceful Yard with Patio, there is no honey do list, just move in and relax. This home is comfortable and spacious and includes an open floor plan. Don't hesitate on this exceptional opportunity!
-
2019-10-16$159,900 567-char remark
Show marketing remark (567 chars)
COMPLETELY REMODELED 3 BED 2 BATH Fireplace HOME – READY TO MOVE IN!!! With New 30yr Warranty Dimensional Shingle Roof, New 10yr Manufacturer Warranty AC System, New Paint Inside & Out, New Kitchen Cabinets & Granite Countertops, New Stainless Steel Appliances, , Fireplace, Refinished Hardwood Floors, New Carpeting, New Lighting & Fans, New Bathrooms, Peaceful Yard with Patio, there is no honey do list, just move in and relax. This home is comfortable and spacious and includes an open floor plan. Don't hesitate on this exceptional opportunity!
-
2018-05-10historical
-
2018-02-06$80,000
-
2006-07-25soldstatus $105,000
-
2006-07-20soldstatus $105,000
-
2006-06-01$117,000
-
2006-02-27soldstatus $91,400
-
2006-02-17soldstatus $91,400
-
2006-01-10$91,900
-
2002-08-16soldstatus $52,000
-
2002-08-01soldstatus $52,000
-
2002-06-20$59,900
-
2001-10-20historical
-
2001-07-13$64,900
-
1976-01-01soldstatus $26,400
ⓘ Source: listings_history table (triggers on properties + properties_extension) + one-shot
backfill from property_details.listing_events for pre-trigger history.
Tax reassessment forecast FL · Resets to sale price
- Current annual tax
- $2,519 · $210/mo
- Projected year-2 tax
- $2,519 · $210/mo
- Expected delta
- $0/yr ($0/mo · 0.0%)
ⓘ Screening estimate from a state-policy table — verify with the county assessor before closing.
Climate risk First Street
- Flood 1/10 Low FEMA zone X (unshaded) · 0% chance over 30 yrs
- Wildfire 1/10 Low
- Heat 10/10 Extreme 7 d/yr ≥105°F today · 22 d/yr by 30 yrs out
- Wind 9/10 Extreme 99% chance of damaging wind over 30 yrs
- Air quality 1/10 Low 0 unhealthy d/yr today · 0 by 30 yrs out
Nearby sold comps map
Loading sold comps map…
Walkable amenities ~0.75 mi
Loading nearby amenities…
Taxation est. · year 1
- Rental income
- $21,920
- − Mortgage interest
- −$12,267
- − Property taxes
- −$2,519
- − Insurance
- −$1,095
- − Repairs & maintenance
- −$1,754
- − Management
- −$1,754
- − Depreciation
- −$6,371
- Taxable loss
- −$3,840
- Est. tax savings @ 24.0%
- +$922
- After-tax cash flow
- $843/yr
For passive investors: Depreciation is non-cash, so a rental often shows a tax loss while cash-flowing — sheltering income. Rental losses are passive: they offset passive income freely, and up to $25,000/yr can offset ordinary (W-2) income if you actively participate and your MAGI is under $100k (phasing out to $0 by $150k); unused losses carry forward. On sale, claimed depreciation is recaptured at up to 25%, and gains may owe capital-gains tax (a 1031 exchange can defer both). Figures are a year-1 estimate at your 24.0% rate — not tax advice; consult a CPA.
Schools (NCES district)
- District
- Escambia
- NCES district ID
- 1200510
- Math proficiency
- 40% ▼ -9.00%
- Reading proficiency
- 45% ▼ -4.00%
- Median HH income
- $44,649
- Composite
- 36.04/100
- National rank
- #4773
- State rank
- #56 of 73 in FL
Livability — Pensacola
- Score
- 83/100
- State rank
- #53
- US rank
- #924
Category grades
Schools grade is shown separately in the Schools card above.
Census & demographics
- Census place
- Pensacola, FL
- County
- Escambia County · 301,722 people
- City population
- 237,636
- Metro
- Pensacola-Ferry Pass-Brent, FL
- Population (ZIP)
- 33,559
- Household income
- $71,411
- Rent vs Own
- Severe rent burden
- 948.0
Population outlook (Escambia County) Hauer SSP2
- Today (2025)
- 334,637 people
- By 2030
- 345,779 · +3.3%
- By 2040
- 364,828 · +9.0%
- By 2050
- 378,514 · +13.1%
- By 2075
- 403,220 · +20.5%
- By 2100
- 386,125 · +15.4%
Race, ethnicity, and origin ACS 2023
- Neighborhood character
- Predominantly White (68%)
- Race & ethnicity
- White 68% Black 20% Two or more races 6% Hispanic / Latino 5% Asian 2%
- Common ancestry
- Lithuanian 3% Italian 2% Romanian 2%
- Foreign-born
- 5% · Canada, China
- Languages at home
- 93% English-only · Spanish 3% Arabic 1% Tagalog/Filipino 1%
Political lean MEDSL · Escambia
- 2024 margin
- R (+19.5) · D 39.7% · R 59.2% · Other 1.1%
- 2008→2024 swing
- -0.2pp no change · 2008: -19.3pp · 2024: -19.5pp
- All cycles
- 2024: R+19.5 2020: R+15.1 2016: R+20.6 2012: R+20.6 2008: R+19.3
Not yet ingested
- Civics
- —
Market trends
- HPI YoY
- ▼ -300.02%
- Current HPI
- 294.4873
- Rent YoY
- ▲ 3.39%
- Metro
- Pensacola-Ferry Pass-Brent, FL
- State GDP YoY
- ▲ 3.28%
- F500 in state
- 36
Industry mix (Fortune 500 HQ in FL)
| Industry | F500 HQs | Revenue |
|---|---|---|
| Industrial Technology | 2 | $29B |
|
||
| Insurance | 2 | $17B |
|
||
| Retail | 1 | $60B |
|
||
| Technology Distribution | 1 | $58B |
|
||
| Homebuilding | 1 | $35B |
|
||
| Technology Manufacturing | 1 | $35B |
|
||
Price history
+729.5% since first listed24 events — show timeline
- 2026-06-16 Price Changed $219,000 PARMLS
- 2026-06-05 Listed $229,000 PARMLS
- 2026-06-02 Coming Soon $229,000 PARMLS
- 2026-05-29 Listing Removed — PARMLS
- 2026-05-22 Price Changed $205,000 PARMLS
- 2026-05-18 Price Changed $209,000 PARMLS
- 2026-05-11 Listed $217,000 PARMLS
- 2020-01-21 Sold (Public Records) $157,000 Public Records
- 2020-01-15 Sold (MLS) $157,000 PARMLS
- 2019-10-16 Listed $159,900 PARMLS
- 2018-05-10 Listing Removed — PARMLS
- 2018-02-06 Listed $80,000 PARMLS
- 2006-07-25 Sold (Public Records) $105,000 Public Records
- 2006-07-20 Sold (MLS) $105,000 PARMLS
- 2006-06-01 Listed $117,000 PARMLS
- 2006-02-27 Sold (Public Records) $91,400 Public Records
- 2006-02-17 Sold (MLS) $91,400 PARMLS
- 2006-01-10 Listed $91,900 PARMLS
- 2002-08-16 Sold (MLS) $52,000 PARMLS
- 2002-08-01 Sold (Public Records) $52,000 Public Records
- 2002-06-20 Listed $59,900 PARMLS
- 2001-10-20 Listing Removed — PARMLS
- 2001-07-13 Listed $64,900 PARMLS
- 1976-01-01 Sold (Public Records) $26,400 Public Records
Property tax history
+14.0%/yrLatest (2025): $2,519 · +4.7% YoY. Source: county tax records.
Cash-flow waterfall
monthlySold comps — $/sqft
last 12 mo · ≤1 miLoading sold comps…