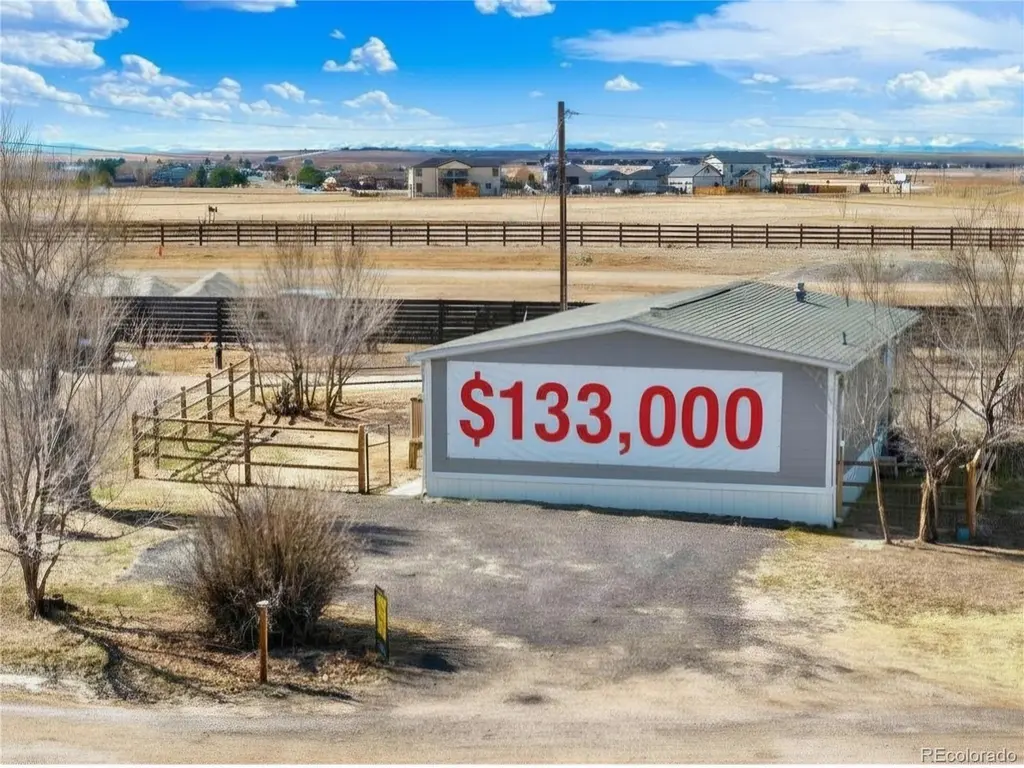
1191 N County Road 157 Lot #1 · Strasburg, CO
Flood risk No data
- FEMA flood zone
- —
- Chance of flooding over 30 yrs
- —
- Est. flood insurance / yr
- —
Fire risk No data
- Est. fire insurance / yr
- —
Heat risk No data
- Hot days now (above threshold)
- —
- Hot days in 30 yrs
- —
Wind risk No data
- Chance of severe wind over 30 yrs
- —
Air-quality risk No data
- Unhealthy air days now
- —
- Unhealthy air days in 30 yrs
- —
Risk factors via First Street. Map © Google.
Why this score? — see what drove the B- grade
The composite is a weighted blend of 9 inputs, each scored 0–100. Each bar is that input's sub-score; the figure is the points it added to the 100-point composite (weight × sub-score).
- Cash flow +28.2/30.0
- 1% rule +10.0/10.0
- DSCR +10.0/10.0
- ARV discount +7.5/15.0
- Schools +4.1/10.0
- Livability +3.0/5.0
- Rent growth +2.5/5.0
- Condition / age +2.5/5.0
- Appreciation +0.0/10.0
$133,000
🖨 Deal sheet 📄 Offer letter ✓ Due diligence
Listing remarks
Tucked into a quiet corner of a small, well-kept park, this manufactured home feels like a hidden gem – offering the perfect blend of privacy, comfort and appeal. A quaint front porch invites slow mornings with coffee and calm evenings under the Colorado sunset skies. Inside, natural light pours through the windows, highlighting an inviting layout that makes the space feel both open and intimate. Perfectly sized, ideally located, beautifully maintained and full of upgrades too numerous to list. This adorable home is everything a homeowner dreams of – simple, serene and undeniably special.
Key facts
- 4,356 sq ft lot
- 2 parking spots
- Built 2016
Property features AI
Finance
- Other: Paved public road frontage with private road maintenance
- Financial info: Land lease in effect (monthly $800) through January 1, 2027
- HOA & community: Park: Galbraith Estates Mobile Home Park (self-managed); Monthly lot/association fee $800 (includes water and sewer); Association: Galbraith Family LLP
Exterior
- Parking: 2 parking spaces (off-street); Gravel parking
- Utilities: Electricity connected; Natural gas connected; Community sewer; Private water
- Home design: Manufactured home in park; Faces south; Individual ownership
- Construction: Wood siding; Composition roof; Metal skirting; Mobile home dimensions: 44' x 28'
- Exterior features: Private yard; Full fencing; Rain gutters; Deck
Interior
- Kitchen: Eat-in kitchen
- Bedrooms: 3 bedrooms (all on main level)
- Flooring: Carpet; Linoleum
- Bathrooms: 2 full bathrooms (both on main level)
- Heating & cooling: Forced air heating; Central air conditioning
- Interior features: Eat-in kitchen; Open floor plan; Primary suite; Vaulted ceilings; Walk-in closet(s); Double pane windows
- Laundry & utility: Main level laundry
Neighborhood map
What this means for you Summary
Snapshot
- This is a 2-bed/2.0-bath single-family listed at $133k.
Deal economics
- At list price, monthly cash flow is $420 ($5k/yr) — positive.
- The deal already cash-flows at list — no discount required.
- Meets the 1% rule at list price ($3k rent vs $133k).
- Recommended offer: $121k (9.0% below list) — sets the bar for market timing.
- Cap rate 10.1% vs local median 4.4% in Strasburg — top-decile yield for the area; either an underpriced asset or a hidden risk that comps aren't pricing in. Stress-test before assuming the spread holds.
Location & tenants
- Location reads 60/100 on livability (#238 in CO) — a middle-class / working-renter tenant base. Strengths: housing A+, crime A, employment A; Watch: amenities F, commute F, cost of living F.
- Strasburg School District 31J (rural): math 36% / reading 47% proficiency, ranked #32 of 176 in CO (top 18%) — families likely to look elsewhere, expect single-tenant / working-renter base with shorter leases; only 17% free/reduced lunch — higher-income household profile.
- Zoned schools: Strasburg Elementary School (math 30% / reading 42%, grade F, #420 of 966 statewide, top 44%, 562 students, 33% FRL); Hemphill Middle School (math 24% / reading 34%, grade F, #129 of 270 statewide, top 51%, 255 students, 36% FRL); Strasburg High School (math 27% / reading 67%, grade D-, #132 of 381 statewide, top 36%, 379 students, 29% FRL) — zoned schools average 33% FRL vs 17% district-wide (16 pts higher); higher-poverty schools than district average — tighter screening recommended.
- Market conditions: 118 active listings in the ZIP; 3,927 units permitted in Arapahoe County in 2024 (1,525 in 5+ unit buildings).
Forward outlook
- Local home prices are declining (-3.0%/yr); year-one equity from $920 of loan paydown is wiped out by about $4k of value loss. Plan a longer hold.
- Arapahoe County population projected at +39% by 2050 — long-run rental-demand tailwind backs the buy-and-hold thesis.
- At projected returns (-3.0% appreciation + 3.0% rent growth), your $37k cash investment doubles in ~9 years — after that, you're playing with house money.
Negotiation context
- It's been on market 92 days — a 9% lower offer ($121k) is reasonable based on typical stale-listing flexibility.
Risks & watch-outs
- Watch-outs: HOA is 32% of rent.
Questions for the listing agent
- It's been on market 92 days. Have you received any prior offers? Is the seller open to a 9% concession, seller financing, or rate buy-down credit?
- What does the HOA fee cover, when was the last increase, and are there any pending special assessments or reserve-fund shortfalls?
- Why hasn't it sold? Are there any deal-killer items the seller is aware of (foundation, flood, title, zoning, code violations)?
- Is there a deadline driving the sale (1031 exchange, divorce, estate, relocation)? That informs how much negotiation room exists.
- What's the average days-on-market for RENTAL listings here right now (not sales)? A rising rental-DOM trend means longer vacancies and softer asking-rent achievability than the comps imply.
- What's the recent tenant-quality profile in this submarket — average credit score on applications, eviction rate, late-payment / NSF rate, and stable-employment percentage? A property-management company in the area should have these aggregated.
- How much new for-sale + rental construction is in the pipeline within 1–3 miles? Heavy new supply typically softens prices + rents 12–24 months out; constrained supply supports both.
Investment metrics
- 1% rule
- 1.91% ✓
- Cap rate
- 10.08%
- Cash-on-cash
- 13.53%
- DSCR
- 1.60
- GRM
- 4.4
CMA / ARV
- ARV (on-the-fly)
- $402,864
- Comps found
- 2
Show comp detail 2 sales within ~0.75 mi
| Address | Dist | Beds/Ba | Sqft | Sold | Price | $/sf | Match |
|---|---|---|---|---|---|---|---|
| 1716 Main St | 0.66mi | 3/2.0 (+1) | 1,208 (-2%) | 17mo | $395,000 | $327 | 47 |
| 1754 Adams St | 0.69mi | 1/2.0 (-1) | 1,100 (-11%) | 21mo | $315,000 | $286 | 28 |
Match score weights: distance 35% · size 25% · config 20% · recency 20%. Top-matched comps best support the ARV.
Projected returns pro-forma
-3.0% appreciation · 3.0% rent growth · sell at horizon
- IRR
- 3.9%
- Equity multiple
- 1.15×
- Total profit
- $5,647
- Equity at exit
- $19,831
- IRR
- 13.7%
- Equity multiple
- 2.11×
- Total profit
- $41,178
- Equity at exit
- $11,499
Cash invested: $37,240 (down + closing). Projections, not guarantees.
Landlord ↔ Tenant lean methodology
- Overall (STATE)
- 38 Tenant-Leaning
- State Colorado
- 38 Tenant-Leaning · D+4
- County
- — inherits STATE
- City
- — inherits STATE
ZIP-level market 80136
- Home prices YoY
- -27.2%
- Active inventory
- 118
- Price-to-rent
- 4.4×
Monthly cashflow live
- Estimated rent
- $2,536 medium interval (Pro) →
- Mortgage (P&I)
- −$697
- Tax from tax record
- −$30 /mo · $362/yr
- Insurance
- −$55
- HOA
- −$800
- Vacancy / Maint / Mgmt
- −$532
- Net cashflow
- $420
Break-even live
UW: 25.0% down · 7.5% · 30yr · 1.5% tax · 5.0% vac · 8.0% maint · 8.0% mgmt
Financing live
Cash to close
- Down payment
- $33,250
- Closing costs
- $3,990
- Reserves months
- —
- Total cash needed
- —
Loan-product check · same deal, 3 products live
Conventional
25% down · 7.5% · 30yr
- Down + closing
- —
- Monthly P&I
- —
- Monthly cashflow
- —
- DSCR
- —
- Eligible?
- —
Personal DTI + credit; lowest rate.
DSCR
20% down · 8.5% · 30yr
- Down + closing
- —
- Monthly P&I
- —
- Monthly cashflow
- —
- DSCR
- —
- Eligible?
- —
No personal income docs; deal must DSCR.
Hard money
10% down · 12.0% · 12mo
- Down + closing
- —
- Monthly P&I
- —
- Monthly cashflow
- —
- DSCR
- —
- Eligible?
- —
Short-term bridge; refi at stabilization.
HOA detail
- Monthly dues
- $800 · $9,600/yr
Listing history 17 events
-
2026-06-18days on market $133,000 Active 92 DOM
-
2026-06-17days on market $133,000 Active 91 DOM
-
2026-06-16days on market $133,000 Active 90 DOM
-
2026-06-15days on market $133,000 Active 89 DOM
-
2026-06-13days on market $133,000 Active 87 DOM
-
2026-06-12days on market $133,000 Active 86 DOM
-
2026-06-09days on market $133,000 Active 83 DOM
-
2026-06-08days on market $133,000 Active 82 DOM
-
2026-06-07days on market $133,000 Active 81 DOM
-
2026-06-05days on market $133,000 Active 79 DOM
-
2026-06-04days on market $133,000 Active 77 DOM
-
2026-06-02days on market $133,000 Active 76 DOM
-
2026-06-01days on market $133,000 Active 75 DOM
-
2026-05-31days on market $133,000 Active 74 DOM
-
2026-05-31days on market $133,000 Active 73 DOM
-
2026-05-13price $143,000
-
2026-03-18$150,000 Active
ⓘ Source: listings_history table (triggers on properties + properties_extension) + one-shot
backfill from property_details.listing_events for pre-trigger history.
Tax reassessment forecast CO · Resets to sale price
- Current annual tax
- $362 · $30/mo
- Projected year-2 tax
- $732 · $61/mo
- Expected delta
- +$370/yr (+$31/mo · 102.2%)
ⓘ Screening estimate from a state-policy table — verify with the county assessor before closing.
Nearby sold comps map
Loading sold comps map…
Walkable amenities ~0.75 mi
Loading nearby amenities…
Taxation est. · year 1
- Rental income
- $30,426
- − Mortgage interest
- −$7,450
- − Property taxes
- −$362
- − Insurance
- −$665
- − Repairs & maintenance
- −$2,434
- − Management
- −$2,434
- − HOA
- −$9,600
- − Depreciation
- −$3,869
- Taxable income
- $3,612
- Est. tax owed @ 24.0%
- −$867
- After-tax cash flow
- $4,173/yr
For passive investors: Depreciation is non-cash, so a rental often shows a tax loss while cash-flowing — sheltering income. Rental losses are passive: they offset passive income freely, and up to $25,000/yr can offset ordinary (W-2) income if you actively participate and your MAGI is under $100k (phasing out to $0 by $150k); unused losses carry forward. On sale, claimed depreciation is recaptured at up to 25%, and gains may owe capital-gains tax (a 1031 exchange can defer both). Figures are a year-1 estimate at your 24.0% rate — not tax advice; consult a CPA.
Schools (NCES district)
- District
- Strasburg School District 31J
- NCES district ID
- 0806750
- Math proficiency
- 36% ▼ -2.00%
- Reading proficiency
- 47% ▲ 2.00%
- Median HH income
- $75,620
- Composite
- 40.53/100
- National rank
- #7681
- State rank
- #32 of 176 in CO
Livability — Strasburg
- Score
- 60/100
- State rank
- #238
- US rank
- #18619
Category grades
Schools grade is shown separately in the Schools card above.
Census & demographics
- Census place
- Strasburg, CO
- Population (ZIP)
- 5,965
Population outlook (Arapahoe County) Hauer SSP2
- Today (2025)
- 757,407 people
- By 2030
- 819,724 · +8.2%
- By 2040
- 940,367 · +24.2%
- By 2050
- 1,053,720 · +39.1%
- By 2075
- 1,297,693 · +71.3%
- By 2100
- 1,412,796 · +86.5%
Race, ethnicity, and origin ACS 2023
- Neighborhood character
- Predominantly White (72%)
- Race & ethnicity
- White 72% Hispanic / Latino 20% Two or more races 12% Black 1%
- Hispanic origin (detail)
- Mexican 19%
- Common ancestry
- Slovak 4% Lithuanian 4% Portuguese 2%
- Foreign-born
- 4% · Canada
- Languages at home
- 91% English-only · Spanish 9%
Political lean MEDSL · Arapahoe
- 2024 margin
- Strong D (+20.1) · D 58.6% · R 38.5% · Other 2.9%
- 2008→2024 swing
- +7.2pp toward D · 2008: 12.9pp · 2024: 20.1pp
- All cycles
- 2024: D+20.1 2020: D+24.6 2016: D+13.8 2012: D+8.3 2008: D+12.9
Not yet ingested
- Civics
- —
Market trends
- HPI YoY
- ▼ -105.51%
- Current HPI
- 282.5881
- Rent YoY
- —
- Metro
- —
- State GDP YoY
- ▲ 1.95%
- F500 in state
- 14
Industry mix (Fortune 500 HQ in CO)
| Industry | F500 HQs | Revenue |
|---|---|---|
| Technology Distribution | 1 | $31B |
|
||
| Food / Agriculture | 1 | $18B |
|
||
| Packaging | 1 | $14B |
|
||
| Healthcare | 1 | $13B |
|
||
| Energy | 1 | $10B |
|
||
| Technology | 1 | $4B |
|
||
Price history
-4.7% since first listed2 events — show timeline
- 2026-05-13 Price Changed $143,000 REColorado as Distributed by MLS Grid
- 2026-03-18 Listed $150,000 REColorado as Distributed by MLS Grid
Property tax history
-0.4%/yrLatest (2025): $362 · +4.7% YoY. Source: county tax records.
Cash-flow waterfall
monthlySold comps — $/sqft
last 12 mo · ≤1 miLoading sold comps…