318 W Fairview Ave · Eddyville, KY
Flood risk 1/10 · Minimal
- FEMA flood zone
- X (unshaded)
- Chance of flooding over 30 yrs
- 0.0%
- Est. flood insurance / yr
- $473 – $860
Fire risk 3/10 · Minor
- Est. fire insurance / yr
- $839 – $1,559
Heat risk 5/10 · Moderate
- Hot days now (above 109°F)
- 7 days/yr
- Hot days in 30 yrs
- 20 days/yr
Wind risk 3/10 · Minor
- Chance of severe wind over 30 yrs
- 6.0%
Air-quality risk 2/10 · Minimal
- Unhealthy air days now
- 1 days/yr
- Unhealthy air days in 30 yrs
- 1 days/yr
Risk factors via First Street. Map © Google.
Why this score? — see what drove the D+ grade
The composite is a weighted blend of 9 inputs, each scored 0–100. Each bar is that input's sub-score; the figure is the points it added to the 100-point composite (weight × sub-score).
- Cash flow +15.0/30.0
- ARV discount +7.5/15.0
- 1% rule +5.0/10.0
- DSCR +5.0/10.0
- Schools +4.1/10.0
- Livability +3.5/5.0
- Rent growth +2.5/5.0
- Condition / age +2.5/5.0
- Appreciation +0.0/10.0
$35,000
🖨 Deal sheet 📄 Offer letter ✓ Due diligence
Listing remarks
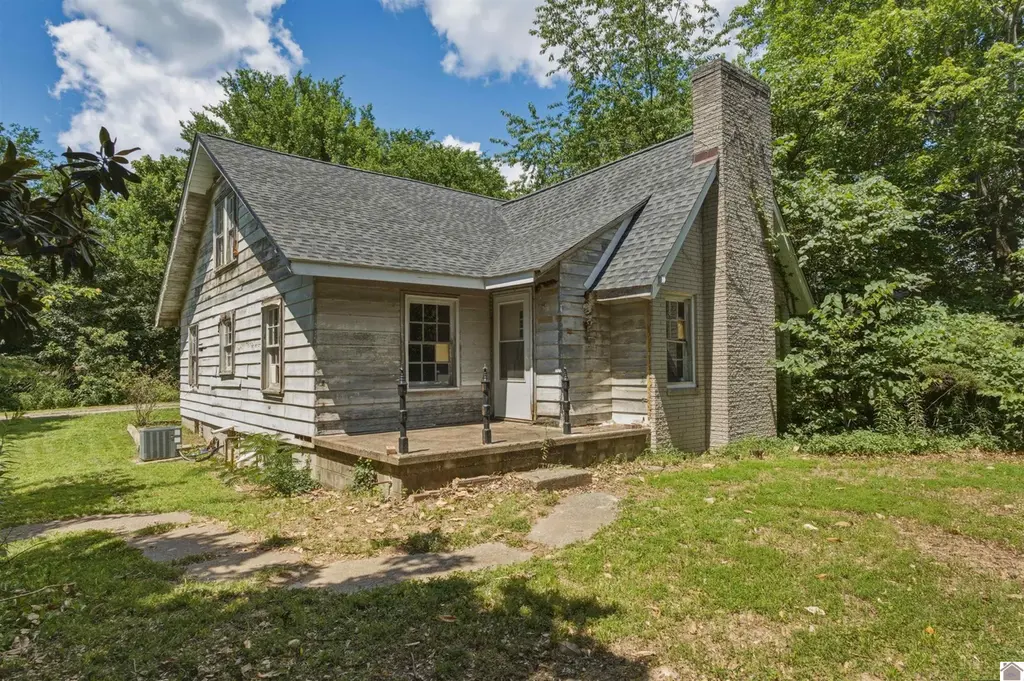
Opportunity awaits with this 4-bedroom, 1-bath home situated on a corner lot within the city limits of Eddyville near Lake Barkley. Enjoy an unbeatable location just 0.3 miles from Lyon County schools and within walking distance of the courthouse, grocery store, Ace Hardware, Venture River Water Park, restaurants, and other local amenities. Outdoor recreation is nearby with the city pool, tennis courts, and pickleball courts just 1 mile away, and Hubby's Marina only 3 miles from the property. The home is located in a golf cart friendly neighborhood. Whether you're looking for an investment opportunity, a renovation project, or a place to create your dream home, this property offers endless
Key facts
- Unbeatable location
- Corner lot
- 0.39 acre lot
Tags
Property features AI
Exterior
- Parking: Detached 1-car garage
- Utilities: Public water; Public sewer
- Home design: Single-family residential property
- Construction: Block construction; Composition roof
- Exterior features: Corner lot
Interior
- Kitchen: Refrigerator; Cooktop
- Flooring: Wood flooring
- Bathrooms: 1 full bathroom
- Heating & cooling: Electric heating; Central air conditioning
- Interior features: Living room fireplace; Unfinished basement
Neighborhood map
What this means for you Summary
Snapshot
- This is a 4-bed/2.0-bath single-family listed at $35k.
Deal economics
- At list price, monthly cash flow is $2k ($20k/yr) — positive.
- The deal already cash-flows at list — no discount required.
- Meets the 1% rule at list price ($2k rent vs $35k).
- Cap rate 62.0% vs local median 3.7% in Eddyville — top-decile yield for the area; either an underpriced asset or a hidden risk that comps aren't pricing in. Stress-test before assuming the spread holds.
Location & tenants
- Location reads 69/100 on livability (#174 in KY) — a middle-class / working-renter tenant base. Strengths: crime A+, cost of living A+, housing A; Watch: amenities F, commute F, employment F.
- Lyon County (rural): math 45% / reading 52% proficiency, ranked #13 of 165 in KY (top 8%) — families likely to look elsewhere, expect single-tenant / working-renter base with shorter leases.
- Zoned schools: Lyon County Elementary School (math 42% / reading 57%, grade D, #100 of 676 statewide, top 16%, 457 students, 58% FRL); Lyon County Middle School (math 51% / reading 54%, grade C+, #16 of 217 statewide, top 7%, 243 students, 51% FRL); Lyon County High School (math 32% / reading 37%, grade F, #76 of 254 statewide, top 34%, 298 students, 46% FRL).
- Market conditions: 117 active listings in the ZIP; 3 units permitted in Lyon County in 2024 (0 in 5+ unit buildings).
Forward outlook
- Local home prices are declining (-3.0%/yr); year-one equity from $242 of loan paydown is wiped out by about $1k of value loss. Plan a longer hold.
- Lyon County population projected to shrink 3% by 2050 — rents likely to lag national; underwrite the cash flow, not the appreciation.
- At projected returns (-3.0% appreciation + 3.0% rent growth), your $10k cash investment doubles in ~1 year — after that, you're playing with house money.
Negotiation context
- Only 1 days on market — expect competitive offers; lowballing is unlikely to land.
Risks & watch-outs
- Watch-outs: built in 1920 — expect roof / HVAC / electrical / plumbing capex.
- Climate carrying-cost: extreme-heat days projected 7→20/yr by 2055 (HVAC capex compounding) — expect insurance premiums to compound above CPI over the hold.
Questions for the listing agent
- Built in 1920 — when were the roof, HVAC, electrical panel, plumbing, and water heater last replaced?
- Is there a deadline driving the sale (1031 exchange, divorce, estate, relocation)? That informs how much negotiation room exists.
- Schools are D-rated, which usually means shorter tenancies and higher turnover. Who's the typical renter profile here, and what's been the actual vacancy rate?
- The area grade is low — what's the realistic commute time and amenity access for the typical tenant pool here? Any planned neighborhood developments (good or bad) we should know about?
- What's the average days-on-market for RENTAL listings here right now (not sales)? A rising rental-DOM trend means longer vacancies and softer asking-rent achievability than the comps imply.
- What's the recent tenant-quality profile in this submarket — average credit score on applications, eviction rate, late-payment / NSF rate, and stable-employment percentage? A property-management company in the area should have these aggregated.
- How much new for-sale + rental construction is in the pipeline within 1–3 miles? Heavy new supply typically softens prices + rents 12–24 months out; constrained supply supports both.
Investment metrics
- 1% rule
- 6.79% ✓
- Cap rate
- 62.05%
- Cash-on-cash
- 199.13%
- DSCR
- 9.86
- GRM
- 1.2
CMA / ARV
- ARV (on-the-fly)
- $192,780
- Comps found
- 2
Show comp detail 2 sales within ~0.75 mi
| Address | Dist | Beds/Ba | Sqft | Sold | Price | $/sf | Match |
|---|---|---|---|---|---|---|---|
| 408 Jenkins Rd | 0.57mi | 4/2.5 | 2,401 (-13%) | 8mo | $155,000 | $65 | 43 |
| 203 Park Ave | 0.64mi | 4/2.5 | 2,900 (+5%) | 23mo | $204,000 | $70 | 40 |
Match score weights: distance 35% · size 25% · config 20% · recency 20%. Top-matched comps best support the ARV.
Projected returns pro-forma
-3.0% appreciation · 3.0% rent growth · sell at horizon
- IRR
- —
- Equity multiple
- 10.99×
- Total profit
- $97,946
- Equity at exit
- $5,219
- IRR
- —
- Equity multiple
- 23.33×
- Total profit
- $218,830
- Equity at exit
- $3,026
Cash invested: $9,800 (down + closing). Projections, not guarantees.
Landlord ↔ Tenant lean methodology
- Overall (STATE)
- 83 Strongly Landlord-Friendly
- State Kentucky
- 83 Strongly Landlord-Friendly · R+16
- County
- — inherits STATE
- City
- — inherits STATE
ZIP-level market 42038
- Home prices YoY
- -30.7%
- Active inventory
- 117
- Price-to-rent
- 1.2×
Monthly cashflow live
- Estimated rent
- $2,377 medium interval (Pro) →
- Mortgage (P&I)
- −$184
- Tax from tax record
- −$53 /mo · $641/yr
- Insurance
- −$15
- HOA
- −$0
- Vacancy / Maint / Mgmt
- −$499
- Net cashflow
- $1,626
Break-even live
UW: 25.0% down · 7.5% · 30yr · 1.5% tax · 5.0% vac · 8.0% maint · 8.0% mgmt
Financing live
Cash to close
- Down payment
- $8,750
- Closing costs
- $1,050
- Reserves months
- —
- Total cash needed
- —
Loan-product check · same deal, 3 products live
Conventional
25% down · 7.5% · 30yr
- Down + closing
- —
- Monthly P&I
- —
- Monthly cashflow
- —
- DSCR
- —
- Eligible?
- —
Personal DTI + credit; lowest rate.
DSCR
20% down · 8.5% · 30yr
- Down + closing
- —
- Monthly P&I
- —
- Monthly cashflow
- —
- DSCR
- —
- Eligible?
- —
No personal income docs; deal must DSCR.
Hard money
10% down · 12.0% · 12mo
- Down + closing
- —
- Monthly P&I
- —
- Monthly cashflow
- —
- DSCR
- —
- Eligible?
- —
Short-term bridge; refi at stabilization.
Listing history 2 events
-
2026-06-18remarks 699-char remark
-
2026-06-18$35,000 Active 1 DOM
ⓘ Source: listings_history table (triggers on properties + properties_extension) + one-shot
backfill from property_details.listing_events for pre-trigger history.
Tax reassessment forecast KY · Resets to sale price
- Current annual tax
- $641 · $53/mo
- Projected year-2 tax
- $641 · $53/mo
- Expected delta
- $0/yr ($0/mo · 0.0%)
ⓘ Screening estimate from a state-policy table — verify with the county assessor before closing.
Climate risk First Street
- Flood 1/10 Low FEMA zone X (unshaded) · 0% chance over 30 yrs
- Wildfire 3/10 Moderate
- Heat 5/10 Major 7 d/yr ≥109°F today · 20 d/yr by 30 yrs out
- Wind 3/10 Moderate 6% chance of damaging wind over 30 yrs
- Air quality 2/10 Low 1 unhealthy d/yr today · 1 by 30 yrs out
Nearby sold comps map
Loading sold comps map…
Walkable amenities ~0.75 mi
Loading nearby amenities…
Taxation est. · year 1
- Rental income
- $28,523
- − Mortgage interest
- −$1,961
- − Property taxes
- −$641
- − Insurance
- −$175
- − Repairs & maintenance
- −$2,282
- − Management
- −$2,282
- − Depreciation
- −$1,018
- Taxable income
- $20,165
- Est. tax owed @ 24.0%
- −$4,840
- After-tax cash flow
- $14,675/yr
For passive investors: Depreciation is non-cash, so a rental often shows a tax loss while cash-flowing — sheltering income. Rental losses are passive: they offset passive income freely, and up to $25,000/yr can offset ordinary (W-2) income if you actively participate and your MAGI is under $100k (phasing out to $0 by $150k); unused losses carry forward. On sale, claimed depreciation is recaptured at up to 25%, and gains may owe capital-gains tax (a 1031 exchange can defer both). Figures are a year-1 estimate at your 24.0% rate — not tax advice; consult a CPA.
Schools (NCES district)
- District
- Lyon County
- NCES district ID
- 2103690
- Math proficiency
- 45% ▼ -15.00%
- Reading proficiency
- 52% ▼ -13.00%
- Median HH income
- $43,899
- Composite
- 40.94/100
- National rank
- #3607
- State rank
- #13 of 165 in KY
Livability — Eddyville
- Score
- 69/100
- State rank
- #174
- US rank
- #8755
Category grades
Schools grade is shown separately in the Schools card above.
Census & demographics
- Census place
- Eddyville, KY
- Population (ZIP)
- 6,045
Population outlook (Lyon County) Hauer SSP2
- Today (2025)
- 8,330 people
- By 2030
- 8,308 · -0.3%
- By 2040
- 8,196 · -1.6%
- By 2050
- 8,069 · -3.1%
- By 2075
- 8,131 · -2.4%
- By 2100
- 6,856 · -17.7%
Race, ethnicity, and origin ACS 2023
- Neighborhood character
- Predominantly White (87%)
- Race & ethnicity
- White 87% Black 8% Two or more races 3% Hispanic / Latino 1%
- Common ancestry
- Italian 3% Serbian 2% Slovak 1%
- Foreign-born
- 1%
Political lean MEDSL · Lyon
- 2024 margin
- Solid R (+53.4) · D 22.7% · R 76.1% · Other 1.2%
- 2008→2024 swing
- -36.8pp toward R · 2008: -16.7pp · 2024: -53.4pp
- All cycles
- 2024: R+53.4 2020: R+47.5 2016: R+44.0 2012: R+27.1 2008: R+16.7
Not yet ingested
- Civics
- —
Market trends
- HPI YoY
- ▼ -65.82%
- Current HPI
- 148.5677
- Rent YoY
- —
- Metro
- —
- State GDP YoY
- ▲ 1.81%
- F500 in state
- 4
Industry mix (Fortune 500 HQ in KY)
| Industry | F500 HQs | Revenue |
|---|---|---|
| Healthcare | 1 | $118B |
|
||
| Food / Beverage | 1 | $7B |
|
||
Price history
1 event — show timeline
- 2026-06-17 Listed $35,000 WKRMLS
Property tax history
+8.1%/yrLatest (2025): $641 · +13.0% YoY. Source: county tax records.
Cash-flow waterfall
monthlySold comps — $/sqft
last 12 mo · ≤1 miLoading sold comps…