 🏗️ New Construction
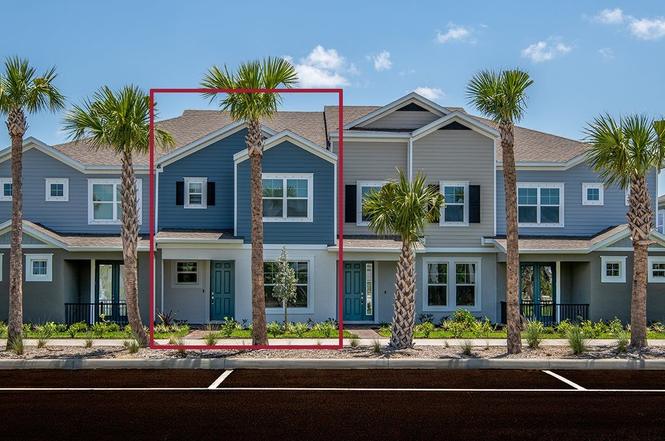
Madison Plan · North Fort Myers, FL
Flood risk No data
- FEMA flood zone
- —
- Chance of flooding over 30 yrs
- —
- Est. flood insurance / yr
- —
Fire risk No data
- Est. fire insurance / yr
- —
Heat risk No data
- Hot days now (above threshold)
- —
- Hot days in 30 yrs
- —
Wind risk No data
- Chance of severe wind over 30 yrs
- —
Air-quality risk No data
- Unhealthy air days now
- —
- Unhealthy air days in 30 yrs
- —
Risk factors via First Street. Map © Google.
Why this score? — see what drove the C grade
The composite is a weighted blend of 9 inputs, each scored 0–100. Each bar is that input's sub-score; the figure is the points it added to the 100-point composite (weight × sub-score).
- Cash flow +22.0/30.0
- ARV discount +7.5/15.0
- DSCR +7.0/10.0
- 1% rule +6.2/10.0
- Schools +4.6/10.0
- Livability +3.7/5.0
- Rent growth +3.5/5.0
- Condition / age +2.5/5.0
- Appreciation +2.4/10.0
$349,990
🖨 Deal sheet 📄 Offer letter ✓ Due diligence
Listing remarks
The Madison is a spacious, open concept floorplan that offers a first floor bedroom and full bath. The kitchen, dining and gathering room overlook your personal courtyard, which leads to your rear entry detached one-car garage. The master suite is located on the second floor boasting a master bath with double sinks, an oversized shower and spacious walk-in closet. The loft area provides an extra space for play or to host guests. Surrounding the loft is an additional bedroom with full bath that could function as a second master suite, an walk-in laundry room, and extra storage space. These images are for illustrative purposes only and may not depict the exact specifications or details of the
Key facts
- Double sinks
- Personal courtyard
- Master bath
Tags
Property features AI
Finance
- Other: Listing status: Active; List price $379,990
- HOA & community: Association fee $242
Exterior
- Parking: 2 parking spaces
- Home design: Madison plan home; Located at Park View Dr, Babcock Ranch, FL
- Exterior features: Living area approximately 2024
Interior
- Bedrooms: 3 bedrooms
- Bathrooms: 3 full bathrooms
- Interior features: Plan: Madison (new construction plan)
Neighborhood map
What this means for you Summary
Snapshot
- This is a 3-bed/3.0-bath townhouse listed at $350k.
Deal economics
- At list price, monthly cash flow is $558 ($7k/yr) — positive.
- The deal already cash-flows at list — no discount required.
- Meets the 1% rule at list price ($4k rent vs $350k).
- Recommended offer: $308k (12.0% below list) — sets the bar for market timing.
- Cap rate 8.2% vs local median 3.6% in North Fort Myers — top-decile yield for the area; either an underpriced asset or a hidden risk that comps aren't pricing in. Stress-test before assuming the spread holds.
Location & tenants
- Location reads 74/100 on livability (#269 in FL, #4,409 nationally) — a middle-class / working-renter tenant base. Strengths: cost of living A+, housing A+, health & safety A+; Watch: employment C-, amenities F, commute F.
- Charlotte (suburban): math 54% / reading 54% proficiency, ranked #22 of 73 in FL (top 30%) — acceptable for families but not a draw, mixed tenant base, ~2y average lease.
- Market conditions: Rents rising fast (+4.1%/yr); 1037 active listings in the ZIP; 14 comparable units currently listed for rent nearby; rentals at typical pace (median 21d on market — plan ~3-4 weeks tenant-placement turnaround); 4,585 units permitted in Charlotte County in 2024 (703 in 5+ unit buildings).
- At $3,925/mo this rent would consume 65% of the median local household income ($72k/yr) (locally 43% of renters already pay >50% of income on rent) — very limited rent-growth headroom before tenants either downsize or default.
Forward outlook
- Local home prices are declining (-3.0%/yr); year-one equity from $2k of loan paydown is wiped out by about $10k of value loss. Plan a longer hold.
- Charlotte County population projected at +24% by 2050 — long-run rental-demand tailwind backs the buy-and-hold thesis.
Negotiation context
- It's been on market 189 days — a 12% lower offer ($308k) is reasonable based on typical stale-listing flexibility.
Questions for the listing agent
- It's been on market 189 days. Have you received any prior offers? Is the seller open to a 12% concession, seller financing, or rate buy-down credit?
- What does the HOA fee cover, when was the last increase, and are there any pending special assessments or reserve-fund shortfalls?
- Why hasn't it sold? Are there any deal-killer items the seller is aware of (foundation, flood, title, zoning, code violations)?
- Is there a deadline driving the sale (1031 exchange, divorce, estate, relocation)? That informs how much negotiation room exists.
- What's the average days-on-market for RENTAL listings here right now (not sales)? A rising rental-DOM trend means longer vacancies and softer asking-rent achievability than the comps imply.
- What's the recent tenant-quality profile in this submarket — average credit score on applications, eviction rate, late-payment / NSF rate, and stable-employment percentage? A property-management company in the area should have these aggregated.
- How much new for-sale + rental construction is in the pipeline within 1–3 miles? Heavy new supply typically softens prices + rents 12–24 months out; constrained supply supports both.
Investment metrics
- 1% rule
- 1.12% ✓
- Cap rate
- 8.21%
- Cash-on-cash
- 6.84%
- DSCR
- 1.30
- GRM
- 7.4
CMA / ARV
No comps found within radius.
Projected returns pro-forma
-3.0% appreciation · 4.13% rent growth · sell at horizon
- IRR
- -4.5%
- Equity multiple
- 0.83×
- Total profit
- $-16,511
- Equity at exit
- $52,185
- IRR
- 6.6%
- Equity multiple
- 1.52×
- Total profit
- $50,904
- Equity at exit
- $30,261
Cash invested: $97,997 (down + closing). Projections, not guarantees.
Landlord ↔ Tenant lean methodology
- Overall (STATE)
- 87 Strongly Landlord-Friendly
- State Florida
- 87 Strongly Landlord-Friendly · R+3
- County
- — inherits STATE
- City
- — inherits STATE
ZIP-level market 33982
- Home prices YoY
- -1.2%
- Rents YoY
- 4.1%
- Active inventory
- 1037
- Price-to-rent
- 7.4×
Monthly cashflow live
- Estimated rent
- $3,925 high interval (Pro) →
- Mortgage (P&I)
- −$1,835
- Tax est. 1.5%
- −$437 /mo · $5,250/yr
- Insurance
- −$146
- HOA
- −$124
- Vacancy / Maint / Mgmt
- −$824
- Net cashflow
- $558
Break-even live
UW: 25.0% down · 7.5% · 30yr · 1.5% tax · 5.0% vac · 8.0% maint · 8.0% mgmt
Financing live
Cash to close
- Down payment
- $87,498
- Closing costs
- $10,500
- Reserves months
- —
- Total cash needed
- —
Loan-product check · same deal, 3 products live
Conventional
25% down · 7.5% · 30yr
- Down + closing
- —
- Monthly P&I
- —
- Monthly cashflow
- —
- DSCR
- —
- Eligible?
- —
Personal DTI + credit; lowest rate.
DSCR
20% down · 8.5% · 30yr
- Down + closing
- —
- Monthly P&I
- —
- Monthly cashflow
- —
- DSCR
- —
- Eligible?
- —
No personal income docs; deal must DSCR.
Hard money
10% down · 12.0% · 12mo
- Down + closing
- —
- Monthly P&I
- —
- Monthly cashflow
- —
- DSCR
- —
- Eligible?
- —
Short-term bridge; refi at stabilization.
Rent comps 14 comps
| Address | Beds | Baths | Sqft | Rent | $/sqft | DOM | Units | Dist |
|---|---|---|---|---|---|---|---|---|
| 17174 Curry Preserve Dr Punta Gorda, FL | 3.0 | 1.0–2.0 | 1036 | $2,354 | $2.27 | 21d | 58 | 0.22mi |
| 43038 Parkside Ct Punta Gorda, FL | 3.0 | 2.0 | 1677 | $2,500 | $1.49 | 21d | 1 | 0.31mi |
| 43153 Wild Indigo Rd Punta Gorda, FL | 3.0–5.0 | 2.0–2.5 | 1919 | $2,100 | $1.09 | 21d | 25 | 0.46mi |
| 16572 Kingwood Ln #3611 Punta Gorda, FL | 3.0 | 2.0 | 1749 | $4,500 | $2.57 | 21d | 1 | 0.76mi |
| 43693 Tree Top Trl Punta Gorda, FL | 3.0 | 3.0 | 1850 | $11,000 | $5.95 | 21d | 1 | 0.89mi |
| 17339 Palmetto Pass Ln Punta Gorda, FL | 3.0 | 3.0 | 2464 | $5,000 | $2.03 | 21d | 1 | 0.90mi |
| 17604 Fallen Branch Way Punta Gorda, FL | 4.0 | 3.0 | 2027 | $2,700 | $1.33 | 21d | 1 | 0.96mi |
| 42098 Journey Dr Punta Gorda, FL | 3.0 | 2.0 | 2000 | $9,000 | $4.50 | 21d | 1 | 1.00mi |
| 42218 Edgewater Dr Punta Gorda, FL | 2.0 | 2.0 | 1662 | $2,595 | $1.56 | 21d | 1 | 1.03mi |
| 16397 Preservation Blvd Punta Gorda, FL | 4.0 | 3.5 | 2353 | $2,800 | $1.19 | 21d | 1 | 1.34mi |
| 43645 Sparrow Dr Punta Gorda, FL | 2.0 | 2.0 | 1503 | $6,500 | $4.32 | 13d | 1 | 1.37mi |
| 43041 Greenway Blvd Punta Gorda, FL | 2.0–3.0 | 2.0 | 1569 | $7,500 | $4.78 | 21d | 3 | 1.44mi |
| 15970 Grassland Ln Punta Gorda, FL | 2.0 | 2.0 | 1476 | $6,250 | $4.23 | 21d | 2 | 1.48mi |
| 15980 Grassland Ln Punta Gorda, FL | 2.0 | 2.0 | 1467 | $6,625 | $4.51 | 21d | 2 | 1.48mi |
HOA detail
- Monthly dues
- $124 · $1,488/yr
Listing history 15 events
-
2026-06-18days on market $349,990 Active 189 DOM
-
2026-06-17remarks 699-char remark
-
2026-06-17pricedays on market $349,990 Active 188 DOM
-
2026-06-16days on market $379,990 Active 717 DOM
-
2026-06-15days on market $379,990 Active 716 DOM
-
2026-06-14days on market $379,990 Active 714 DOM
-
2026-06-13days on market $379,990 Active 713 DOM
-
2026-06-10days on market $379,990 Active 711 DOM
-
2026-06-09days on market $379,990 Active 710 DOM
-
2026-06-08days on market $379,990 Active 709 DOM
-
2026-06-05days on market $379,990 Active 705 DOM
-
2026-06-02days on market $379,990 Active 703 DOM
-
2026-06-01days on market $379,990 Active 702 DOM
-
2026-05-31days on market $379,990 Active 701 DOM
-
2026-05-30days on market $379,990 Active 700 DOM
ⓘ Source: listings_history table (triggers on properties + properties_extension) + one-shot
backfill from property_details.listing_events for pre-trigger history.
Nearby sold comps map
Loading sold comps map…
Walkable amenities ~0.75 mi
Loading nearby amenities…
Taxation est. · year 1
- Rental income
- $47,103
- − Mortgage interest
- −$19,605
- − Property taxes
- −$5,250
- − Insurance
- −$1,750
- − Repairs & maintenance
- −$3,768
- − Management
- −$3,768
- − HOA
- −$1,488
- − Depreciation
- −$10,182
- Taxable income
- $1,292
- Est. tax owed @ 24.0%
- −$310
- After-tax cash flow
- $6,389/yr
For passive investors: Depreciation is non-cash, so a rental often shows a tax loss while cash-flowing — sheltering income. Rental losses are passive: they offset passive income freely, and up to $25,000/yr can offset ordinary (W-2) income if you actively participate and your MAGI is under $100k (phasing out to $0 by $150k); unused losses carry forward. On sale, claimed depreciation is recaptured at up to 25%, and gains may owe capital-gains tax (a 1031 exchange can defer both). Figures are a year-1 estimate at your 24.0% rate — not tax advice; consult a CPA.
Schools (NCES district)
- District
- Charlotte
- NCES district ID
- 1200240
- Math proficiency
- 54% ▼ -6.00%
- Reading proficiency
- 54% ▼ -1.00%
- Median HH income
- $44,864
- Composite
- 45.62/100
- National rank
- #2586
- State rank
- #22 of 73 in FL
Livability — North Fort Myers
- Score
- 74/100
- State rank
- #269
- US rank
- #4409
Category grades
Schools grade is shown separately in the Schools card above.
Census & demographics
- County
- Charlotte County · 196,994 people
- City population
- 57,035
- Metro
- Punta Gorda, FL
- Population (ZIP)
- 13,006
- Household income
- $72,443
- Rent vs Own
- Severe rent burden
- 43.0
Population outlook (Charlotte County) Hauer SSP2
- Today (2025)
- 198,646 people
- By 2030
- 210,507 · +6.0%
- By 2040
- 230,857 · +16.2%
- By 2050
- 247,148 · +24.4%
- By 2075
- 281,777 · +41.8%
- By 2100
- 293,609 · +47.8%
Race, ethnicity, and origin ACS 2023
- Neighborhood character
- Predominantly White (81%)
- Race & ethnicity
- White 81% Two or more races 8% Hispanic / Latino 7% Black 7%
- Hispanic origin (detail)
- Puerto Rican 2% Cuban 3%
- Common ancestry
- Lithuanian 3% Iranian 3% Slovak 3%
- Foreign-born
- 6% · Canada, Jamaica
- Languages at home
- 93% English-only · Spanish 5% German/W. Germanic 1% Arabic 1%
Political lean MEDSL · Charlotte
- 2024 margin
- Solid R (+34.0) · D 32.7% · R 66.7%
- 2008→2024 swing
- -26.7pp toward R · 2008: -7.2pp · 2024: -34.0pp
- All cycles
- 2024: R+34.0 2020: R+26.6 2016: R+27.8 2012: R+14.3 2008: R+7.2
Not yet ingested
- Civics
- —
Market trends
- HPI YoY
- ▼ -5.25%
- Current HPI
- 448.5895
- Rent YoY
- ▲ 4.13%
- Metro
- Punta Gorda, FL
- State GDP YoY
- ▲ 3.28%
- F500 in state
- 36
Industry mix (Fortune 500 HQ in FL)
| Industry | F500 HQs | Revenue |
|---|---|---|
| Industrial Technology | 2 | $29B |
|
||
| Insurance | 2 | $17B |
|
||
| Retail | 1 | $60B |
|
||
| Technology Distribution | 1 | $58B |
|
||
| Homebuilding | 1 | $35B |
|
||
| Technology Manufacturing | 1 | $35B |
|
||
Cash-flow waterfall
monthlySold comps — $/sqft
last 12 mo · ≤1 miLoading sold comps…