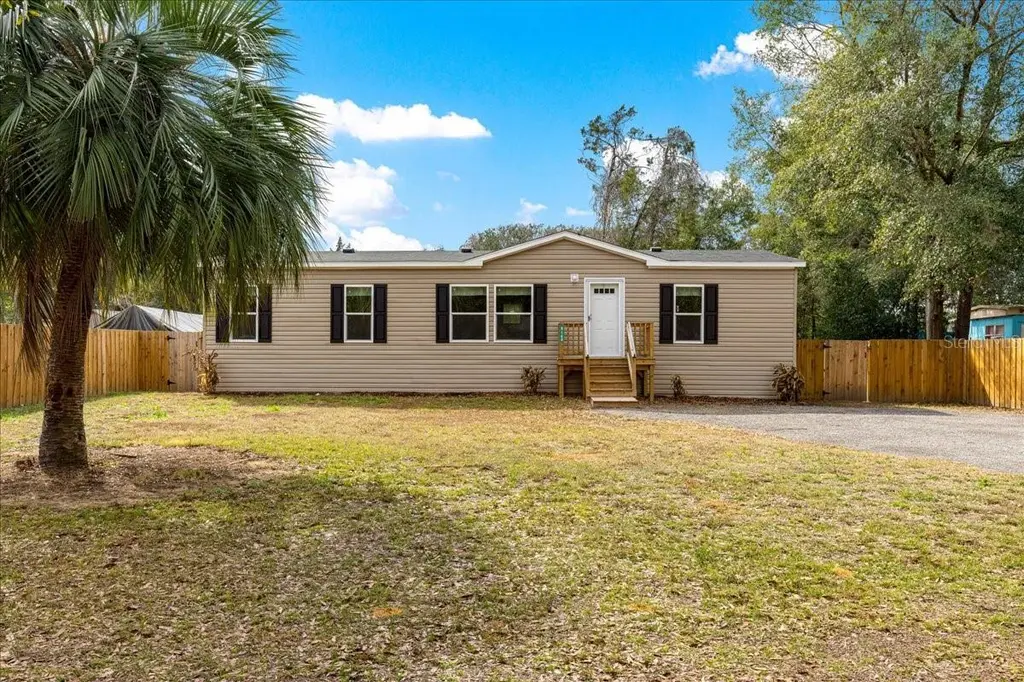
9160 SW 31st Avenue Rd · Liberty Triangle, FL
Flood risk 1/10 · Minimal
- FEMA flood zone
- X (unshaded)
- Chance of flooding over 30 yrs
- 0.0%
- Est. flood insurance / yr
- $507 – $1,088
Fire risk 5/10 · Moderate
- Est. fire insurance / yr
- $947 – $1,759
Heat risk 8/10 · Major
- Hot days now (above 108°F)
- 7 days/yr
- Hot days in 30 yrs
- 21 days/yr
Wind risk 9/10 · Severe
- Chance of severe wind over 30 yrs
- 99.0%
Air-quality risk 2/10 · Minimal
- Unhealthy air days now
- 2 days/yr
- Unhealthy air days in 30 yrs
- 2 days/yr
Risk factors via First Street. Map © Google.
Why this score? — see what drove the D+ grade
The composite is a weighted blend of 9 inputs, each scored 0–100. Each bar is that input's sub-score; the figure is the points it added to the 100-point composite (weight × sub-score).
- Cash flow +24.1/30.0
- DSCR +7.8/10.0
- 1% rule +4.9/10.0
- Schools +3.6/10.0
- Livability +2.5/5.0
- Condition / age +2.5/5.0
- Rent growth +1.9/5.0
- ARV discount +0.0/15.0
- Appreciation +0.0/10.0
$194,000
🖨 Deal sheet (PDF) 📄 Offer letter ✓ Due diligence
Listing remarks MLS
* * * $8,500 SELLERS CONCESSIONS and a 1 YEAR HOME WARRANTY * * * Welcome to this 2025 built, 3 bedroom, 2 bathroom mobile home located in desirable SW Ocala, conveniently close to shopping, dining, and major roadways. This home offers an open floor plan with LVP flooring and carpet, creating a fresh and inviting feel throughout. The light and bright kitchen features ample cabinet space and plenty of storage, perfect for everyday living and entertaining. The spacious primary suite includes a private bath with a walk-in shower, all bedrooms have walk in closets, and the home also features a dedicated laundry room for added convenience with additional storage space. Enjoy outdoor living in the fully fenced yard with a double gate, ideal for vehicles, toys, or pets. This home offers comfort, functionality, and value—schedule your showing today!
Key facts
- Open floor plan
- Private bath
- Walk in closets
Tags
Neighborhood map
What this means for you Summary
Snapshot
- This is a 3-bed/2.0-bath manufactured listed at $194k.
Deal economics
- At list price, monthly cash flow is $384 ($5k/yr) — positive.
- The deal already cash-flows at list — no discount required.
- To meet the 1% rule (rent ≥ 1% of price), the offer needs to be $192k (1.1% below list).
- Recommended offer: $177k (9.0% below list) — sets the bar for market timing.
- Cap rate 8.7% vs local median 4.5% in Liberty Triangle — top-decile yield for the area; either an underpriced asset or a hidden risk that comps aren't pricing in. Stress-test before assuming the spread holds.
Location & tenants
- Location reads: area grade D — affects rentability + tenant quality, not the cash-flow math above.
- Marion (rural): math 42% / reading 43% proficiency, ranked #61 of 73 in FL (top 84%) — families likely to look elsewhere, expect single-tenant / working-renter base with shorter leases; 61% free/reduced lunch — lower-income household profile, screen leases tightly.
- Market conditions: Rents soft (-2.6%/yr); 852 active listings in the ZIP; 10 comparable units currently listed for rent nearby; rentals at typical pace (median 15d on market — plan ~3-4 weeks tenant-placement turnaround); 7,071 units permitted in Marion County in 2024 (534 in 5+ unit buildings).
- This rent runs 35% of the median local income ($66k/yr) — at the standard rent-burdened threshold; future hikes will face affordability resistance.
Forward outlook
- Local home prices are declining (-3.0%/yr); year-one equity from $1k of loan paydown is wiped out by about $6k of value loss. Plan a longer hold.
- Marion County population projected at +13% by 2050 — modest demand growth; plan on rents tracking national, not racing it.
Negotiation context
- It's been on market 100 days — a 9% lower offer ($177k) is reasonable based on typical stale-listing flexibility.
- 4 sale attempts with the ask held roughly flat each time — persistent listings suggest the price (not the market) is what's stuck; bring a comps-based counter.
- Current owner paid $17k; list at $194k implies a 1041% gain — meaningful room to come down on a strong offer.
Risks & watch-outs
- Climate carrying-cost: severe wind risk, 99% chance of damaging wind over 30y; moderate wildfire risk; extreme-heat days projected 7→21/yr by 2055 (HVAC capex compounding) — expect insurance premiums to compound above CPI over the hold.
Questions for the listing agent
- It's been on market 100 days. Have you received any prior offers? Is the seller open to a 9% concession, seller financing, or rate buy-down credit?
- Why hasn't it sold? Are there any deal-killer items the seller is aware of (foundation, flood, title, zoning, code violations)?
- Is there a deadline driving the sale (1031 exchange, divorce, estate, relocation)? That informs how much negotiation room exists.
- The area grade is low — what's the realistic commute time and amenity access for the typical tenant pool here? Any planned neighborhood developments (good or bad) we should know about?
- What's the average days-on-market for RENTAL listings here right now (not sales)? A rising rental-DOM trend means longer vacancies and softer asking-rent achievability than the comps imply.
- What's the recent tenant-quality profile in this submarket — average credit score on applications, eviction rate, late-payment / NSF rate, and stable-employment percentage? A property-management company in the area should have these aggregated.
- How much new for-sale + rental construction is in the pipeline within 1–3 miles? Heavy new supply typically softens prices + rents 12–24 months out; constrained supply supports both.
Investment metrics
- 1% rule
- 0.99% ✗
- Cap rate
- 8.67%
- Cash-on-cash
- 8.49%
- DSCR
- 1.38
- GRM
- 8.4
CMA / ARV
- ARV (median comp)
- $154,320
- List price
- $194,000
- Delta
- 25.71%
- Verdict
- OVERPRICED
- Comps
- 6 within 1.0 mi
Show comp detail 3 sales within ~0.75 mi
| Address | Dist | Beds/Ba | Sqft | Sold | Price | $/sf | Match |
|---|---|---|---|---|---|---|---|
| 9165 SW 32nd Ct | 0.17mi | 2/2.0 (-1) | 1,400 (-0%) | 4mo | $150,000 | $107 | 83 |
| 3197 SW 89th Pl | 0.29mi | 4/2.0 (+1) | 1,436 (+2%) | 3mo | $144,000 | $100 | 75 |
| 9850 SW 27th Ave | 0.75mi | 3/2.0 | 1,403 (-0%) | 7mo | $160,000 | $114 | 59 |
Match score weights: distance 35% · size 25% · config 20% · recency 20%. Top-matched comps best support the ARV.
Projected returns pro-forma
-3.0% appreciation · 0.0% rent growth · sell at horizon
- IRR
- -6.5%
- Equity multiple
- 0.77×
- Total profit
- $-12,691
- Equity at exit
- $28,926
- IRR
- -0.5%
- Equity multiple
- 0.97×
- Total profit
- $-1,686
- Equity at exit
- $16,774
Cash invested: $54,320 (down + closing). Projections, not guarantees.
Landlord ↔ Tenant lean methodology
- Overall (STATE)
- 87 Strongly Landlord-Friendly
- State Florida
- 87 Strongly Landlord-Friendly · R+3
- County
- — inherits STATE
- City
- — inherits STATE
ZIP-level market 34476
- Rents YoY
- -2.6%
- Active inventory
- 852
- Price-to-rent
- 8.4×
Monthly cashflow live
- Estimated rent
- $1,920 high interval (Pro) →
- Mortgage (P&I)
- −$1,017
- Tax from tax record
- −$34 /mo · $409/yr
- Insurance
- −$81
- HOA
- −$0
- Vacancy / Maint / Mgmt
- −$403
- Net cashflow
- $384
Break-even live
Sensitivity live
| Price | -10% $494 | -5% $439 | +0% $384 | +5% $329 | +10% $42 |
|---|---|---|---|---|---|
| Rent | -10% $233 | -5% $308 | +0% $384 | +5% $460 | +10% $536 |
| Rate | -1.0pp $482 | -0.5pp $434 | base $384 | +0.5pp $334 | +1.0pp $283 |
UW: 25.0% down · 7.5% · 30yr · 1.5% tax · 5.0% vac · 8.0% maint · 8.0% mgmt
Financing live
Cash to close
- Down payment
- $48,500
- Closing costs
- $5,820
- Reserves months
- —
- Total cash needed
- —
Loan-product check · same deal, 3 products live
Conventional
25% down · 7.5% · 30yr
- Down + closing
- —
- Monthly P&I
- —
- Monthly cashflow
- —
- DSCR
- —
- Eligible?
- —
Personal DTI + credit; lowest rate.
DSCR
20% down · 8.5% · 30yr
- Down + closing
- —
- Monthly P&I
- —
- Monthly cashflow
- —
- DSCR
- —
- Eligible?
- —
No personal income docs; deal must DSCR.
Hard money
10% down · 12.0% · 12mo
- Down + closing
- —
- Monthly P&I
- —
- Monthly cashflow
- —
- DSCR
- —
- Eligible?
- —
Short-term bridge; refi at stabilization.
Rent comps 10 comps
| Address | Beds | Baths | Sqft | Rent | $/sqft | DOM | Units | Dist |
|---|---|---|---|---|---|---|---|---|
| 7194 SW 91st Ln Ocala, FL | 4.0 | 2.5 | 1571 | $1,950 | $1.24 | 22d | 1 | 0.12mi |
| 8880 SW 27th Ave Ocala, FL | 2.0–3.0 | 2.0 | 1178 | $1,399 | $1.19 | 22d | 1 | 0.34mi |
| 3085 SW 97th St Unit 2 Ocala, FL | 2.0 | 1.0 | 960 | $1,049 | $1.09 | 14d | 1 | 0.49mi |
| 9975 SW 39th Ter Ocala, FL | 4.0 | 2.0 | 1873 | $2,295 | $1.23 | 14d | 1 | 1.10mi |
| 4296 SW 98th St Ocala, FL | 3.0 | 2.0 | 1607 | $1,700 | $1.06 | 22d | 1 | 1.30mi |
| 8320 SW 41st Ter Ocala, FL | 3.0 | 2.0 | 1841 | $2,300 | $1.25 | 14d | 1 | 1.32mi |
| 8665 SW 44th Ct Ocala, FL | 3.0 | 2.0 | 1453 | $1,895 | $1.30 | 22d | 1 | 1.38mi |
| 9109 SW 45th Ter Ocala, FL | 4.0 | 2.0 | 1828 | $2,150 | $1.18 | 14d | 1 | 1.41mi |
| 8590 SW 44th Ct Ocala, FL | 3.0 | 2.0 | 1453 | $1,895 | $1.30 | 14d | 1 | 1.44mi |
| 8590 SW 44th Ct Ocala, FL | 3.0 | 2.0 | 1453 | $1,895 | $1.30 | 14d | 1 | 1.44mi |
Listing history 18 events
-
2026-05-17status Pending 866-char remark
Show marketing remark (866 chars)
* * * $8,500 SELLERS CONCESSIONS and a 1 YEAR HOME WARRANTY * * * Welcome to this 2025 built, 3 bedroom, 2 bathroom mobile home located in desirable SW Ocala, conveniently close to shopping, dining, and major roadways. This home offers an open floor plan with LVP flooring and carpet, creating a fresh and inviting feel throughout. The light and bright kitchen features ample cabinet space and plenty of storage, perfect for everyday living and entertaining. The spacious primary suite includes a private bath with a walk-in shower, all bedrooms have walk in closets, and the home also features a dedicated laundry room for added convenience with additional storage space. Enjoy outdoor living in the fully fenced yard with a double gate, ideal for vehicles, toys, or pets. This home offers comfort, functionality, and value—schedule your showing today!
-
2026-05-14price $194,000 866-char remark
Show marketing remark (866 chars)
* * * $8,500 SELLERS CONCESSIONS and a 1 YEAR HOME WARRANTY * * * Welcome to this 2025 built, 3 bedroom, 2 bathroom mobile home located in desirable SW Ocala, conveniently close to shopping, dining, and major roadways. This home offers an open floor plan with LVP flooring and carpet, creating a fresh and inviting feel throughout. The light and bright kitchen features ample cabinet space and plenty of storage, perfect for everyday living and entertaining. The spacious primary suite includes a private bath with a walk-in shower, all bedrooms have walk in closets, and the home also features a dedicated laundry room for added convenience with additional storage space. Enjoy outdoor living in the fully fenced yard with a double gate, ideal for vehicles, toys, or pets. This home offers comfort, functionality, and value—schedule your showing today!
-
2026-04-29price $196,000 866-char remark
Show marketing remark (866 chars)
* * * $8,500 SELLERS CONCESSIONS and a 1 YEAR HOME WARRANTY * * * Welcome to this 2025 built, 3 bedroom, 2 bathroom mobile home located in desirable SW Ocala, conveniently close to shopping, dining, and major roadways. This home offers an open floor plan with LVP flooring and carpet, creating a fresh and inviting feel throughout. The light and bright kitchen features ample cabinet space and plenty of storage, perfect for everyday living and entertaining. The spacious primary suite includes a private bath with a walk-in shower, all bedrooms have walk in closets, and the home also features a dedicated laundry room for added convenience with additional storage space. Enjoy outdoor living in the fully fenced yard with a double gate, ideal for vehicles, toys, or pets. This home offers comfort, functionality, and value—schedule your showing today!
-
2026-02-06$198,000 Active 866-char remark
Show marketing remark (866 chars)
* * * $8,500 SELLERS CONCESSIONS and a 1 YEAR HOME WARRANTY * * * Welcome to this 2025 built, 3 bedroom, 2 bathroom mobile home located in desirable SW Ocala, conveniently close to shopping, dining, and major roadways. This home offers an open floor plan with LVP flooring and carpet, creating a fresh and inviting feel throughout. The light and bright kitchen features ample cabinet space and plenty of storage, perfect for everyday living and entertaining. The spacious primary suite includes a private bath with a walk-in shower, all bedrooms have walk in closets, and the home also features a dedicated laundry room for added convenience with additional storage space. Enjoy outdoor living in the fully fenced yard with a double gate, ideal for vehicles, toys, or pets. This home offers comfort, functionality, and value—schedule your showing today!
-
2026-01-29status Active
-
2026-01-29historical
-
2026-01-08status Pending
-
2026-01-02price $187,000
-
2025-12-09price $189,000
-
2025-11-29price $195,500
-
2025-10-02$198,000 Active
-
2025-09-12historical
-
2025-07-25status Pending
-
2025-07-09price $198,000
-
2025-06-19price $206,000
-
2025-01-29$208,000 Active
-
2024-11-22soldstatus $17,000
-
1994-08-01soldstatus $20,000
ⓘ Source: listings_history table (triggers on properties + properties_extension) + one-shot
backfill from property_details.listing_events for pre-trigger history.
Tax reassessment forecast FL · Resets to sale price
- Current annual tax
- $409 · $34/mo
- Projected year-2 tax
- $1,610 · $134/mo
- Expected delta
- +$1,201/yr (+$100/mo · 293.8%)
ⓘ Screening estimate from a state-policy table — verify with the county assessor before closing.
Climate risk First Street
- Flood 1/10 Low FEMA zone X (unshaded) · 0% chance over 30 yrs
- Wildfire 5/10 Major
- Heat 8/10 Severe 7 d/yr ≥108°F today · 21 d/yr by 30 yrs out
- Wind 9/10 Extreme 99% chance of damaging wind over 30 yrs
- Air quality 2/10 Low 2 unhealthy d/yr today · 2 by 30 yrs out
Nearby sold comps map
Loading sold comps map…
Walkable amenities ~0.75 mi
Loading nearby amenities…
Taxation est. · year 1
- Rental income
- $23,035
- − Mortgage interest
- −$10,867
- − Property taxes
- −$409
- − Insurance
- −$970
- − Repairs & maintenance
- −$1,843
- − Management
- −$1,843
- − Depreciation
- −$5,644
- Taxable income
- $1,460
- Est. tax owed @ 24.0%
- −$350
- After-tax cash flow
- $4,260/yr
For passive investors: Depreciation is non-cash, so a rental often shows a tax loss while cash-flowing — sheltering income. Rental losses are passive: they offset passive income freely, and up to $25,000/yr can offset ordinary (W-2) income if you actively participate and your MAGI is under $100k (phasing out to $0 by $150k); unused losses carry forward. On sale, claimed depreciation is recaptured at up to 25%, and gains may owe capital-gains tax (a 1031 exchange can defer both). Figures are a year-1 estimate at your 24.0% rate — not tax advice; consult a CPA.
Schools (NCES district)
- District
- Marion
- NCES district ID
- 1201260
- Math proficiency
- 42% ▼ -7.00%
- Reading proficiency
- 43% ▼ -4.00%
- Median HH income
- $40,015
- Composite
- 35.61/100
- National rank
- #4890
- State rank
- #61 of 73 in FL
Livability — Liberty Triangle
No livability data for this city. (Only ~50 U.S. cities are tracked.)
Census & demographics
- County
- Marion County · 315,796 people
- City population
- 26,397
- Metro
- Ocala, FL
- Population (ZIP)
- 28,997
- Household income
- $65,860
- Rent vs Own
- Severe rent burden
- 204.0
Population outlook (Marion County) Hauer SSP2
- Today (2025)
- 365,905 people
- By 2030
- 376,768 · +3.0%
- By 2040
- 396,555 · +8.4%
- By 2050
- 412,723 · +12.8%
- By 2075
- 446,090 · +21.9%
- By 2100
- 436,193 · +19.2%
Race, ethnicity, and origin ACS 2023
- Neighborhood character
- Diverse neighborhood (Simpson 0.55)
- Race & ethnicity
- White 63% Hispanic / Latino 18% Black 13% Two or more races 10% Asian 1%
- Hispanic origin (detail)
- Mexican 3% Puerto Rican 8% Cuban 3%
- Common ancestry
- Romanian 3% Slovak 3% Lithuanian 3%
- Foreign-born
- 15% · Canada, Jamaica, Dominican Republic
- Languages at home
- 83% English-only · Spanish 14% Other Indo-European 1% German/W. Germanic 1%
Political lean MEDSL · Marion
- 2024 margin
- Solid R (+31.6) · D 33.8% · R 65.5%
- 2008→2024 swing
- -20.0pp toward R · 2008: -11.6pp · 2024: -31.6pp
- All cycles
- 2024: R+31.6 2020: R+25.9 2016: R+26.2 2012: R+16.2 2008: R+11.6
Not yet ingested
- Civics
- —
Market trends
- HPI YoY
- ▼ -105.22%
- Current HPI
- 189.0869
- Rent YoY
- ▼ -2.57%
- Metro
- Ocala, FL
- State GDP YoY
- ▲ 3.28%
- F500 in state
- 36
Industry mix (Fortune 500 HQ in FL)
| Industry | F500 HQs | Revenue |
|---|---|---|
| Industrial Technology | 2 | $29B |
|
||
| Insurance | 2 | $17B |
|
||
| Retail | 1 | $60B |
|
||
| Technology Distribution | 1 | $58B |
|
||
| Homebuilding | 1 | $35B |
|
||
| Technology Manufacturing | 1 | $35B |
|
||
Price history
+870.0% since first listed18 events — show timeline
- 2026-05-17 Pending — Stellar MLS as Distributed by MLS Grid
- 2026-05-14 Price Changed $194,000 Stellar MLS as Distributed by MLS Grid
- 2026-04-29 Price Changed $196,000 Stellar MLS as Distributed by MLS Grid
- 2026-02-06 Listed $198,000 Stellar MLS as Distributed by MLS Grid
- 2026-01-29 Relisted — Stellar MLS as Distributed by MLS Grid
- 2026-01-29 Listing Removed — Stellar MLS as Distributed by MLS Grid
- 2026-01-08 Pending — Stellar MLS as Distributed by MLS Grid
- 2026-01-02 Price Changed $187,000 Stellar MLS as Distributed by MLS Grid
- 2025-12-09 Price Changed $189,000 Stellar MLS as Distributed by MLS Grid
- 2025-11-29 Price Changed $195,500 Stellar MLS as Distributed by MLS Grid
- 2025-10-02 Listed $198,000 Stellar MLS as Distributed by MLS Grid
- 2025-09-12 Listing Removed — Stellar MLS as Distributed by MLS Grid
- 2025-07-25 Pending — Stellar MLS as Distributed by MLS Grid
- 2025-07-09 Price Changed $198,000 Stellar MLS as Distributed by MLS Grid
- 2025-06-19 Price Changed $206,000 Stellar MLS as Distributed by MLS Grid
- 2025-01-29 Listed $208,000 Stellar MLS as Distributed by MLS Grid
- 2024-11-22 Sold (Public Records) $17,000 Public Records
- 1994-08-01 Sold (Public Records) $20,000 Public Records
Property tax history
+7.6%/yrLatest (2025): $409 · +44.1% YoY. Source: county tax records.
Cash-flow waterfall
monthlySold comps — $/sqft
last 12 mo · ≤1 miLoading sold comps…