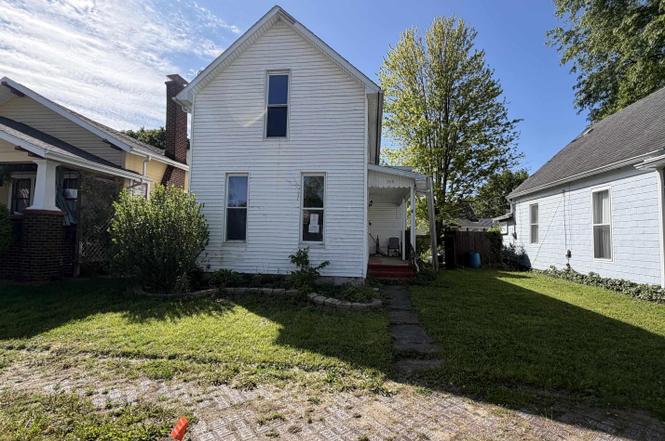
387 W 6th St · Peru, IN
Flood risk 6/10 · Moderate
- FEMA flood zone
- X (unshaded)
- Chance of flooding over 30 yrs
- 0.68%
- Est. flood insurance / yr
- $507 – $1,088
Fire risk 1/10 · Minimal
- Est. fire insurance / yr
- $717 – $1,331
Heat risk 3/10 · Minor
- Hot days now (above 102°F)
- 7 days/yr
- Hot days in 30 yrs
- 16 days/yr
Wind risk 2/10 · Minimal
- Chance of severe wind over 30 yrs
- —
Air-quality risk 2/10 · Minimal
- Unhealthy air days now
- 1 days/yr
- Unhealthy air days in 30 yrs
- 2 days/yr
Risk factors via First Street. Map © Google.
Why this score? — see what drove the B- grade
The composite is a weighted blend of 9 inputs, each scored 0–100. Each bar is that input's sub-score; the figure is the points it added to the 100-point composite (weight × sub-score).
- Cash flow +27.0/30.0
- ARV discount +15.0/15.0
- DSCR +9.3/10.0
- 1% rule +6.6/10.0
- Livability +3.9/5.0
- Schools +3.0/10.0
- Rent growth +2.5/5.0
- Condition / age +2.5/5.0
- Appreciation +0.0/10.0
$92,000
🖨 Deal sheet (PDF) 📄 Offer letter ✓ Due diligence
Listing remarks
Move-in ready and full of charm, this 3-bedroom, 1-bath home offers 1,112 sq. ft. of comfortable living space with a desirable main-level bedroom, spacious living areas, and a functional layout. Enjoy the privacy-fenced backyard perfect for pets, play, or entertaining, complete with a storage shed and covered porch for relaxing outdoors. Conveniently located near schools, parks, and local amenities, this affordable home is an excellent opportunity for first-time buyers, downsizers, or investors seeking a well-maintained property with immediate occupancy potential.
Key facts
- Covered porch
- Main-level bedroom
- Storage shed
Tags
Property features AI
Finance
- Financial info: Annual property tax approximately $844
Exterior
- Utilities: Public water; Public sewer
- Home design: Single-family residence (site-built); 2 stories
- Construction: Vinyl siding; Built as a site-built home
- Exterior features: Level lot; Lot dimensions approximately 33 x 79
Interior
- Bathrooms: 1 full bathroom (main level)
- Heating & cooling: Forced air heating; No cooling
- Interior features: 6 total rooms; Basement present
- Laundry & utility: Laundry on the main level
Neighborhood map
What this means for you Summary
Snapshot
- This is a 3-bed/1.0-bath single-family listed at $92k.
Deal economics
- At list price, monthly cash flow is $258 ($3k/yr) — positive.
- The deal already cash-flows at list — no discount required.
- Meets the 1% rule at list price ($1k rent vs $92k).
- Cap rate 9.7% vs local median 6.2% in Peru — top-decile yield for the area; either an underpriced asset or a hidden risk that comps aren't pricing in. Stress-test before assuming the spread holds.
Location & tenants
- Location reads 77/100 on livability (#35 in IN, #2,834 nationally) — a middle-class / working-renter tenant base. Strengths: amenities A+, cost of living A+, housing A+; Watch: crime D+, commute F, employment F.
- Peru Community Schools (town): math 31% / reading 42% proficiency, ranked #192 of 301 in IN (top 64%) — families likely to look elsewhere, expect single-tenant / working-renter base with shorter leases.
- Zoned schools: Blair Pointe Upper Elementary (math 34% / reading 38%, grade F, #577 of 994 statewide, top 59%, 552 students, 63% FRL); Peru Jr/Sr High School (math 27% / reading 57%, grade F, #197 of 369 statewide, top 57%, 883 students, 59% FRL).
- Market conditions: 129 active listings in the ZIP; 5 comparable units currently listed for rent nearby; rentals lingering (median 45d on market — plan ~5-8 weeks vacancy on turnover, expect pricing pressure); 100% of comp listings sitting > 30 days — soft ceiling on asking rent; 35 units permitted in Miami County in 2024 (0 in 5+ unit buildings).
Forward outlook
- Local home prices are declining (-3.0%/yr); year-one equity from $636 of loan paydown is wiped out by about $3k of value loss. Plan a longer hold.
- Miami County population projected at -12% by 2050 — secular population decline; favor cash flow + early exit over multi-decade hold.
- At projected returns (-3.0% appreciation + 3.0% rent growth), your $26k cash investment doubles in ~10 years — after that, you're playing with house money.
Negotiation context
- Only 1 days on market — expect competitive offers; lowballing is unlikely to land.
- 5 sale attempts since 10y ago with the ask held roughly flat each time — persistent listings suggest the price (not the market) is what's stuck; bring a comps-based counter.
Risks & watch-outs
- Watch-outs: built in 1930 — expect roof / HVAC / electrical / plumbing capex.
- Climate carrying-cost: major flood risk — expect insurance premiums to compound above CPI over the hold.
Questions for the listing agent
- Built in 1930 — when were the roof, HVAC, electrical panel, plumbing, and water heater last replaced?
- Is there a deadline driving the sale (1031 exchange, divorce, estate, relocation)? That informs how much negotiation room exists.
- Schools are D-rated, which usually means shorter tenancies and higher turnover. Who's the typical renter profile here, and what's been the actual vacancy rate?
- Crime grade is D in this area — have there been break-ins, vandalism, or insurance claims at this property in the last 3 years? What carrier currently insures it and at what premium?
- What's the average days-on-market for RENTAL listings here right now (not sales)? A rising rental-DOM trend means longer vacancies and softer asking-rent achievability than the comps imply.
- What's the recent tenant-quality profile in this submarket — average credit score on applications, eviction rate, late-payment / NSF rate, and stable-employment percentage? A property-management company in the area should have these aggregated.
- How much new for-sale + rental construction is in the pipeline within 1–3 miles? Heavy new supply typically softens prices + rents 12–24 months out; constrained supply supports both.
Investment metrics
- 1% rule
- 1.16% ✓
- Cap rate
- 9.65%
- Cash-on-cash
- 12.00%
- DSCR
- 1.53
- GRM
- 7.2
CMA / ARV
- ARV (on-the-fly)
- $133,400
- Comps found
- 12
Show comp detail 12 sales within ~0.75 mi
| Address | Dist | Beds/Ba | Sqft | Sold | Price | $/sf | Match |
|---|---|---|---|---|---|---|---|
| 360 W 6th St | 0.07mi | 2/1.0 (-1) | 1,177 (+2%) | 4mo | $115,000 | $98 | 86 |
| 480 W 6th St | 0.12mi | 3/1.0 | 1,176 (+1%) | 10mo | $134,900 | $115 | 84 |
| 357 W 5th St | 0.09mi | 3/1.0 | 990 (-15%) | 0mo | $83,670 | $85 | 71 |
| 251 W 10th St | 0.39mi | 2/1.0 (-1) | 1,136 (-2%) | 5mo | $158,000 | $139 | 69 |
| 48 N Chestnut St | 0.33mi | 2/1.5 (-1) | 1,152 (-1%) | 9mo | $164,000 | $142 | 69 |
| 115 N Miami St | 0.65mi | 3/1.0 | 1,148 (-1%) | 2mo | $135,000 | $118 | 66 |
| 114 W 7th St | 0.52mi | 3/1.0 | 1,210 (+4%) | 4mo | $70,000 | $58 | 66 |
| 470 W 5th St | 0.11mi | 2/1.0 (-1) | 1,287 (+11%) | 8mo | $152,000 | $118 | 65 |
| 512 Oak St | 0.45mi | 3/1.0 | 1,080 (-7%) | 8mo | $110,000 | $102 | 61 |
| 119 W 6th St | 0.50mi | 3/2.0 | 1,280 (+10%) | 9mo | $133,500 | $104 | 48 |
| 425 W 14th St | 0.51mi | 3/1.5 | 1,324 (+14%) | 10mo | $152,900 | $115 | 42 |
| 152 W Boulevard | 0.60mi | 2/2.0 (-1) | 1,008 (-13%) | 3mo | $170,000 | $169 | 39 |
Match score weights: distance 35% · size 25% · config 20% · recency 20%. Top-matched comps best support the ARV.
Projected returns pro-forma
-3.0% appreciation · 3.0% rent growth · sell at horizon
- IRR
- 1.5%
- Equity multiple
- 1.06×
- Total profit
- $1,489
- Equity at exit
- $13,717
- IRR
- 11.1%
- Equity multiple
- 1.87×
- Total profit
- $22,374
- Equity at exit
- $7,954
Cash invested: $25,760 (down + closing). Projections, not guarantees.
Landlord ↔ Tenant lean methodology
- Overall (STATE)
- 90 Strongly Landlord-Friendly
- State Indiana
- 90 Strongly Landlord-Friendly · R+11
- County
- — inherits STATE
- City
- — inherits STATE
ZIP-level market 46970
- Home prices YoY
- -8.8%
- Active inventory
- 129
- Price-to-rent
- 7.2×
Monthly cashflow live
- Estimated rent
- $1,071 high interval (Pro) →
- Mortgage (P&I)
- −$482
- Tax from tax record
- −$67 /mo · $809/yr
- Insurance
- −$38
- HOA
- −$0
- Vacancy / Maint / Mgmt
- −$225
- Net cashflow
- $258
Break-even live
Sensitivity live
| Price | -10% $310 | -5% $284 | +0% $258 | +5% $232 | +10% $206 |
|---|---|---|---|---|---|
| Rent | -10% $173 | -5% $215 | +0% $258 | +5% $300 | +10% $342 |
| Rate | -1.0pp $304 | -0.5pp $281 | base $258 | +0.5pp $234 | +1.0pp $210 |
UW: 25.0% down · 7.5% · 30yr · 1.5% tax · 5.0% vac · 8.0% maint · 8.0% mgmt
Financing live
Cash to close
- Down payment
- $23,000
- Closing costs
- $2,760
- Reserves months
- —
- Total cash needed
- —
Loan-product check · same deal, 3 products live
Conventional
25% down · 7.5% · 30yr
- Down + closing
- —
- Monthly P&I
- —
- Monthly cashflow
- —
- DSCR
- —
- Eligible?
- —
Personal DTI + credit; lowest rate.
DSCR
20% down · 8.5% · 30yr
- Down + closing
- —
- Monthly P&I
- —
- Monthly cashflow
- —
- DSCR
- —
- Eligible?
- —
No personal income docs; deal must DSCR.
Hard money
10% down · 12.0% · 12mo
- Down + closing
- —
- Monthly P&I
- —
- Monthly cashflow
- —
- DSCR
- —
- Eligible?
- —
Short-term bridge; refi at stabilization.
Rent comps 5 comps
| Address | Beds | Baths | Sqft | Rent | $/sqft | DOM | Units | Dist |
|---|---|---|---|---|---|---|---|---|
| 283 W Main St Unit 1 Peru, IN | 3.0 | 1.0 | 850 | $929 | $1.09 | 45d | 1 | 0.23mi |
| 548 Sycamore Trl Peru, IN | 1.0–2.0 | 1.0–2.0 | 899 | $1,345 | $1.50 | 45d | 2 | 0.44mi |
| 130 S Clay St Unit 6 Peru, IN | 2.0 | 1.0 | 725 | $799 | $1.10 | 45d | 1 | 1.02mi |
| 1850 Business 31 Unit 18562-B Peru, IN | 2.0 | 1.0 | 976 | $850 | $0.87 | 45d | 1 | 1.33mi |
| 1850 S Business 31 Peru, IN | 2.0 | 1.0 | 976 | $850 | $0.87 | 45d | 1 | 1.37mi |
Listing history 2 events
-
2026-06-19remarks 570-char remark
-
2026-06-19$92,000 Active 1 DOM
ⓘ Source: listings_history table (triggers on properties + properties_extension) + one-shot
backfill from property_details.listing_events for pre-trigger history.
Tax reassessment forecast IN · Partial reset (capped growth)
- Current annual tax
- $809 · $67/mo
- Projected year-2 tax
- $809 · $67/mo
- Expected delta
- $0/yr ($0/mo · 0.0%)
ⓘ Screening estimate from a state-policy table — verify with the county assessor before closing.
Climate risk First Street
- Flood 6/10 Major FEMA zone X (unshaded) · 68% chance over 30 yrs
- Wildfire 1/10 Low
- Heat 3/10 Moderate 7 d/yr ≥102°F today · 16 d/yr by 30 yrs out
- Wind 2/10 Low
- Air quality 2/10 Low 1 unhealthy d/yr today · 2 by 30 yrs out
Nearby sold comps map
Loading sold comps map…
Walkable amenities ~0.75 mi
Loading nearby amenities…
Taxation est. · year 1
- Rental income
- $12,849
- − Mortgage interest
- −$5,153
- − Property taxes
- −$809
- − Insurance
- −$460
- − Repairs & maintenance
- −$1,028
- − Management
- −$1,028
- − Depreciation
- −$2,676
- Taxable income
- $1,694
- Est. tax owed @ 24.0%
- −$407
- After-tax cash flow
- $2,685/yr
For passive investors: Depreciation is non-cash, so a rental often shows a tax loss while cash-flowing — sheltering income. Rental losses are passive: they offset passive income freely, and up to $25,000/yr can offset ordinary (W-2) income if you actively participate and your MAGI is under $100k (phasing out to $0 by $150k); unused losses carry forward. On sale, claimed depreciation is recaptured at up to 25%, and gains may owe capital-gains tax (a 1031 exchange can defer both). Figures are a year-1 estimate at your 24.0% rate — not tax advice; consult a CPA.
Schools (NCES district)
- District
- Peru Community Schools
- NCES district ID
- 1808850
- Math proficiency
- 31% ▼ -9.00%
- Reading proficiency
- 42% ▼ -2.00%
- Median HH income
- $35,624
- Composite
- 30.18/100
- National rank
- #6316
- State rank
- #192 of 301 in IN
Livability — Peru
- Score
- 77/100
- State rank
- #35
- US rank
- #2834
Category grades
Schools grade is shown separately in the Schools card above.
Census & demographics
- Census place
- Peru, IN
- County
- Miami County · 23,020 people
- City population
- 23,020
- Metro
- Peru, IN
- Population (ZIP)
- 23,020
- Household income
- $57,842
- Rent vs Own
- Severe rent burden
- 498.0
Population outlook (Miami County) Hauer SSP2
- Today (2025)
- 34,421 people
- By 2030
- 33,571 · -2.5%
- By 2040
- 31,919 · -7.3%
- By 2050
- 30,313 · -11.9%
- By 2075
- 26,202 · -23.9%
- By 2100
- 20,856 · -39.4%
Race, ethnicity, and origin ACS 2023
- Neighborhood character
- Predominantly White (87%)
- Race & ethnicity
- White 87% Two or more races 6% Hispanic / Latino 4% Black 3%
- Common ancestry
- Iranian 2% Romanian 2% Slovak 2%
- Foreign-born
- 1% · Canada
- Languages at home
- 97% English-only · Spanish 2% German/W. Germanic 0%
Political lean MEDSL · Miami
- 2024 margin
- Solid R (+54.5) · D 21.8% · R 76.3% · Other 1.9%
- 2008→2024 swing
- -35.1pp toward R · 2008: -19.5pp · 2024: -54.5pp
- All cycles
- 2024: R+54.5 2020: R+53.1 2016: R+53.6 2012: R+30.9 2008: R+19.5
Not yet ingested
- Civics
- —
Market trends
- HPI YoY
- ▼ -24.29%
- Current HPI
- 252.7166
- Rent YoY
- —
- Metro
- Peru, IN
- State GDP YoY
- ▲ 2.90%
- F500 in state
- 18
Industry mix (Fortune 500 HQ in IN)
| Industry | F500 HQs | Revenue |
|---|---|---|
| Industrial Machinery | 2 | $37B |
|
||
| Healthcare | 1 | $177B |
|
||
| Pharmaceuticals | 1 | $45B |
|
||
| Metals / Steel | 1 | $18B |
|
||
| Agriculture | 1 | $17B |
|
||
| Packaging | 1 | $12B |
|
||
Price history
+130.6% since first listed8 events — show timeline
- 2026-06-18 Listed $92,000 IRMLS
- 2023-08-04 Sold (MLS) $90,000 IRMLS
- 2023-07-03 Contingent — IRMLS
- 2023-06-25 Listed $90,000 IRMLS
- 2021-05-27 Sold (MLS) $43,000 IRMLS
- 2021-05-13 Listed $42,900 IRMLS
- 2016-11-18 Listed $29,500 IRMLS
- 2016-01-27 Listed $39,900 IRMLS
Property tax history
+11.9%/yrLatest (2024): $809 · +54.3% YoY. Source: county tax records.
Cash-flow waterfall
monthlySold comps — $/sqft
last 12 mo · ≤1 miLoading sold comps…