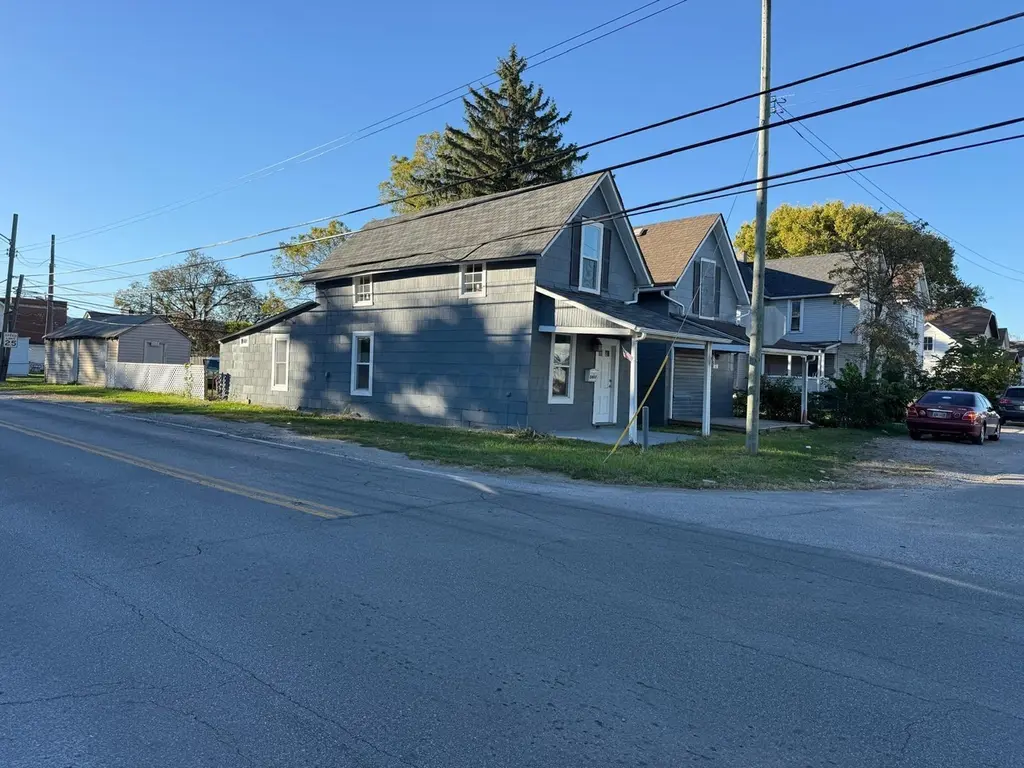
2407 S 6th St · Columbus, OH
Flood risk 1/10 · Minimal
- FEMA flood zone
- X (unshaded)
- Chance of flooding over 30 yrs
- 0.0%
- Est. flood insurance / yr
- $507 – $1,088
Fire risk 1/10 · Minimal
- Est. fire insurance / yr
- $713 – $1,323
Heat risk 4/10 · Minor
- Hot days now (above 100°F)
- 7 days/yr
- Hot days in 30 yrs
- 18 days/yr
Wind risk 2/10 · Minimal
- Chance of severe wind over 30 yrs
- 1.0%
Air-quality risk 3/10 · Minor
- Unhealthy air days now
- 2 days/yr
- Unhealthy air days in 30 yrs
- 3 days/yr
Risk factors via First Street. Map © Google.
Why this score? — see what drove the B- grade
The composite is a weighted blend of 9 inputs, each scored 0–100. Each bar is that input's sub-score; the figure is the points it added to the 100-point composite (weight × sub-score).
- Cash flow +27.1/30.0
- ARV discount +15.0/15.0
- DSCR +9.4/10.0
- 1% rule +7.0/10.0
- Livability +4.0/5.0
- Rent growth +3.1/5.0
- Condition / age +2.5/5.0
- Schools +1.7/10.0
- Appreciation +0.0/10.0
$110,000
🖨 Deal sheet 📄 Offer letter ✓ Due diligence
Listing remarks
Price Just Reduced for a Quick Sale! Charming 2-bedroom, 1-bath Cape Cod offering an excellent opportunity for both owner-occupants and investors. The seller has just reduced the price and is highly motivated, creating exceptional value for buyers looking to act quickly. Whether you're searching for a place to call home or a strong rental investment, this property offers tremendous potential and endless possibilities. Don't miss this opportunity--schedule your showing today before it's gone!
Key facts
- 2,613 sq ft lot
- Built 1900
- Listed 42 days
Property features AI
Exterior
- Parking: On-street parking
- Utilities: Public water; Public sewer
- Home design: Single family residence; Two levels; No shared/common walls; Built in 1900
- Construction: Poured foundation
- Exterior features: Other exterior features
Interior
- Flooring: Wood flooring; Carpeted areas
- Bathrooms: 1 full bathroom
- Heating & cooling: Forced air heating; Hot water heating
- Interior features: Crawl space basement; Living area approximately 958
Neighborhood map
What this means for you Summary
Snapshot
- This is a 2-bed/1.0-bath single-family listed at $110k.
Deal economics
- At list price, monthly cash flow is $310 ($4k/yr) — positive.
- The deal already cash-flows at list — no discount required.
- Meets the 1% rule at list price ($1k rent vs $110k).
- Recommended offer: $107k (3.0% below list) — sets the bar for market timing.
- Cap rate 9.7% vs local median 3.8% in Columbus — top-decile yield for the area; either an underpriced asset or a hidden risk that comps aren't pricing in. Stress-test before assuming the spread holds.
Location & tenants
- Location reads 81/100 on livability (#97 in OH, #1,491 nationally) — a professional / high-income tenant draw. Strengths: commute A+, cost of living A+, housing A+; Watch: employment C-, crime F.
- Columbus City School District (urban): math 15% / reading 26% proficiency, ranked #626 of 656 in OH (top 95%) — low school quality limits family demand, transient renter base, plan for 1-2y turnover; 72% free/reduced lunch — lower-income household profile, screen leases tightly.
- Market conditions: Rents rising (+2.3%/yr); 196 active listings in the ZIP; 19 comparable units currently listed for rent nearby; rentals at typical pace (median 24d on market — plan ~3-4 weeks tenant-placement turnaround); 8,139 units permitted in Franklin County in 2024 (5,940 in 5+ unit buildings).
Forward outlook
- Local home prices are declining (-3.0%/yr); year-one equity from $761 of loan paydown is wiped out by about $3k of value loss. Plan a longer hold.
- Franklin County population projected at +34% by 2050 — long-run rental-demand tailwind backs the buy-and-hold thesis.
- At projected returns (-3.0% appreciation + 2.3% rent growth), your $31k cash investment doubles in ~10 years — after that, you're playing with house money.
Negotiation context
- It's been on market 42 days — a 3% lower offer ($107k) is reasonable based on typical stale-listing flexibility.
- 10 sale attempts since 31y ago; this cycle's ask has dropped $10k (8%) from the opening price — seller is motivated, your offer sets the floor, not the list.
Risks & watch-outs
- Watch-outs: built in 1900 — expect roof / HVAC / electrical / plumbing capex.
Questions for the listing agent
- It's been on market 42 days. Have you received any prior offers? Is the seller open to a 3% concession, seller financing, or rate buy-down credit?
- Built in 1900 — when were the roof, HVAC, electrical panel, plumbing, and water heater last replaced?
- Is there a deadline driving the sale (1031 exchange, divorce, estate, relocation)? That informs how much negotiation room exists.
- Crime grade is F in this area — have there been break-ins, vandalism, or insurance claims at this property in the last 3 years? What carrier currently insures it and at what premium?
- What's the average days-on-market for RENTAL listings here right now (not sales)? A rising rental-DOM trend means longer vacancies and softer asking-rent achievability than the comps imply.
- What's the recent tenant-quality profile in this submarket — average credit score on applications, eviction rate, late-payment / NSF rate, and stable-employment percentage? A property-management company in the area should have these aggregated.
- How much new for-sale + rental construction is in the pipeline within 1–3 miles? Heavy new supply typically softens prices + rents 12–24 months out; constrained supply supports both.
Investment metrics
- 1% rule
- 1.20% ✓
- Cap rate
- 9.68%
- Cash-on-cash
- 12.10%
- DSCR
- 1.54
- GRM
- 6.9
CMA / ARV
- ARV (median comp)
- $161,169
- List price
- $110,000
- Delta
- -31.75%
- Verdict
- UNDERPRICED
- Comps
- 20 within 1.0 mi
Show comp detail 12 sales within ~0.75 mi
| Address | Dist | Beds/Ba | Sqft | Sold | Price | $/sf | Match |
|---|---|---|---|---|---|---|---|
| 168 Benfield Ave | 0.06mi | 3/1.0 (+1) | 960 (+0%) | 8mo | $60,000 | $63 | 85 |
| 2501 S 6th St | 0.09mi | 3/1.0 (+1) | 864 (-10%) | 2mo | $170,559 | $197 | 72 |
| 164 E Alcott Rd | 0.45mi | 3/1.0 (+1) | 924 (-4%) | 6mo | $161,500 | $175 | 63 |
| 228 Ziegler Ave | 0.67mi | 3/1.0 (+1) | 948 (-1%) | 1mo | $225,000 | $237 | 61 |
| 82 Delray Rd | 0.20mi | 2/2.0 | 840 (-12%) | 6mo | $135,000 | $161 | 61 |
| 229 Southard Dr | 0.27mi | 2/1.0 | 833 (-13%) | 6mo | $129,000 | $155 | 60 |
| 2676 Shelly Dr | 0.66mi | 3/1.0 (+1) | 925 (-3%) | 1mo | $111,980 | $121 | 58 |
| 2750 Gibson Dr | 0.68mi | 3/1.0 (+1) | 925 (-3%) | 0mo | $145,000 | $157 | 57 |
| 2893 Parsons Ave | 0.67mi | 3/1.0 (+1) | 924 (-4%) | 0mo | $170,000 | $184 | 57 |
| 2808 Dolby Dr | 0.71mi | 3/1.0 (+1) | 925 (-3%) | 4mo | $215,000 | $232 | 53 |
| 2901 Parsons Ave | 0.68mi | 3/1.0 (+1) | 924 (-4%) | 6mo | $167,000 | $181 | 52 |
| 145 Ziegler Ave | 0.70mi | 3/1.0 (+1) | 1,053 (+10%) | 7mo | $205,000 | $195 | 40 |
Match score weights: distance 35% · size 25% · config 20% · recency 20%. Top-matched comps best support the ARV.
Projected returns pro-forma
-3.0% appreciation · 2.32% rent growth · sell at horizon
- IRR
- 0.9%
- Equity multiple
- 1.03×
- Total profit
- $1,056
- Equity at exit
- $16,401
- IRR
- 9.9%
- Equity multiple
- 1.74×
- Total profit
- $22,761
- Equity at exit
- $9,511
Cash invested: $30,800 (down + closing). Projections, not guarantees.
Landlord ↔ Tenant lean methodology
- Overall (STATE)
- 73 Landlord-Friendly
- State Ohio
- 73 Landlord-Friendly · R+6
- County
- — inherits STATE
- City
- — inherits STATE
ZIP-level market 43207
- Rents YoY
- 2.3%
- Active inventory
- 196
- Price-to-rent
- 6.9×
Monthly cashflow live
- Estimated rent
- $1,322 high interval (Pro) →
- Mortgage (P&I)
- −$577
- Tax from tax record
- −$112 /mo · $1,338/yr
- Insurance
- −$46
- HOA
- −$0
- Vacancy / Maint / Mgmt
- −$278
- Net cashflow
- $310
Break-even live
UW: 25.0% down · 7.5% · 30yr · 1.5% tax · 5.0% vac · 8.0% maint · 8.0% mgmt
Financing live
Cash to close
- Down payment
- $27,500
- Closing costs
- $3,300
- Reserves months
- —
- Total cash needed
- —
Loan-product check · same deal, 3 products live
Conventional
25% down · 7.5% · 30yr
- Down + closing
- —
- Monthly P&I
- —
- Monthly cashflow
- —
- DSCR
- —
- Eligible?
- —
Personal DTI + credit; lowest rate.
DSCR
20% down · 8.5% · 30yr
- Down + closing
- —
- Monthly P&I
- —
- Monthly cashflow
- —
- DSCR
- —
- Eligible?
- —
No personal income docs; deal must DSCR.
Hard money
10% down · 12.0% · 12mo
- Down + closing
- —
- Monthly P&I
- —
- Monthly cashflow
- —
- DSCR
- —
- Eligible?
- —
Short-term bridge; refi at stabilization.
Rent comps 19 comps
| Address | Beds | Baths | Sqft | Rent | $/sqft | DOM | Units | Dist |
|---|---|---|---|---|---|---|---|---|
| 257 Benfield Ave Unit NA Columbus, OH | 3.0 | 1.0 | 1094 | $1,400 | $1.28 | 7d | 1 | 0.14mi |
| 54-56 Benfield Ave Unit 56 Columbus, OH | 2.0 | 1.0 | 800 | $925 | $1.16 | 23d | 1 | 0.21mi |
| 55 Fornof Rd Columbus, OH | 1.0–4.0 | 1.0–2.0 | 924 | $1,620 | $1.75 | 1d | 1 | 0.21mi |
| 2866 Hillgate Rd Columbus, OH | 3.0 | 1.0 | 1040 | $1,693 | $1.63 | 23d | 1 | 0.65mi |
| 274 E Barthman Ave Columbus, OH | 2.0 | 1.0 | 960 | $1,500 | $1.56 | 17d | 1 | 0.77mi |
| 3011 Markham Rd Unit 3011A Columbus, OH | 2.0 | 1.0 | 750 | $899 | $1.20 | 23d | 1 | 0.86mi |
| 1808 S 6th St Unit 1808 Columbus, OH | 2.0 | 1.0 | 975 | $1,050 | $1.08 | 43d | 1 | 0.87mi |
| 1843 Parsons Ave Columbus, OH | 2.0 | 1.0 | 899 | $1,331 | $1.48 | 23d | 1 | 0.90mi |
| 838 Lock Ave Columbus, OH | 3.0 | 1.0 | 988 | $1,578 | $1.60 | 2d | 1 | 0.93mi |
| 2997 S High St Columbus, OH | 1.0–4.0 | 1.0–2.0 | 1151 | $1,319 | $1.15 | 1d | 27 | 0.95mi |
| 206 E Woodrow Ave Columbus, OH | 2.0 | 1.0 | 999 | $1,295 | $1.30 | 43d | 1 | 1.01mi |
| 362 E Hinman Ave Columbus, OH | 2.0 | 1.0 | 879 | $1,149 | $1.31 | 43d | 1 | 1.08mi |
| 367 E Morrill Ave Columbus, OH | 2.0 | 1.0 | 977 | $1,450 | $1.48 | 43d | 1 | 1.12mi |
| 1598-1600 S 4th St Columbus, OH | 2.0 | 1.0 | 855 | $1,250 | $1.46 | 43d | 1 | 1.15mi |
| 33 W Morrill Ave Columbus, OH | 1.0–3.0 | 1.0–2.0 | 935 | $1,134 | $1.21 | 7d | 4 | 1.21mi |
| 22 E Welch Ave Apt 4 Columbus, OH | 1.0 | 1.0 | 537 | $923 | $1.72 | 3d | 1 | 1.26mi |
| 27 W Jenkins Ave Columbus, OH | 2.0–3.0 | 1.0–1.5 | 1013 | $1,137 | $1.12 | 7d | 4 | 1.44mi |
| 490-492 E Jenkins Ave Unit 490 Columbus, OH | 3.0 | 1.0 | 1050 | $1,325 | $1.26 | 43d | 1 | 1.44mi |
| 546 E Jenkins Ave Unit 1 Columbus, OH | 2.0 | 1.0 | 975 | $1,295 | $1.33 | 23d | 1 | 1.46mi |
Listing history 45 events
-
2026-06-18days on market $110,000 Active 42 DOM
-
2026-06-17days on market $110,000 Active 41 DOM
-
2026-06-16days on market $110,000 Active 40 DOM
-
2026-06-15days on market $110,000 Active 39 DOM
-
2026-06-13remarks 499-char remark
-
2026-06-13pricedays on market $110,000 Active 37 DOM
-
2026-06-13days on market $120,000 Active 36 DOM
-
2026-06-09days on market $120,000 Active 33 DOM
-
2026-06-08days on market $120,000 Active 32 DOM
-
2026-06-07days on market $120,000 Active 31 DOM
-
2026-06-05days on market $120,000 Active 28 DOM
-
2026-06-03days on market $120,000 Active 27 DOM
-
2026-06-02days on market $120,000 Active 26 DOM
-
2026-06-01days on market $120,000 Active 25 DOM
-
2026-05-31days on market $120,000 Active 24 DOM
-
2026-05-07$120,000 Active 345-char remark
-
2026-04-24status Pending
-
2026-04-24historical
-
2026-03-12status Active
-
2026-03-12historical
-
2026-03-11$160,000 Active
-
2026-03-11$160,000 Active
-
2026-03-10historical
-
2026-03-10historical
-
2024-03-21soldstatus $105,000
-
2024-03-14soldstatus $73,500 Closed
-
2024-02-26status Pending
-
2024-02-07$150,000 Active
-
2021-04-02soldstatus $39,500
-
2016-04-01historical
-
2016-01-11price $15,000
-
2016-01-04price $20,000
-
2015-12-13$25,000 Active
-
2015-05-05soldstatus $13,000
-
2015-04-30soldstatus $6,500
-
2015-04-08historical
-
2015-03-24$7,900
-
2010-08-27soldstatus $11,000
-
2010-08-11historical
-
2010-06-21$14,500
-
2009-10-30historical
-
2009-08-31$45,000
-
1996-03-18soldstatus $23,500
-
1996-03-13historical
-
1995-03-15$27,900
ⓘ Source: listings_history table (triggers on properties + properties_extension) + one-shot
backfill from property_details.listing_events for pre-trigger history.
Tax reassessment forecast OH · Partial reset (capped growth)
- Current annual tax
- $1,338 · $112/mo
- Projected year-2 tax
- $1,527 · $127/mo
- Expected delta
- +$189/yr (+$16/mo · 14.1%)
ⓘ Screening estimate from a state-policy table — verify with the county assessor before closing.
Climate risk First Street
- Flood 1/10 Low FEMA zone X (unshaded) · 0% chance over 30 yrs
- Wildfire 1/10 Low
- Heat 4/10 Moderate 7 d/yr ≥100°F today · 18 d/yr by 30 yrs out
- Wind 2/10 Low 100% chance of damaging wind over 30 yrs
- Air quality 3/10 Moderate 2 unhealthy d/yr today · 3 by 30 yrs out
Nearby sold comps map
Loading sold comps map…
Walkable amenities ~0.75 mi
Loading nearby amenities…
Taxation est. · year 1
- Rental income
- $15,869
- − Mortgage interest
- −$6,162
- − Property taxes
- −$1,338
- − Insurance
- −$550
- − Repairs & maintenance
- −$1,270
- − Management
- −$1,270
- − Depreciation
- −$3,200
- Taxable income
- $2,080
- Est. tax owed @ 24.0%
- −$499
- After-tax cash flow
- $3,227/yr
For passive investors: Depreciation is non-cash, so a rental often shows a tax loss while cash-flowing — sheltering income. Rental losses are passive: they offset passive income freely, and up to $25,000/yr can offset ordinary (W-2) income if you actively participate and your MAGI is under $100k (phasing out to $0 by $150k); unused losses carry forward. On sale, claimed depreciation is recaptured at up to 25%, and gains may owe capital-gains tax (a 1031 exchange can defer both). Figures are a year-1 estimate at your 24.0% rate — not tax advice; consult a CPA.
Schools (NCES district)
- District
- Columbus City School District
- NCES district ID
- 3904380
- Math proficiency
- 15% ▼ -17.00%
- Reading proficiency
- 26% ▼ -12.00%
- Median HH income
- $38,483
- Composite
- 17.19/100
- National rank
- #9105
- State rank
- #626 of 656 in OH
Livability — Columbus
- Score
- 81/100
- State rank
- #97
- US rank
- #1491
Category grades
Schools grade is shown separately in the Schools card above.
Census & demographics
- Census place
- Columbus, OH
- County
- Franklin County · 1,351,780 people
- City population
- 612,189
- Metro
- Columbus, OH
- Population (ZIP)
- 47,272
- Household income
- $63,310
- Rent vs Own
- Severe rent burden
- 1679.0
Population outlook (Franklin County) Hauer SSP2
- Today (2025)
- 1,456,139 people
- By 2030
- 1,556,890 · +6.9%
- By 2040
- 1,757,349 · +20.7%
- By 2050
- 1,950,539 · +34.0%
- By 2075
- 2,376,171 · +63.2%
- By 2100
- 2,636,796 · +81.1%
Race, ethnicity, and origin ACS 2023
- Neighborhood character
- Diverse neighborhood (Simpson 0.57)
- Race & ethnicity
- White 59% Black 28% Two or more races 7% Hispanic / Latino 5% Asian 1%
- Hispanic origin (detail)
- Mexican 3%
- Common ancestry
- Italian 2% Romanian 2% Slovak 1%
- Foreign-born
- 4% · Canada
- Languages at home
- 95% English-only · Spanish 3% Other Indo-European 1%
Political lean MEDSL · Franklin
- 2024 margin
- Strong D (+28.4) · D 63.7% · R 35.3% · Other 1.0%
- 2008→2024 swing
- +7.7pp toward D · 2008: 20.7pp · 2024: 28.4pp
- All cycles
- 2024: D+28.4 2020: D+31.4 2016: D+25.9 2012: D+21.7 2008: D+20.7
Not yet ingested
- Civics
- —
Market trends
- HPI YoY
- ▼ -244.33%
- Current HPI
- 268.3028
- Rent YoY
- ▲ 2.32%
- Metro
- Columbus, OH
- State GDP YoY
- ▲ 1.98%
- F500 in state
- 48
Industry mix (Fortune 500 HQ in OH)
| Industry | F500 HQs | Revenue |
|---|---|---|
| Insurance | 3 | $145B |
|
||
| Industrial Machinery | 3 | $49B |
|
||
| Financial Services | 3 | $24B |
|
||
| Consumer Goods | 2 | $93B |
|
||
| Aerospace / Defense | 2 | $47B |
|
||
| Utilities | 2 | $33B |
|
||
Price history
+294.3% since first listed31 events — show timeline
- 2026-06-13 Price Changed $110,000 CBRMLS
- 2026-05-07 Listed $120,000 CBRMLS
- 2026-04-24 Pending — CBRMLS
- 2026-04-24 Listing Removed — CBRMLS
- 2026-03-12 Relisted — CBRMLS
- 2026-03-12 Listing Removed — CBRMLS
- 2026-03-11 Listed $160,000 CBRMLS
- 2026-03-11 Listed $160,000 CBRMLS
- 2026-03-10 Coming Soon — CBRMLS
- 2026-03-10 Listing Removed — CBRMLS
- 2024-03-21 Sold (Public Records) $105,000 Public Records
- 2024-03-14 Sold (MLS) $73,500 CBRMLS
- 2024-02-26 Pending — CBRMLS
- 2024-02-07 Listed $150,000 CBRMLS
- 2021-04-02 Sold (Public Records) $39,500 Public Records
- 2016-04-01 Listing Removed — CBRMLS
- 2016-01-11 Price Changed $15,000 CBRMLS
- 2016-01-04 Price Changed $20,000 CBRMLS
- 2015-12-13 Listed $25,000 CBRMLS
- 2015-05-05 Sold (Public Records) $13,000 Public Records
- 2015-04-30 Sold (MLS) $6,500 CBRMLS
- 2015-04-08 Listing Removed — CBRMLS
- 2015-03-24 Listed $7,900 CBRMLS
- 2010-08-27 Sold (MLS) $11,000 CBRMLS
- 2010-08-11 Listing Removed — CBRMLS
- 2010-06-21 Listed $14,500 CBRMLS
- 2009-10-30 Listing Removed — CBRMLS
- 2009-08-31 Listed $45,000 CBRMLS
- 1996-03-18 Sold (Public Records) $23,500 Public Records
- 1996-03-13 Listing Removed — CBRMLS
- 1995-03-15 Listed $27,900 CBRMLS
Property tax history
+9.8%/yrLatest (2024): $1,338 · +1.3% YoY. Source: county tax records.
Cash-flow waterfall
monthlySold comps — $/sqft
last 12 mo · ≤1 miLoading sold comps…