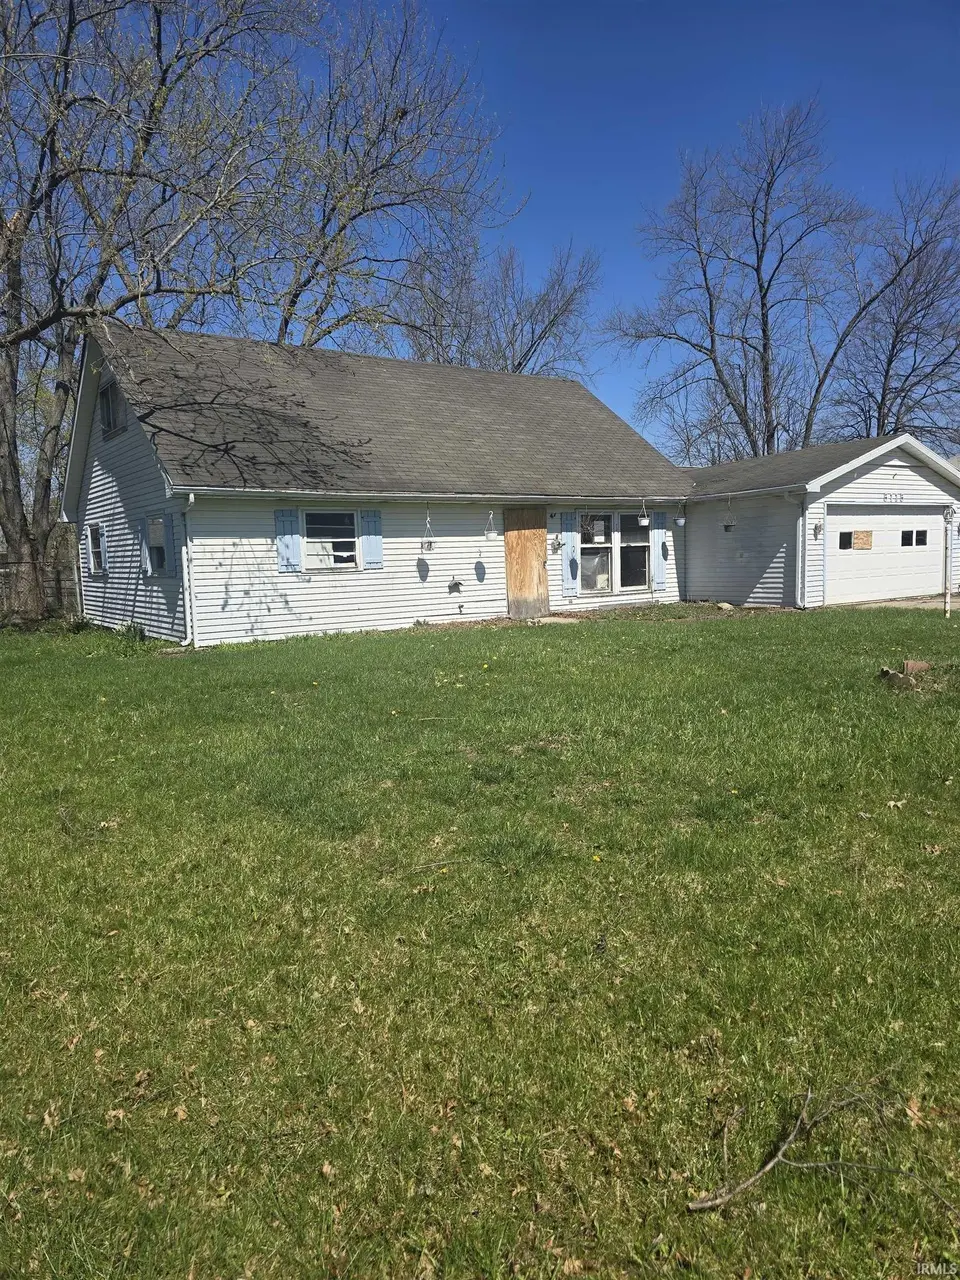
5115 Woodway Dr · Fort Wayne, IN
Flood risk 1/10 · Minimal
- FEMA flood zone
- X (unshaded)
- Chance of flooding over 30 yrs
- 0.0%
- Est. flood insurance / yr
- $507 – $1,088
Fire risk 1/10 · Minimal
- Est. fire insurance / yr
- $717 – $1,331
Heat risk 3/10 · Minor
- Hot days now (above 100°F)
- 7 days/yr
- Hot days in 30 yrs
- 17 days/yr
Wind risk 2/10 · Minimal
- Chance of severe wind over 30 yrs
- —
Air-quality risk 3/10 · Minor
- Unhealthy air days now
- 2 days/yr
- Unhealthy air days in 30 yrs
- 3 days/yr
Risk factors via First Street. Map © Google.
Why this score? — see what drove the B grade
The composite is a weighted blend of 9 inputs, each scored 0–100. Each bar is that input's sub-score; the figure is the points it added to the 100-point composite (weight × sub-score).
- Cash flow +30.0/30.0
- 1% rule +10.0/10.0
- DSCR +10.0/10.0
- ARV discount +7.5/15.0
- Rent growth +4.7/5.0
- Livability +4.2/5.0
- Condition / age +2.5/5.0
- Schools +2.2/10.0
- Appreciation +0.0/10.0
$125,000
🖨 Deal sheet 📄 Offer letter ✓ Due diligence
Listing remarks MLS
Opportunity & Potential await the very skilled homeowner or investor with this spacious 2 Story home - 4BR/2BA - Living room - Family room - Great/Rec room - Laundry area - Eat-in kitchen - Oversized attached garage - Fenced yard w/ patio - Close to schools, shopping, parks and everyday needs. Sold as-is, CASH offers only. Taxes may change based on exemptions or lack there of. * Sale Subject to seller's addendum. EMD to be 5% or $5000 whichever is greater & held by seller's title co. Subject to OFAC clearance. Viewing/showing release required. * * Due to interior condition - viewings are to be outside only.
Key facts
- Close to parks
- Close to schools
- Fenced yard
Tags
Neighborhood map
What this means for you Summary
Snapshot
- This is a 4-bed/2.0-bath single-family listed at $125k.
Deal economics
- At list price, monthly cash flow is $637 ($8k/yr) — positive.
- The deal already cash-flows at list — no discount required.
- Meets the 1% rule at list price ($2k rent vs $125k).
- Recommended offer: $121k (3.0% below list) — sets the bar for market timing.
- Cap rate 12.4% vs local median 4.8% in Fort Wayne — top-decile yield for the area; either an underpriced asset or a hidden risk that comps aren't pricing in. Stress-test before assuming the spread holds.
Location & tenants
- Location reads 84/100 on livability (#6 in IN, #676 nationally) — a professional / high-income tenant draw. Strengths: amenities A+, commute A+, cost of living A+; Watch: crime C-, schools D+, employment D+.
- Fort Wayne Community Schools (urban): math 22% / reading 29% proficiency, ranked #263 of 301 in IN (top 87%) — low school quality limits family demand, transient renter base, plan for 1-2y turnover; 60% free/reduced lunch — lower-income household profile, screen leases tightly.
- Market conditions: Rents rising fast (+8.9%/yr); 181 active listings in the ZIP; 2 comparable units currently listed for rent nearby; solid renter incomes; 1,861 units permitted in Allen County in 2024 (576 in 5+ unit buildings).
- This rent runs 30% of the median local income ($77k/yr) — at the standard rent-burdened threshold; future hikes will face affordability resistance.
Forward outlook
- Local home prices are declining (-3.0%/yr); year-one equity from $864 of loan paydown is wiped out by about $4k of value loss. Plan a longer hold.
- Allen County population projected at +10% by 2050 — modest demand growth; plan on rents tracking national, not racing it.
- At projected returns (-3.0% appreciation + 8.0% rent growth), your $35k cash investment doubles in ~5 years — after that, you're playing with house money.
Negotiation context
- It's been on market 39 days — a 3% lower offer ($121k) is reasonable based on typical stale-listing flexibility.
Questions for the listing agent
- It's been on market 39 days. Have you received any prior offers? Is the seller open to a 3% concession, seller financing, or rate buy-down credit?
- Built in 1973 — when were the roof, HVAC, electrical panel, plumbing, and water heater last replaced?
- Is there a deadline driving the sale (1031 exchange, divorce, estate, relocation)? That informs how much negotiation room exists.
- Schools are D-rated, which usually means shorter tenancies and higher turnover. Who's the typical renter profile here, and what's been the actual vacancy rate?
- What's the average days-on-market for RENTAL listings here right now (not sales)? A rising rental-DOM trend means longer vacancies and softer asking-rent achievability than the comps imply.
- What's the recent tenant-quality profile in this submarket — average credit score on applications, eviction rate, late-payment / NSF rate, and stable-employment percentage? A property-management company in the area should have these aggregated.
- How much new for-sale + rental construction is in the pipeline within 1–3 miles? Heavy new supply typically softens prices + rents 12–24 months out; constrained supply supports both.
Investment metrics
- 1% rule
- 1.55% ✓
- Cap rate
- 12.41%
- Cash-on-cash
- 21.83%
- DSCR
- 1.97
- GRM
- 5.4
CMA / ARV
- ARV (median comp)
- $261,615
- List price
- $125,000
- Delta
- -52.22%
- Verdict
- UNDERPRICED
- Comps
- 20 within 1.0 mi
Show comp detail 12 sales within ~0.75 mi
| Address | Dist | Beds/Ba | Sqft | Sold | Price | $/sf | Match |
|---|---|---|---|---|---|---|---|
| 5115 Woodway Dr | 0.00mi | 4/2.0 | 2,686 (0%) | 0mo | $110,000 | $41 | 100 |
| 4522 Wyndemere Ln | 0.55mi | 3/2.5 (-1) | 2,669 (-1%) | 6mo | $383,900 | $144 | 61 |
| 4811 Innsbruck Dr | 0.53mi | 4/2.5 | 2,492 (-7%) | 1mo | $310,000 | $124 | 60 |
| 4721 Ottawa Dr | 0.64mi | 4/2.5 | 2,524 (-6%) | 6mo | $230,000 | $91 | 54 |
| 6027 Midwood Dr | 0.52mi | 4/2.0 | 2,364 (-12%) | 9mo | $259,900 | $110 | 48 |
| 5223 Stellhorn Rd | 0.58mi | 5/2.0 (+1) | 2,382 (-11%) | 2mo | $225,000 | $94 | 48 |
| 4519 Haffner Dr | 0.56mi | 4/2.0 | 2,376 (-12%) | 14mo | $216,500 | $91 | 43 |
| 6025 Ranger Trl | 0.49mi | 5/2.5 (+1) | 2,315 (-14%) | 7mo | $300,000 | $130 | 41 |
| 4232 Wyndemere Pass | 0.68mi | 3/2.5 (-1) | 2,928 (+9%) | 12mo | $400,000 | $137 | 36 |
| 5318 Bellmawr Ln | 0.67mi | 3/3.0 (-1) | 2,350 (-12%) | 4mo | $279,900 | $119 | 36 |
| 5002 Wheaton Ct | 0.68mi | 5/3.0 (+1) | 2,368 (-12%) | 8mo | $275,000 | $116 | 33 |
| 4221 Thorngate Dr | 0.73mi | 4/2.5 | 2,339 (-13%) | 11mo | $301,000 | $129 | 33 |
Match score weights: distance 35% · size 25% · config 20% · recency 20%. Top-matched comps best support the ARV.
Projected returns pro-forma
-3.0% appreciation · 8.0% rent growth · sell at horizon
- IRR
- 20.2%
- Equity multiple
- 1.87×
- Total profit
- $30,613
- Equity at exit
- $18,638
- IRR
- 31.7%
- Equity multiple
- 4.59×
- Total profit
- $125,806
- Equity at exit
- $10,808
Cash invested: $35,000 (down + closing). Projections, not guarantees.
Landlord ↔ Tenant lean methodology
- Overall (STATE)
- 90 Strongly Landlord-Friendly
- State Indiana
- 90 Strongly Landlord-Friendly · R+11
- County
- — inherits STATE
- City
- — inherits STATE
ZIP-level market 46835
- Rents YoY
- 8.9%
- Active inventory
- 181
- Price-to-rent
- 5.4×
Monthly cashflow live
- Estimated rent
- $1,943 medium interval (Pro) →
- Mortgage (P&I)
- −$656
- Tax from tax record
- −$191 /mo · $2,286/yr
- Insurance
- −$52
- HOA
- −$0
- Vacancy / Maint / Mgmt
- −$408
- Net cashflow
- $637
Break-even live
UW: 25.0% down · 7.5% · 30yr · 1.5% tax · 5.0% vac · 8.0% maint · 8.0% mgmt
Financing live
Cash to close
- Down payment
- $31,250
- Closing costs
- $3,750
- Reserves months
- —
- Total cash needed
- —
Loan-product check · same deal, 3 products live
Conventional
25% down · 7.5% · 30yr
- Down + closing
- —
- Monthly P&I
- —
- Monthly cashflow
- —
- DSCR
- —
- Eligible?
- —
Personal DTI + credit; lowest rate.
DSCR
20% down · 8.5% · 30yr
- Down + closing
- —
- Monthly P&I
- —
- Monthly cashflow
- —
- DSCR
- —
- Eligible?
- —
No personal income docs; deal must DSCR.
Hard money
10% down · 12.0% · 12mo
- Down + closing
- —
- Monthly P&I
- —
- Monthly cashflow
- —
- DSCR
- —
- Eligible?
- —
Short-term bridge; refi at stabilization.
Rent comps 2 comps
| Address | Beds | Baths | Sqft | Rent | $/sqft | DOM | Units | Dist |
|---|---|---|---|---|---|---|---|---|
| 4725 Maple Terrace Pkwy Fort Wayne, IN | 4.0 | 2.0 | 2068 | $2,200 | $1.06 | 13d | 1 | 1.02mi |
| 6879 Solid Rock Dr Fort Wayne, IN | 3.0 | 2.5 | 1900 | $2,000 | $1.05 | 43d | 1 | 1.18mi |
Listing history 2 events
-
2026-05-19status Pending 627-char remark
Show marketing remark (627 chars)
Opportunity & Potential await the very skilled homeowner or investor with this spacious 2 Story home - 4BR/2BA - Living room - Family room - Great/Rec room - Laundry area - Eat-in kitchen - Oversized attached garage - Fenced yard w/ patio - Close to schools, shopping, parks and everyday needs. Sold as-is, CASH offers only. Taxes may change based on exemptions or lack there of. * Sale Subject to seller's addendum. EMD to be 5% or $5000 whichever is greater & held by seller's title co. Subject to OFAC clearance. Viewing/showing release required. * * Due to interior condition - viewings are to be outside only.
-
2026-04-10$125,000 Active 627-char remark
Show marketing remark (627 chars)
Opportunity & Potential await the very skilled homeowner or investor with this spacious 2 Story home - 4BR/2BA - Living room - Family room - Great/Rec room - Laundry area - Eat-in kitchen - Oversized attached garage - Fenced yard w/ patio - Close to schools, shopping, parks and everyday needs. Sold as-is, CASH offers only. Taxes may change based on exemptions or lack there of. * Sale Subject to seller's addendum. EMD to be 5% or $5000 whichever is greater & held by seller's title co. Subject to OFAC clearance. Viewing/showing release required. * * Due to interior condition - viewings are to be outside only.
ⓘ Source: listings_history table (triggers on properties + properties_extension) + one-shot
backfill from property_details.listing_events for pre-trigger history.
Tax reassessment forecast IN · Partial reset (capped growth)
- Current annual tax
- $2,286 · $191/mo
- Projected year-2 tax
- $2,286 · $191/mo
- Expected delta
- $0/yr ($0/mo · 0.0%)
ⓘ Screening estimate from a state-policy table — verify with the county assessor before closing.
Climate risk First Street
- Flood 1/10 Low FEMA zone X (unshaded) · 0% chance over 30 yrs
- Wildfire 1/10 Low
- Heat 3/10 Moderate 7 d/yr ≥100°F today · 17 d/yr by 30 yrs out
- Wind 2/10 Low
- Air quality 3/10 Moderate 2 unhealthy d/yr today · 3 by 30 yrs out
Nearby sold comps map
Loading sold comps map…
Walkable amenities ~0.75 mi
Loading nearby amenities…
Taxation est. · year 1
- Rental income
- $23,313
- − Mortgage interest
- −$7,002
- − Property taxes
- −$2,286
- − Insurance
- −$625
- − Repairs & maintenance
- −$1,865
- − Management
- −$1,865
- − Depreciation
- −$3,636
- Taxable income
- $6,034
- Est. tax owed @ 24.0%
- −$1,448
- After-tax cash flow
- $6,192/yr
For passive investors: Depreciation is non-cash, so a rental often shows a tax loss while cash-flowing — sheltering income. Rental losses are passive: they offset passive income freely, and up to $25,000/yr can offset ordinary (W-2) income if you actively participate and your MAGI is under $100k (phasing out to $0 by $150k); unused losses carry forward. On sale, claimed depreciation is recaptured at up to 25%, and gains may owe capital-gains tax (a 1031 exchange can defer both). Figures are a year-1 estimate at your 24.0% rate — not tax advice; consult a CPA.
Schools (NCES district)
- District
- Fort Wayne Community Schools
- NCES district ID
- 1803630
- Math proficiency
- 22% ▼ -11.00%
- Reading proficiency
- 29% ▼ -7.00%
- Median HH income
- $41,951
- Composite
- 21.68/100
- National rank
- #8275
- State rank
- #263 of 301 in IN
Livability — Fort Wayne
- Score
- 84/100
- State rank
- #6
- US rank
- #676
Category grades
Schools grade is shown separately in the Schools card above.
Census & demographics
- Census place
- Fort Wayne, IN
- County
- Allen County · 326,813 people
- City population
- 326,813
- Metro
- Fort Wayne, IN
- Population (ZIP)
- 38,166
- Household income
- $77,152
- Rent vs Own
- Severe rent burden
- 961.0
Population outlook (Allen County) Hauer SSP2
- Today (2025)
- 394,020 people
- By 2030
- 405,128 · +2.8%
- By 2040
- 423,476 · +7.5%
- By 2050
- 435,137 · +10.4%
- By 2075
- 450,293 · +14.3%
- By 2100
- 424,101 · +7.6%
Race, ethnicity, and origin ACS 2023
- Neighborhood character
- Predominantly White (77%)
- Race & ethnicity
- White 77% Two or more races 10% Hispanic / Latino 8% Black 6% Asian 3%
- Hispanic origin (detail)
- Mexican 6%
- Common ancestry
- Italian 3% Lithuanian 3% Romanian 2%
- Foreign-born
- 6% · Canada, Vietnam, Philippines
- Languages at home
- 91% English-only · Spanish 3% Other Asian/Pacific 2% Other Indo-European 1%
Political lean MEDSL · Allen
- 2024 margin
- R (+12.5) · D 42.9% · R 55.4% · Other 1.7%
- 2008→2024 swing
- -8.1pp toward R · 2008: -4.3pp · 2024: -12.5pp
- All cycles
- 2024: R+12.5 2020: R+11.2 2016: R+19.6 2012: R+16.8 2008: R+4.3
Not yet ingested
- Civics
- —
Market trends
- HPI YoY
- ▼ -236.62%
- Current HPI
- 236.3419
- Rent YoY
- ▲ 8.95%
- Metro
- Fort Wayne, IN
- State GDP YoY
- ▲ 2.90%
- F500 in state
- 18
Industry mix (Fortune 500 HQ in IN)
| Industry | F500 HQs | Revenue |
|---|---|---|
| Industrial Machinery | 2 | $37B |
|
||
| Healthcare | 1 | $177B |
|
||
| Pharmaceuticals | 1 | $45B |
|
||
| Metals / Steel | 1 | $18B |
|
||
| Agriculture | 1 | $17B |
|
||
| Packaging | 1 | $12B |
|
||
Price history
2 events — show timeline
- 2026-05-19 Pending — IRMLS
- 2026-04-10 Listed $125,000 IRMLS
Property tax history
+5.8%/yrLatest (2024): $2,286 · -1.5% YoY. Source: county tax records.
Cash-flow waterfall
monthlySold comps — $/sqft
last 12 mo · ≤1 miLoading sold comps…