22 Margarita Cir · Las Maravillas, NM
Flood risk 1/10 · Minimal
- FEMA flood zone
- X (unshaded)
- Chance of flooding over 30 yrs
- 0.0%
- Est. flood insurance / yr
- $507 – $1,088
Fire risk 5/10 · Moderate
- Est. fire insurance / yr
- $706 – $1,312
Heat risk 5/10 · Moderate
- Hot days now (above 96°F)
- 7 days/yr
- Hot days in 30 yrs
- 18 days/yr
Wind risk 1/10 · Minimal
- Chance of severe wind over 30 yrs
- —
Air-quality risk 1/10 · Minimal
- Unhealthy air days now
- 0 days/yr
- Unhealthy air days in 30 yrs
- 0 days/yr
Risk factors via First Street. Map © Google.
Why this score? — see what drove the D- grade
The composite is a weighted blend of 9 inputs, each scored 0–100. Each bar is that input's sub-score; the figure is the points it added to the 100-point composite (weight × sub-score).
- Cash flow +12.7/30.0
- ARV discount +7.2/15.0
- Rent growth +5.0/5.0
- DSCR +3.8/10.0
- Livability +2.9/5.0
- 1% rule +2.8/10.0
- Schools +2.6/10.0
- Condition / age +2.5/5.0
- Appreciation +0.0/10.0
$269,900
🖨 Deal sheet (PDF) 📄 Offer letter ✓ Due diligence
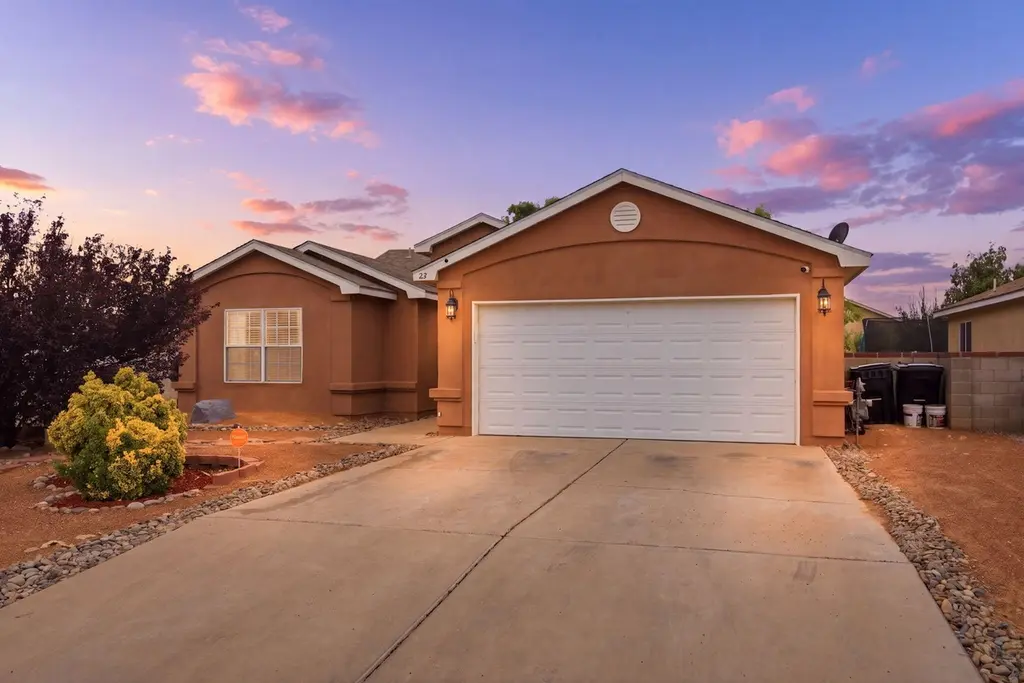
Listing remarks
Well-maintained 2008 home situated on a spacious corner lot with desirable side yard access, offering plenty of room for RV parking, toys, or additional outdoor functionality. This inviting property features 3 bedrooms and 2 bathrooms with a comfortable and functional layout ideal for first-time homebuyers or growing families. Enjoy relaxing summer evenings or entertaining guests under the covered patio overlooking the expansive backyard. Recent upgrades include a newer A/C, furnace, roof, and exterior paint providing added comfort and peace of mind. With ample outdoor space and thoughtful updates throughout, this home offers the perfect opportunity to add your personal touch and truly make
Key facts
- Rv parking
- Newer a/c
- Covered patio
Tags
Property features AI
Finance
- HOA & community: Homeowners association with a $75 quarterly fee; Association fee includes common areas
Exterior
- Parking: Attached garage; 2 garage spaces; RV access/parking
- Security: Smart cameras (recording)
- Utilities: Cable available; Electricity connected; Natural gas connected; Phone available; Sewer connected (public sewer); Underground utilities; Water connected (community/coop)
- Home design: Single-story; Faces east; Slab foundation; Resale property
- Construction: Shingle roof; Frame, stucco and rock construction; Built by B Jar
- Exterior features: Private entrance; Private yard; Smart cameras (recording); Covered patio; Shed(s); Full wall fencing; Landscaped lot; Xeriscape landscaping; City street frontage; Paved road
Interior
- Kitchen: Dishwasher; Free-standing gas range; Disposal; Microwave; Range hood
- Bedrooms: Main level primary
- Flooring: Carpet; Tile
- Bathrooms: Dual sinks; Bathtub; Garden tub/Roman tub; Soaking tub; Separate shower
- Heating & cooling: Central heating; Forced air; Natural gas heating; Refrigerated (cooling)
- Interior features: Breakfast bar; Entrance foyer; Family/dining room; Great room; High ceilings; Kitchen island; Living/dining room; Cable TV; Walk-in closet(s)
- Laundry & utility: Washer hookup; Electric dryer hookup; Gas dryer hookup
Neighborhood map
What this means for you Summary
Snapshot
- This is a 3-bed/2.0-bath single-family listed at $270k.
Deal economics
- At list price, monthly cash flow is $-28 ($-335/yr) — negative.
- To cash-flow at today's rent, offer at most $265k (1.8% below list).
- To meet the 1% rule (rent ≥ 1% of price), the offer needs to be $210k (22.2% below list).
- Recommended offer: $210k (22.2% below list) — sets the bar for 1% rule.
Location & tenants
- Location reads 58/100 on livability (#152 in NM) — a working-class tenant base; expect higher turnover. Strengths: cost of living A+, housing A+; Watch: employment C-, schools F, amenities F.
- Los Lunas Public Schools (suburban): math 20% / reading 34% proficiency, ranked #34 of 95 in NM (top 36%) — low school quality limits family demand, transient renter base, plan for 1-2y turnover; 63% free/reduced lunch — lower-income household profile, screen leases tightly.
- Market conditions: Rents rising fast (+33.2%/yr); 567 active listings in the ZIP; 303 units permitted in Valencia County in 2024 (0 in 5+ unit buildings).
- This rent runs 41% of the median local income ($61k/yr) — at the standard rent-burdened threshold; future hikes will face affordability resistance.
Forward outlook
- Local home prices are declining (-3.0%/yr); year-one equity from $2k of loan paydown is wiped out by about $8k of value loss. Plan a longer hold.
- Valencia County population projected at -14% by 2050 — secular population decline; favor cash flow + early exit over multi-decade hold.
Negotiation context
- Only 3 days on market — expect competitive offers; lowballing is unlikely to land.
Risks & watch-outs
- Climate carrying-cost: moderate wildfire risk; extreme-heat days projected 7→18/yr by 2055 (HVAC capex compounding) — expect insurance premiums to compound above CPI over the hold.
Questions for the listing agent
- What do current leases actually rent for vs. the listed asking? Can we see a recent rent roll and the last 12 months of T-12 income?
- What does the HOA fee cover, when was the last increase, and are there any pending special assessments or reserve-fund shortfalls?
- Is there a deadline driving the sale (1031 exchange, divorce, estate, relocation)? That informs how much negotiation room exists.
- Schools are F-rated, which usually means shorter tenancies and higher turnover. Who's the typical renter profile here, and what's been the actual vacancy rate?
- The area grade is low — what's the realistic commute time and amenity access for the typical tenant pool here? Any planned neighborhood developments (good or bad) we should know about?
- What's the average days-on-market for RENTAL listings here right now (not sales)? A rising rental-DOM trend means longer vacancies and softer asking-rent achievability than the comps imply.
- What's the recent tenant-quality profile in this submarket — average credit score on applications, eviction rate, late-payment / NSF rate, and stable-employment percentage? A property-management company in the area should have these aggregated.
- How much new for-sale + rental construction is in the pipeline within 1–3 miles? Heavy new supply typically softens prices + rents 12–24 months out; constrained supply supports both.
Investment metrics
- 1% rule
- 0.78% ✗
- Cap rate
- 6.17%
- Cash-on-cash
- -0.44%
- DSCR
- 0.98
- GRM
- 10.7
CMA / ARV
- ARV (on-the-fly)
- $268,086
- Comps found
- 7
Show comp detail 7 sales within ~0.75 mi
| Address | Dist | Beds/Ba | Sqft | Sold | Price | $/sf | Match |
|---|---|---|---|---|---|---|---|
| 11 Flores Bonitas Ave | 0.14mi | 3/2.0 | 1,530 (+4%) | 2mo | $300,000 | $196 | 86 |
| 65 Rosa Ave SW | 0.06mi | 3/2.0 | 1,359 (-8%) | 2mo | $248,000 | $182 | 83 |
| 12 Juniper Pl | 0.35mi | 3/2.0 | 1,535 (+4%) | 6mo | $264,000 | $172 | 72 |
| 55 Rosa Ave SW | 0.09mi | 3/2.0 | 1,588 (+8%) | 16mo | $289,900 | $183 | 69 |
| 33 Apache Plume Rd | 0.56mi | 3/2.0 | 1,504 (+2%) | 2mo | $273,000 | $182 | 69 |
| 15 Ash Pl | 0.56mi | 3/2.0 | 1,469 (-0%) | 14mo | $269,000 | $183 | 62 |
| 4 Willow Trce | 0.71mi | 3/2.0 | 1,430 (-3%) | 24mo | $251,000 | $176 | 42 |
Match score weights: distance 35% · size 25% · config 20% · recency 20%. Top-matched comps best support the ARV.
Projected returns pro-forma
-3.0% appreciation · 8.0% rent growth · sell at horizon
- IRR
- -12.1%
- Equity multiple
- 0.54×
- Total profit
- $-34,501
- Equity at exit
- $40,243
- IRR
- 2.7%
- Equity multiple
- 1.24×
- Total profit
- $17,835
- Equity at exit
- $23,336
Cash invested: $75,572 (down + closing). Projections, not guarantees.
Landlord ↔ Tenant lean methodology
- Overall (STATE)
- 55 Moderately Landlord-Leaning
- State New Mexico
- 55 Moderately Landlord-Leaning · D+3
- County
- — inherits STATE
- City
- — inherits STATE
ZIP-level market 87031
- Home prices YoY
- -29.8%
- Rents YoY
- 33.2%
- Active inventory
- 567
- Price-to-rent
- 10.7×
Monthly cashflow live
- Estimated rent
- $2,099 medium interval (Pro) →
- Mortgage (P&I)
- −$1,415
- Tax from tax record
- −$133 /mo · $1,600/yr
- Insurance
- −$112
- HOA
- −$25
- Vacancy / Maint / Mgmt
- −$441
- Net cashflow
- $-28
Break-even live
Sensitivity live
| Price | -10% $125 | -5% $48 | +0% $-28 | +5% $-104 | +10% $-181 |
|---|---|---|---|---|---|
| Rent | -10% $-194 | -5% $-111 | +0% $-28 | +5% $55 | +10% $138 |
| Rate | -1.0pp $108 | -0.5pp $41 | base $-28 | +0.5pp $-98 | +1.0pp $-169 |
UW: 25.0% down · 7.5% · 30yr · 1.5% tax · 5.0% vac · 8.0% maint · 8.0% mgmt
Financing live
Cash to close
- Down payment
- $67,475
- Closing costs
- $8,097
- Reserves months
- —
- Total cash needed
- —
Loan-product check · same deal, 3 products live
Conventional
25% down · 7.5% · 30yr
- Down + closing
- —
- Monthly P&I
- —
- Monthly cashflow
- —
- DSCR
- —
- Eligible?
- —
Personal DTI + credit; lowest rate.
DSCR
20% down · 8.5% · 30yr
- Down + closing
- —
- Monthly P&I
- —
- Monthly cashflow
- —
- DSCR
- —
- Eligible?
- —
No personal income docs; deal must DSCR.
Hard money
10% down · 12.0% · 12mo
- Down + closing
- —
- Monthly P&I
- —
- Monthly cashflow
- —
- DSCR
- —
- Eligible?
- —
Short-term bridge; refi at stabilization.
HOA detail
- Monthly dues
- $25 · $300/yr
Listing history 3 events
-
2026-05-18$269,900 Active
-
2014-11-06soldstatus
-
2008-06-26soldstatus
ⓘ Source: listings_history table (triggers on properties + properties_extension) + one-shot
backfill from property_details.listing_events for pre-trigger history.
Tax reassessment forecast NM · Resets to sale price
- Current annual tax
- $1,600 · $133/mo
- Projected year-2 tax
- $2,159 · $180/mo
- Expected delta
- +$559/yr (+$47/mo · 34.9%)
ⓘ Screening estimate from a state-policy table — verify with the county assessor before closing.
Climate risk First Street
- Flood 1/10 Low FEMA zone X (unshaded) · 0% chance over 30 yrs
- Wildfire 5/10 Major
- Heat 5/10 Major 7 d/yr ≥96°F today · 18 d/yr by 30 yrs out
- Wind 1/10 Low
- Air quality 1/10 Low 0 unhealthy d/yr today · 0 by 30 yrs out
Nearby sold comps map
Loading sold comps map…
Walkable amenities ~0.75 mi
Loading nearby amenities…
Taxation est. · year 1
- Rental income
- $25,189
- − Mortgage interest
- −$15,119
- − Property taxes
- −$1,600
- − Insurance
- −$1,350
- − Repairs & maintenance
- −$2,015
- − Management
- −$2,015
- − HOA
- −$300
- − Depreciation
- −$7,852
- Taxable loss
- −$5,062
- Est. tax savings @ 24.0%
- +$1,215
- After-tax cash flow
- $879/yr
For passive investors: Depreciation is non-cash, so a rental often shows a tax loss while cash-flowing — sheltering income. Rental losses are passive: they offset passive income freely, and up to $25,000/yr can offset ordinary (W-2) income if you actively participate and your MAGI is under $100k (phasing out to $0 by $150k); unused losses carry forward. On sale, claimed depreciation is recaptured at up to 25%, and gains may owe capital-gains tax (a 1031 exchange can defer both). Figures are a year-1 estimate at your 24.0% rate — not tax advice; consult a CPA.
Schools (NCES district)
- District
- Los Lunas Public Schools
- NCES district ID
- 3501680
- Math proficiency
- 20% —
- Reading proficiency
- 34% —
- Median HH income
- $44,438
- Composite
- 26.11/100
- National rank
- #12724
- State rank
- #34 of 95 in NM
Livability — Las Maravillas
- Score
- 58/100
- State rank
- #152
- US rank
- #21394
Category grades
Schools grade is shown separately in the Schools card above.
Census & demographics
- Census place
- Las Maravillas, NM
- County
- Valencia County · 68,779 people
- Metro
- Albuquerque, NM
- Population (ZIP)
- 47,514
- Household income
- $60,902
- Rent vs Own
- Severe rent burden
- 602.0
Population outlook (Valencia County) Hauer SSP2
- Today (2025)
- 73,788 people
- By 2030
- 72,101 · -2.3%
- By 2040
- 67,930 · -7.9%
- By 2050
- 63,191 · -14.4%
- By 2075
- 53,644 · -27.3%
- By 2100
- 40,882 · -44.6%
Race, ethnicity, and origin ACS 2023
- Neighborhood character
- Majority Hispanic (63%)
- Race & ethnicity
- Hispanic / Latino 63% White 30% Two or more races 29% Native American 4% Black 1%
- Hispanic origin (detail)
- Mexican 38%
- Common ancestry
- Serbian 1% Russian 1% Slovak 1%
- Foreign-born
- 8% · Canada
- Languages at home
- 71% English-only · Spanish 27%
Political lean MEDSL · Valencia
- 2024 margin
- R (+16.4) · D 40.9% · R 57.3% · Other 1.8%
- 2008→2024 swing
- -24.1pp toward R · 2008: 7.7pp · 2024: -16.4pp
- All cycles
- 2024: R+16.4 2020: R+9.6 2016: R+8.7 2012: D+2.5 2008: D+7.7
Not yet ingested
- Civics
- —
Market trends
- HPI YoY
- ▼ -85.17%
- Current HPI
- 201.0508
- Rent YoY
- ▲ 33.16%
- Metro
- Albuquerque, NM
- State GDP YoY
- —
- F500 in state
- 0
Price history
3 events — show timeline
- 2026-05-18 Listed $269,900 Southwest MLS
- 2014-11-06 Sold (Public Records) — Public Records
- 2008-06-26 Sold (Public Records) — Public Records
Property tax history
+3.1%/yrLatest (2025): $1,600 · +27.3% YoY. Source: county tax records.
Cash-flow waterfall
monthlySold comps — $/sqft
last 12 mo · ≤1 miLoading sold comps…