521 Bay Creek Xing · Loganville, GA
Flood risk 6/10 · Moderate
- FEMA flood zone
- A
- Chance of flooding over 30 yrs
- 0.73%
- Est. flood insurance / yr
- $1,009 – $1,996
Fire risk 3/10 · Minor
- Est. fire insurance / yr
- $963 – $1,789
Heat risk 5/10 · Moderate
- Hot days now (above 104°F)
- 7 days/yr
- Hot days in 30 yrs
- 17 days/yr
Wind risk 5/10 · Moderate
- Chance of severe wind over 30 yrs
- 23.0%
Air-quality risk 4/10 · Minor
- Unhealthy air days now
- 5 days/yr
- Unhealthy air days in 30 yrs
- 7 days/yr
Risk factors via First Street. Map © Google.
Why this score? — see what drove the B grade
The composite is a weighted blend of 9 inputs, each scored 0–100. Each bar is that input's sub-score; the figure is the points it added to the 100-point composite (weight × sub-score).
- Cash flow +30.0/30.0
- 1% rule +10.0/10.0
- DSCR +10.0/10.0
- ARV discount +7.5/15.0
- Schools +3.7/10.0
- Livability +3.7/5.0
- Rent growth +3.3/5.0
- Condition / age +2.8/5.0
- Appreciation +0.0/10.0
$65,000
🖨 Deal sheet 📄 Offer letter ✓ Due diligence
Listing remarks MLS
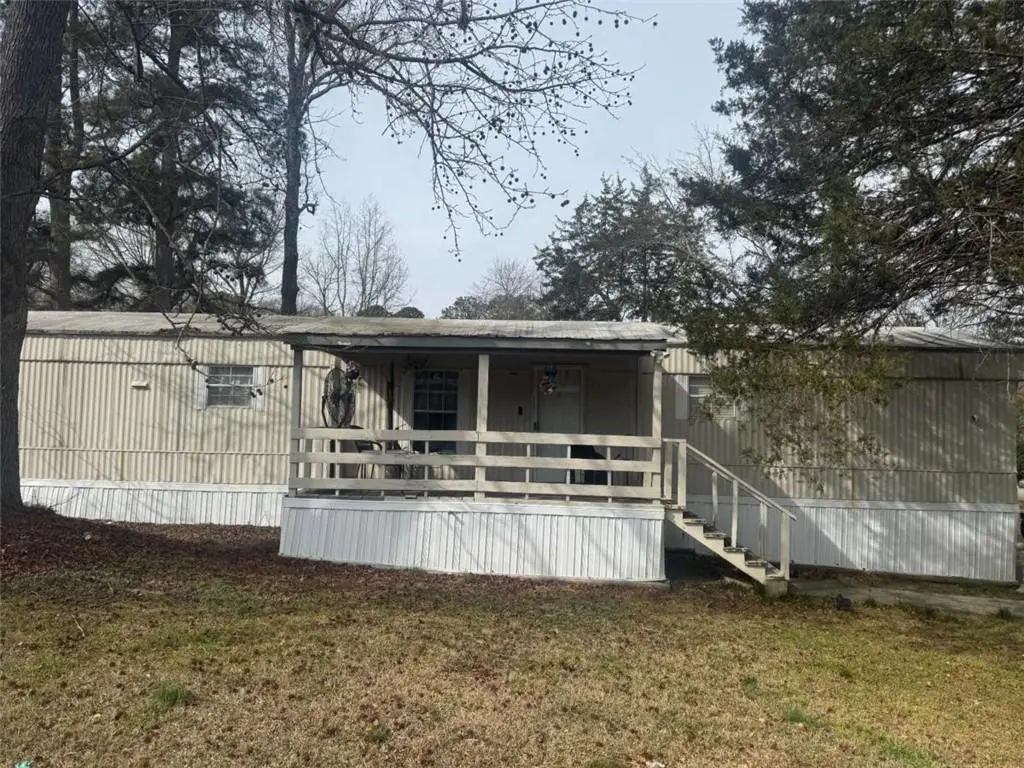
Welcome to a well maintain 3 bedrooms with two full baths manufactured home located in Loganville, GA The Master bedroom includes a nice size walk in closet and built in cabinetry in the bathroom. This property is located on leased land for a monthly payment of $705.
Key facts
- Built 1995
- Listed 81 days
Neighborhood map
What this means for you Summary
Snapshot
- This is a 3-bed/2.0-bath single-family listed at $65k. Condition is rated average.
Deal economics
- At list price, monthly cash flow is $1k ($13k/yr) — positive.
- The deal already cash-flows at list — no discount required.
- Meets the 1% rule at list price ($2k rent vs $65k).
- Recommended offer: $61k (6.0% below list) — sets the bar for market timing.
- Cap rate 28.4% vs local median 4.0% in Loganville — top-decile yield for the area; either an underpriced asset or a hidden risk that comps aren't pricing in. Stress-test before assuming the spread holds.
Location & tenants
- Location reads 74/100 on livability (#39 in GA, #4,689 nationally) — a middle-class / working-renter tenant base. Strengths: crime A+, housing A+, cost of living A-; Watch: amenities F, commute F.
- Walton County (rural): math 43% / reading 41% proficiency, ranked #31 of 174 in GA (top 18%) — families likely to look elsewhere, expect single-tenant / working-renter base with shorter leases.
- Market conditions: Rents rising (+3.1%/yr); 847 active listings in the ZIP; 12 comparable units currently listed for rent nearby; rentals at typical pace (median 24d on market — plan ~3-4 weeks tenant-placement turnaround); solid renter incomes; 677 units permitted in Walton County in 2024 (17 in 5+ unit buildings).
Forward outlook
- Local home prices are declining (-3.0%/yr); year-one equity from $449 of loan paydown is wiped out by about $2k of value loss. Plan a longer hold.
- Walton County population projected at +18% by 2050 — long-run rental-demand tailwind backs the buy-and-hold thesis.
- At projected returns (-3.0% appreciation + 3.1% rent growth), your $18k cash investment doubles in ~2 years — after that, you're playing with house money.
Negotiation context
- It's been on market 81 days — a 6% lower offer ($61k) is reasonable based on typical stale-listing flexibility.
Risks & watch-outs
- Watch-outs: flood insurance adds $125/mo.
- Climate carrying-cost: in FEMA flood zone A (mandatory federal flood insurance); moderate wind risk, 23% chance of damaging wind over 30y; extreme-heat days projected 7→17/yr by 2055 (HVAC capex compounding) — expect insurance premiums to compound above CPI over the hold.
Questions for the listing agent
- It's been on market 81 days. Have you received any prior offers? Is the seller open to a 6% concession, seller financing, or rate buy-down credit?
- What's the actual annual flood-insurance premium (NFIP or private), and is the property in a SFHA with mandatory coverage?
- Why hasn't it sold? Are there any deal-killer items the seller is aware of (foundation, flood, title, zoning, code violations)?
- Is there a deadline driving the sale (1031 exchange, divorce, estate, relocation)? That informs how much negotiation room exists.
- What's the average days-on-market for RENTAL listings here right now (not sales)? A rising rental-DOM trend means longer vacancies and softer asking-rent achievability than the comps imply.
- What's the recent tenant-quality profile in this submarket — average credit score on applications, eviction rate, late-payment / NSF rate, and stable-employment percentage? A property-management company in the area should have these aggregated.
- How much new for-sale + rental construction is in the pipeline within 1–3 miles? Heavy new supply typically softens prices + rents 12–24 months out; constrained supply supports both.
Investment metrics
- 1% rule
- 3.20% ✓
- Cap rate
- 28.36%
- Cash-on-cash
- 78.83%
- DSCR
- 4.51
- GRM
- 2.6
CMA / ARV
- ARV (median comp)
- $287,678
- List price
- $65,000
- Delta
- -77.41%
- Verdict
- UNDERPRICED
- Comps
- 20 within 1.0 mi
Show comp detail 12 sales within ~0.75 mi
| Address | Dist | Beds/Ba | Sqft | Sold | Price | $/sf | Match |
|---|---|---|---|---|---|---|---|
| 740 Jacoby Dr | 0.36mi | 3/2.0 | 1,348 (+5%) | 0mo | $305,000 | $226 | 74 |
| 417 Mockingbird Dr | 0.25mi | 2/2.0 (-1) | 1,335 (+4%) | 5mo | $286,000 | $214 | 72 |
| 1168 Granite Ln | 0.15mi | 3/2.0 | 1,410 (+10%) | 5mo | $290,000 | $206 | 72 |
| 311 Bay Creek Rd | 0.26mi | 3/2.0 | 1,360 (+6%) | 8mo | $288,000 | $212 | 71 |
| 1197 Granite Ln | 0.18mi | 3/2.0 | 1,446 (+13%) | 8mo | $240,000 | $166 | 64 |
| 721 Jacoby Dr | 0.43mi | 3/2.0 | 1,354 (+6%) | 9mo | $287,000 | $212 | 63 |
| 533 Pebble Point Dr | 0.38mi | 3/2.0 | 1,241 (-3%) | 18mo | $314,900 | $254 | 63 |
| 729 Jacoby Dr | 0.38mi | 3/2.0 | 1,357 (+6%) | 18mo | $302,900 | $223 | 57 |
| 629 Granite Ln | 0.45mi | 3/2.0 | 1,362 (+6%) | 15mo | $285,000 | $209 | 56 |
| 709 Jacoby Dr | 0.45mi | 2/2.0 (-1) | 1,448 (+13%) | 14mo | $290,000 | $200 | 40 |
| 723 Jacoby Dr | 0.42mi | 2/2.0 (-1) | 1,468 (+15%) | 16mo | $303,000 | $206 | 38 |
| 758 Jacoby Dr | 0.36mi | 2/2.0 (-1) | 1,456 (+14%) | 23mo | $289,000 | $198 | 36 |
Match score weights: distance 35% · size 25% · config 20% · recency 20%. Top-matched comps best support the ARV.
Projected returns pro-forma
-3.0% appreciation · 3.12% rent growth · sell at horizon
- IRR
- 70.3%
- Equity multiple
- 4.19×
- Total profit
- $57,998
- Equity at exit
- $9,692
- IRR
- 74.4%
- Equity multiple
- 8.68×
- Total profit
- $139,759
- Equity at exit
- $5,620
Cash invested: $18,200 (down + closing). Projections, not guarantees.
Landlord ↔ Tenant lean methodology
- Overall (STATE)
- 90 Strongly Landlord-Friendly
- State Georgia
- 90 Strongly Landlord-Friendly · R+3
- County
- — inherits STATE
- City
- — inherits STATE
ZIP-level market 30052
- Home prices YoY
- -31.8%
- Rents YoY
- 3.1%
- Active inventory
- 847
- Price-to-rent
- 2.6×
Monthly cashflow live
- Estimated rent
- $2,082 high interval (Pro) →
- Mortgage (P&I)
- −$341
- Tax est. 1.5%
- −$81 /mo · $975/yr
- Insurance
- −$27
- Flood insurance flood zone
- −$125 /mo · $1,502/yr
- HOA
- −$0
- Vacancy / Maint / Mgmt
- −$437
- Net cashflow
- $1,070
Break-even live
UW: 25.0% down · 7.5% · 30yr · 1.5% tax · 5.0% vac · 8.0% maint · 8.0% mgmt
Financing live
Cash to close
- Down payment
- $16,250
- Closing costs
- $1,950
- Reserves months
- —
- Total cash needed
- —
Loan-product check · same deal, 3 products live
Conventional
25% down · 7.5% · 30yr
- Down + closing
- —
- Monthly P&I
- —
- Monthly cashflow
- —
- DSCR
- —
- Eligible?
- —
Personal DTI + credit; lowest rate.
DSCR
20% down · 8.5% · 30yr
- Down + closing
- —
- Monthly P&I
- —
- Monthly cashflow
- —
- DSCR
- —
- Eligible?
- —
No personal income docs; deal must DSCR.
Hard money
10% down · 12.0% · 12mo
- Down + closing
- —
- Monthly P&I
- —
- Monthly cashflow
- —
- DSCR
- —
- Eligible?
- —
Short-term bridge; refi at stabilization.
Rent comps 12 comps
| Address | Beds | Baths | Sqft | Rent | $/sqft | DOM | Units | Dist |
|---|---|---|---|---|---|---|---|---|
| 475 Bay Creek Rd Loganville, GA | 3.0 | 1.0 | 1032 | $1,450 | $1.41 | 24d | 1 | 0.07mi |
| 1169 Granite Ln Loganville, GA | 3.0 | 2.0 | 1430 | $2,025 | $1.42 | 2d | 1 | 0.09mi |
| 313 Bruce St Loganville, GA | 3.0 | 1.0 | 1075 | $1,673 | $1.56 | 24d | 1 | 0.27mi |
| 249 Meadows Dr Loganville, GA | 1.0–3.0 | 1.0–2.0 | 1074 | $1,895 | $1.76 | 43d | 1 | 0.33mi |
| 413 Bob Wood Dr Loganville, GA | 3.0 | 2.0 | 1346 | $2,123 | $1.58 | 24d | 1 | 0.53mi |
| 127 Perry St Loganville, GA | 4.0 | 3.0 | 1616 | $2,450 | $1.52 | 22d | 1 | 0.54mi |
| 160 Cown Dr Loganville, GA | 3.0 | 2.0 | 1404 | $1,650 | $1.18 | 24d | 1 | 0.70mi |
| 112 Chase Landing Dr Unit Gentry Loganville, GA | 3.0 | 2.5 | 1830 | $2,797 | $1.53 | 2d | 1 | 1.05mi |
| 100 Alexander Xing Loganville, GA | 2.0–3.0 | 2.0–2.5 | 1381 | $1,895 | $1.37 | 2d | 20 | 1.12mi |
| 301 Victory Gallup Ln Loganville, GA | 3.0–4.0 | 2.5 | 2082 | $2,420 | $1.16 | 1d | 1 | 1.14mi |
| 2217 Baker Carter Dr Loganville, GA | 3.0 | 2.5 | 1620 | $1,870 | $1.15 | 43d | 1 | 1.14mi |
| 9200 Liberty Ln Loganville, GA | 2.0–3.0 | 2.0–3.0 | 1243 | $2,359 | $1.90 | 1d | 16 | 1.47mi |
Listing history 15 events
-
2026-06-18days on market $65,000 Active 81 DOM
-
2026-06-17days on market $65,000 Active 80 DOM
-
2026-06-16days on market $65,000 Active 79 DOM
-
2026-06-15days on market $65,000 Active 78 DOM
-
2026-06-13days on market $65,000 Active 76 DOM
-
2026-06-13days on market $65,000 Active 75 DOM
-
2026-06-09days on market $65,000 Active 72 DOM
-
2026-06-08days on market $65,000 Active 71 DOM
-
2026-06-07days on market $65,000 Active 70 DOM
-
2026-06-04days on market $65,000 Active 67 DOM
-
2026-06-03days on market $65,000 Active 66 DOM
-
2026-06-02days on market $65,000 Active 65 DOM
-
2026-06-01days on market $65,000 Active 64 DOM
-
2026-05-31days on market $65,000 Active 63 DOM
-
2026-03-29$65,000 Active 267-char remark
Show marketing remark (267 chars)
Welcome to a well maintain 3 bedrooms with two full baths manufactured home located in Loganville, GA The Master bedroom includes a nice size walk in closet and built in cabinetry in the bathroom. This property is located on leased land for a monthly payment of $705.
ⓘ Source: listings_history table (triggers on properties + properties_extension) + one-shot
backfill from property_details.listing_events for pre-trigger history.
Climate risk First Street
- Flood 6/10 Major FEMA zone A · 73% chance over 30 yrs
- Wildfire 3/10 Moderate
- Heat 5/10 Major 7 d/yr ≥104°F today · 17 d/yr by 30 yrs out
- Wind 5/10 Major 23% chance of damaging wind over 30 yrs
- Air quality 4/10 Moderate 5 unhealthy d/yr today · 7 by 30 yrs out
Nearby sold comps map
Loading sold comps map…
Walkable amenities ~0.75 mi
Loading nearby amenities…
Taxation est. · year 1
- Rental income
- $24,984
- − Mortgage interest
- −$3,641
- − Property taxes
- −$975
- − Insurance
- −$1,828
- − Repairs & maintenance
- −$1,999
- − Management
- −$1,999
- − Depreciation
- −$1,891
- Taxable income
- $12,652
- Est. tax owed @ 24.0%
- −$3,036
- After-tax cash flow
- $9,808/yr
For passive investors: Depreciation is non-cash, so a rental often shows a tax loss while cash-flowing — sheltering income. Rental losses are passive: they offset passive income freely, and up to $25,000/yr can offset ordinary (W-2) income if you actively participate and your MAGI is under $100k (phasing out to $0 by $150k); unused losses carry forward. On sale, claimed depreciation is recaptured at up to 25%, and gains may owe capital-gains tax (a 1031 exchange can defer both). Figures are a year-1 estimate at your 24.0% rate — not tax advice; consult a CPA.
Condition & rehab AI · 10 photos
This manufactured home requires cosmetic repairs to its exterior and roof, but the interior is in good condition. Painting the exterior and replacing HVAC filters would significantly increase its value.
Repairs flagged
- Major exterior siding — Significant wear and tear
- Major roof — Visible signs of deterioration
Value-add opportunities
- Both Paint exterior siding — Enhances curb appeal and value
- Rental Replace HVAC filters — Improves air quality and tenant satisfaction
Renovation cost estimate screening
| Repair item | Severity | Est. cost |
|---|---|---|
| exterior siding · Significant wear and tear | Major | $15,000–50,000 |
| roof · Visible signs of deterioration | Major | $15,000–50,000 |
| Total estimated repair cost · 2 items | $30,000–100,000 |
Value-add ROI direction
- Both Paint exterior siding — Enhances curb appeal and value ↑
- Rental Replace HVAC filters — Improves air quality and tenant satisfaction ↑
ⓘ Cost ranges are severity-bucket heuristics (US national rule-of-thumb). Get contractor quotes + a written scope before underwriting a rehab budget.
Schools (NCES district)
- District
- Walton County
- NCES district ID
- 1305390
- Math proficiency
- 43% ▼ -10.00%
- Reading proficiency
- 41% ▼ -10.00%
- Median HH income
- $53,716
- Composite
- 36.52/100
- National rank
- #4643
- State rank
- #31 of 174 in GA
Livability — Loganville
- Score
- 74/100
- State rank
- #39
- US rank
- #4689
Category grades
Schools grade is shown separately in the Schools card above.
Census & demographics
- Census place
- Loganville, GA
- County
- Walton County · 128,246 people
- City population
- 79,811
- Metro
- Atlanta-Sandy Springs-Alpharetta, GA
- Population (ZIP)
- 79,811
- Household income
- $93,764
- Rent vs Own
- Severe rent burden
- 1174.0
Population outlook (Walton County) Hauer SSP2
- Today (2025)
- 98,098 people
- By 2030
- 102,496 · +4.5%
- By 2040
- 110,318 · +12.5%
- By 2050
- 115,848 · +18.1%
- By 2075
- 125,830 · +28.3%
- By 2100
- 123,852 · +26.3%
Race, ethnicity, and origin ACS 2023
- Neighborhood character
- Diverse neighborhood (Simpson 0.64)
- Race & ethnicity
- White 48% Black 33% Hispanic / Latino 13% Two or more races 7% Asian 2%
- Hispanic origin (detail)
- Mexican 7% Puerto Rican 3% Cuban 1%
- Common ancestry
- Slovak 2% Lithuanian 2% Romanian 1%
- Foreign-born
- 13% · Canada, Jamaica, Vietnam
- Languages at home
- 84% English-only · Spanish 10% French/Haitian/Cajun 1% Other Indo-European 1%
Political lean MEDSL · Walton
- 2024 margin
- Solid R (+45.9) · D 26.7% · R 72.6%
- 2008→2024 swing
- +6.2pp toward D · 2008: -52.1pp · 2024: -45.9pp
- All cycles
- 2024: R+45.9 2020: R+49.2 2016: R+56.4 2012: R+55.6 2008: R+52.1
Not yet ingested
- Civics
- —
Market trends
- HPI YoY
- ▼ -98.77%
- Current HPI
- 212.1241
- Rent YoY
- ▲ 3.12%
- Metro
- Atlanta-Sandy Springs-Alpharetta, GA
- State GDP YoY
- ▲ 2.66%
- F500 in state
- 28
Industry mix (Fortune 500 HQ in GA)
| Industry | F500 HQs | Revenue |
|---|---|---|
| Paper / Packaging | 2 | $29B |
|
||
| Retail | 1 | $160B |
|
||
| Transportation / Logistics | 1 | $91B |
|
||
| Airlines | 1 | $62B |
|
||
| Consumer Goods | 1 | $47B |
|
||
| Utilities | 1 | $25B |
|
||
Price history
1 event — show timeline
- 2026-03-29 Listed $65,000 FMLS
Cash-flow waterfall
monthlySold comps — $/sqft
last 12 mo · ≤1 miLoading sold comps…