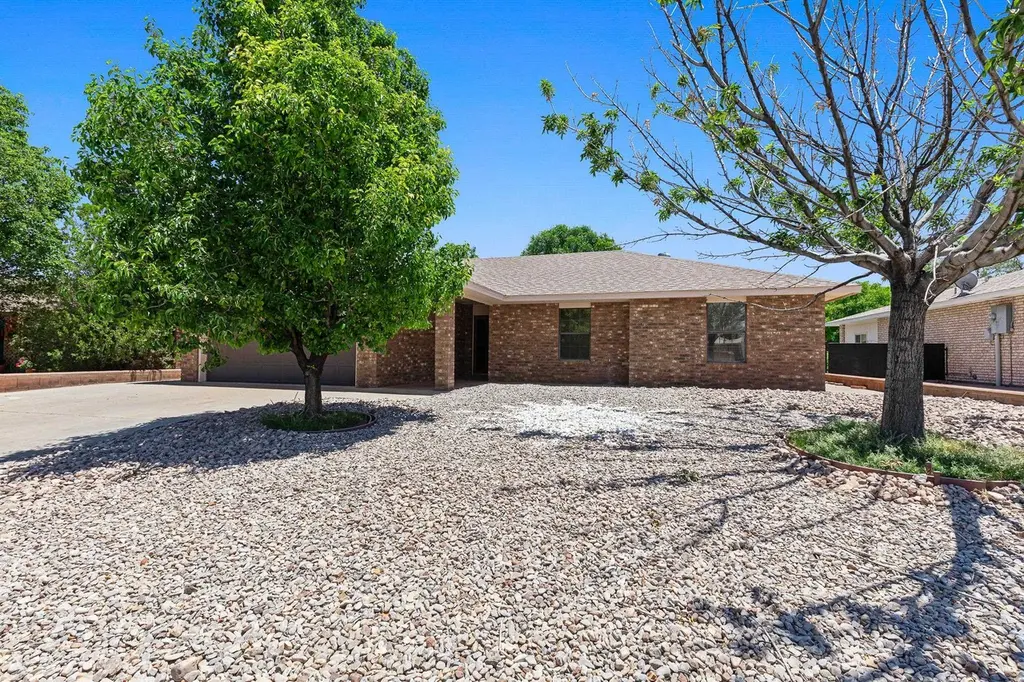
836 San Juan Dr · Alamogordo, NM
Flood risk 1/10 · Minimal
- FEMA flood zone
- X (unshaded)
- Chance of flooding over 30 yrs
- 0.0%
- Est. flood insurance / yr
- $507 – $1,088
Fire risk 4/10 · Minor
- Est. fire insurance / yr
- $706 – $1,312
Heat risk 5/10 · Moderate
- Hot days now (above 96°F)
- 7 days/yr
- Hot days in 30 yrs
- 24 days/yr
Wind risk 1/10 · Minimal
- Chance of severe wind over 30 yrs
- —
Air-quality risk 1/10 · Minimal
- Unhealthy air days now
- 0 days/yr
- Unhealthy air days in 30 yrs
- 0 days/yr
Risk factors via First Street. Map © Google.
Why this score? — see what drove the D grade
The composite is a weighted blend of 9 inputs, each scored 0–100. Each bar is that input's sub-score; the figure is the points it added to the 100-point composite (weight × sub-score).
- Cash flow +14.4/30.0
- ARV discount +7.5/15.0
- DSCR +4.4/10.0
- Livability +3.9/5.0
- 1% rule +3.2/10.0
- Schools +3.0/10.0
- Rent growth +2.9/5.0
- Condition / age +2.5/5.0
- Appreciation +0.0/10.0
$260,000
🖨 Deal sheet (PDF) 📄 Offer letter ✓ Due diligence
Listing remarks MLS
This beautiful 3 bedroom, 2-bathroom gem is ready to be called home. The lush front yard with shade trees welcomes you into the extended covered porch, which is a great place to sit and enjoy desert evenings. Several upgrades have been done to the interior to include flooring, light fixtures, ceiling fans, and paint. Complete with refrigerated air, a 2-car garage, ample storage space, and a large walk-in closet in the primary bedroom, you have plenty of options for those extra items. You will love the large backyard, complete with a storage shed and a nicely sized covered patio for enjoyment and entertaining. Shown by appointment only, call to schedule a time to view today!
Key facts
- Covered porch
- Large rooms
- Ample cabinet space
Tags
Property features AI
Exterior
- Parking: Attached garage
- Utilities: Public water; Public sewer
- Home design: Single family residence; Residential property; One story
- Construction: Brick veneer construction; Shingle roof; Slab foundation; Site-built home; Built in 2026
- Exterior features: Covered patio/porch; Private pool; Shed(s)
Interior
- Kitchen: Dishwasher; Disposal; Microwave; Oven; Refrigerator
- Flooring: Carpet; Tile
- Heating & cooling: Forced air heating; Central air; Ceiling fan(s)
- Interior features: Eat-in kitchen; Walk-in closet(s); Window coverings
Neighborhood map
What this means for you Summary
Snapshot
- This is a 3-bed/2.0-bath single-family listed at $260k.
Deal economics
- At list price, monthly cash flow is $52 ($619/yr) — positive.
- The deal already cash-flows at list — no discount required.
- To meet the 1% rule (rent ≥ 1% of price), the offer needs to be $213k (17.9% below list).
- Recommended offer: $213k (17.9% below list) — sets the bar for 1% rule.
Location & tenants
- Location reads 77/100 on livability (#5 in NM, #3,233 nationally) — a middle-class / working-renter tenant base. Strengths: commute A+, cost of living A+, housing A+; Watch: crime D, employment D, schools F.
- Alamogordo Public Schools (town): math 26% / reading 39% proficiency, ranked #26 of 95 in NM (top 27%) — families likely to look elsewhere, expect single-tenant / working-renter base with shorter leases.
- Market conditions: Rents rising (+1.6%/yr); 449 active listings in the ZIP; 5 comparable units currently listed for rent nearby; rentals at typical pace (median 16d on market — plan ~3-4 weeks tenant-placement turnaround); 40% of comp listings sitting > 30 days — soft ceiling on asking rent; 6 units permitted in Otero County in 2024 (0 in 5+ unit buildings).
- This rent runs 45% of the median local income ($57k/yr) — at the standard rent-burdened threshold; future hikes will face affordability resistance.
Forward outlook
- Local home prices are declining (-3.0%/yr); year-one equity from $2k of loan paydown is wiped out by about $8k of value loss. Plan a longer hold.
- Otero County population projected to shrink 7% by 2050 — rents likely to lag national; underwrite the cash flow, not the appreciation.
Negotiation context
- Only 7 days on market — expect competitive offers; lowballing is unlikely to land.
- 4 sale attempts since 14y ago with the ask held roughly flat each time — persistent listings suggest the price (not the market) is what's stuck; bring a comps-based counter.
Risks & watch-outs
- Climate carrying-cost: extreme-heat days projected 7→24/yr by 2055 (HVAC capex compounding) — expect insurance premiums to compound above CPI over the hold.
Questions for the listing agent
- Is there a deadline driving the sale (1031 exchange, divorce, estate, relocation)? That informs how much negotiation room exists.
- Schools are F-rated, which usually means shorter tenancies and higher turnover. Who's the typical renter profile here, and what's been the actual vacancy rate?
- Crime grade is D in this area — have there been break-ins, vandalism, or insurance claims at this property in the last 3 years? What carrier currently insures it and at what premium?
- The area grade is low — what's the realistic commute time and amenity access for the typical tenant pool here? Any planned neighborhood developments (good or bad) we should know about?
- What's the average days-on-market for RENTAL listings here right now (not sales)? A rising rental-DOM trend means longer vacancies and softer asking-rent achievability than the comps imply.
- What's the recent tenant-quality profile in this submarket — average credit score on applications, eviction rate, late-payment / NSF rate, and stable-employment percentage? A property-management company in the area should have these aggregated.
- How much new for-sale + rental construction is in the pipeline within 1–3 miles? Heavy new supply typically softens prices + rents 12–24 months out; constrained supply supports both.
Investment metrics
- 1% rule
- 0.82% ✗
- Cap rate
- 6.53%
- Cash-on-cash
- 0.85%
- DSCR
- 1.04
- GRM
- 10.2
CMA / ARV
No comps found within radius.
Projected returns pro-forma
-3.0% appreciation · 1.65% rent growth · sell at horizon
- IRR
- -16.4%
- Equity multiple
- 0.43×
- Total profit
- $-41,772
- Equity at exit
- $38,767
- IRR
- -10.5%
- Equity multiple
- 0.40×
- Total profit
- $-43,841
- Equity at exit
- $22,480
Cash invested: $72,800 (down + closing). Projections, not guarantees.
Landlord ↔ Tenant lean methodology
- Overall (STATE)
- 55 Moderately Landlord-Leaning
- State New Mexico
- 55 Moderately Landlord-Leaning · D+3
- County
- — inherits STATE
- City
- — inherits STATE
ZIP-level market 88310
- Rents YoY
- 1.6%
- Active inventory
- 449
- Price-to-rent
- 10.2×
Monthly cashflow live
- Estimated rent
- $2,135 high interval (Pro) →
- Mortgage (P&I)
- −$1,363
- Tax from tax record
- −$163 /mo · $1,954/yr
- Insurance
- −$108
- HOA
- −$0
- Vacancy / Maint / Mgmt
- −$448
- Net cashflow
- $52
Break-even live
Sensitivity live
| Price | -10% $199 | -5% $125 | +0% $52 | +5% $-22 | +10% $-96 |
|---|---|---|---|---|---|
| Rent | -10% $-117 | -5% $-33 | +0% $52 | +5% $136 | +10% $220 |
| Rate | -1.0pp $183 | -0.5pp $118 | base $52 | +0.5pp $-16 | +1.0pp $-84 |
UW: 25.0% down · 7.5% · 30yr · 1.5% tax · 5.0% vac · 8.0% maint · 8.0% mgmt
Financing live
Cash to close
- Down payment
- $65,000
- Closing costs
- $7,800
- Reserves months
- —
- Total cash needed
- —
Loan-product check · same deal, 3 products live
Conventional
25% down · 7.5% · 30yr
- Down + closing
- —
- Monthly P&I
- —
- Monthly cashflow
- —
- DSCR
- —
- Eligible?
- —
Personal DTI + credit; lowest rate.
DSCR
20% down · 8.5% · 30yr
- Down + closing
- —
- Monthly P&I
- —
- Monthly cashflow
- —
- DSCR
- —
- Eligible?
- —
No personal income docs; deal must DSCR.
Hard money
10% down · 12.0% · 12mo
- Down + closing
- —
- Monthly P&I
- —
- Monthly cashflow
- —
- DSCR
- —
- Eligible?
- —
Short-term bridge; refi at stabilization.
Rent comps 5 comps
| Address | Beds | Baths | Sqft | Rent | $/sqft | DOM | Units | Dist |
|---|---|---|---|---|---|---|---|---|
| 1104 San Miguel Alamogordo, NM | 3.0 | 2.0 | 1749 | $2,500 | $1.43 | 5d | 1 | 0.14mi |
| 2200 1st St Alamogordo, NM | 1.0–3.0 | 1.0–3.0 | 1011 | $1,979 | $1.96 | 5d | 18 | 0.91mi |
| 1309 Jackson Ave Alamogordo, NM | 4.0 | 2.0 | 1467 | $1,500 | $1.02 | 45d | 1 | 1.00mi |
| 323 Camino Real Alamogordo, NM | 3.0 | 2.5 | 1848 | $2,000 | $1.08 | 16d | 1 | 1.41mi |
| 2637 Las Alturas Ct Alamogordo, NM | 3.0 | 2.0 | 1366 | $1,600 | $1.17 | 45d | 1 | 1.45mi |
Listing history 7 events
-
2026-06-13status $260,000 Pending 7 DOM
-
2026-06-10days on market $260,000 Active 7 DOM
-
2026-06-09days on market $260,000 Active 6 DOM
-
2026-06-08days on market $260,000 Active 5 DOM
-
2026-06-07days on market $260,000 Active 4 DOM
-
2026-06-05remarks 699-char remark
-
2026-06-05$260,000 Active 1 DOM
ⓘ Source: listings_history table (triggers on properties + properties_extension) + one-shot
backfill from property_details.listing_events for pre-trigger history.
Tax reassessment forecast NM · Resets to sale price
- Current annual tax
- $1,954 · $163/mo
- Projected year-2 tax
- $2,080 · $173/mo
- Expected delta
- +$126/yr (+$10/mo · 6.4%)
ⓘ Screening estimate from a state-policy table — verify with the county assessor before closing.
Climate risk First Street
- Flood 1/10 Low FEMA zone X (unshaded) · 0% chance over 30 yrs
- Wildfire 4/10 Moderate
- Heat 5/10 Major 7 d/yr ≥96°F today · 24 d/yr by 30 yrs out
- Wind 1/10 Low
- Air quality 1/10 Low 0 unhealthy d/yr today · 0 by 30 yrs out
Nearby sold comps map
Loading sold comps map…
Walkable amenities ~0.75 mi
Loading nearby amenities…
Taxation est. · year 1
- Rental income
- $25,614
- − Mortgage interest
- −$14,564
- − Property taxes
- −$1,954
- − Insurance
- −$1,300
- − Repairs & maintenance
- −$2,049
- − Management
- −$2,049
- − Depreciation
- −$7,564
- Taxable loss
- −$3,866
- Est. tax savings @ 24.0%
- +$928
- After-tax cash flow
- $1,547/yr
For passive investors: Depreciation is non-cash, so a rental often shows a tax loss while cash-flowing — sheltering income. Rental losses are passive: they offset passive income freely, and up to $25,000/yr can offset ordinary (W-2) income if you actively participate and your MAGI is under $100k (phasing out to $0 by $150k); unused losses carry forward. On sale, claimed depreciation is recaptured at up to 25%, and gains may owe capital-gains tax (a 1031 exchange can defer both). Figures are a year-1 estimate at your 24.0% rate — not tax advice; consult a CPA.
Schools (NCES district)
- District
- Alamogordo Public Schools
- NCES district ID
- 3500030
- Math proficiency
- 26% —
- Reading proficiency
- 39% —
- Median HH income
- $42,194
- Composite
- 30.24/100
- National rank
- #11572
- State rank
- #26 of 95 in NM
Livability — Alamogordo
- Score
- 77/100
- State rank
- #5
- US rank
- #3233
Category grades
Schools grade is shown separately in the Schools card above.
Census & demographics
- Census place
- Alamogordo, NM
- County
- Otero County · 36,983 people
- City population
- 36,983
- Metro
- Alamogordo, NM
- Population (ZIP)
- 36,983
- Household income
- $57,214
- Rent vs Own
- Severe rent burden
- 1231.0
Population outlook (Otero County) Hauer SSP2
- Today (2025)
- 62,967 people
- By 2030
- 62,164 · -1.3%
- By 2040
- 60,253 · -4.3%
- By 2050
- 58,575 · -7.0%
- By 2075
- 55,411 · -12.0%
- By 2100
- 48,551 · -22.9%
Race, ethnicity, and origin ACS 2023
- Neighborhood character
- Diverse neighborhood (Simpson 0.59)
- Race & ethnicity
- White 56% Hispanic / Latino 31% Two or more races 18% Black 5% Asian 2% Native American 2%
- Hispanic origin (detail)
- Mexican 25%
- Common ancestry
- Slovak 3% Lithuanian 2% Italian 1%
- Foreign-born
- 6% · Canada
- Languages at home
- 85% English-only · Spanish 12% Tagalog/Filipino 1%
Political lean MEDSL · Otero
- 2024 margin
- Strong R (+27.0) · D 35.4% · R 62.4% · Other 2.2%
- 2008→2024 swing
- -7.7pp toward R · 2008: -19.3pp · 2024: -27.0pp
- All cycles
- 2024: R+27.0 2020: R+25.6 2016: R+29.1 2012: R+28.0 2008: R+19.3
Not yet ingested
- Civics
- —
Market trends
- HPI YoY
- ▼ -174.88%
- Current HPI
- 181.737
- Rent YoY
- ▲ 1.65%
- Metro
- Alamogordo, NM
- State GDP YoY
- —
- F500 in state
- 0
Price history
+73.9% since first listed12 events — show timeline
- 2026-06-03 Listed $260,000 OCAOR
- 2023-04-26 Sold (Public Records) — Public Records
- 2023-04-26 Sold (MLS) — OCAOR
- 2023-03-17 Pending — OCAOR
- 2023-03-15 Listed $240,000 OCAOR
- 2019-03-29 Sold (Public Records) — Public Records
- 2019-03-29 Sold (MLS) — OCAOR
- 2018-10-19 Listed $159,900 OCAOR
- 2012-06-28 Sold (Public Records) — Public Records
- 2012-06-28 Sold (MLS) — OCAOR
- 2012-05-01 Listed $149,500 OCAOR
- 2008-02-29 Sold (Public Records) — Public Records
Property tax history
+4.4%/yrLatest (2025): $1,954 · +2.3% YoY. Source: county tax records.
Cash-flow waterfall
monthlySold comps — $/sqft
last 12 mo · ≤1 miLoading sold comps…