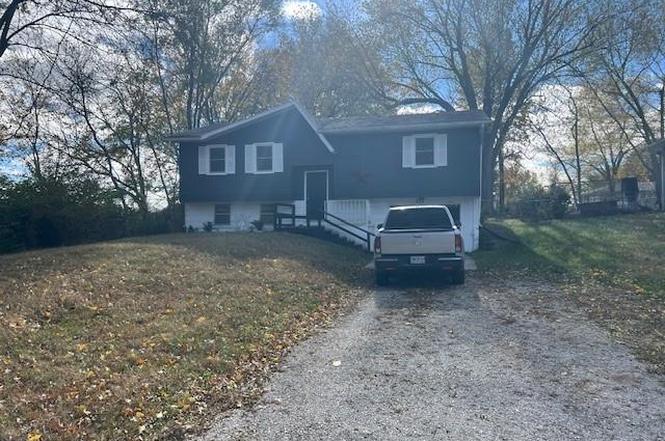
234 E Moss St · Lawson, MO
Flood risk 1/10 · Minimal
- FEMA flood zone
- X (unshaded)
- Chance of flooding over 30 yrs
- 0.0%
- Est. flood insurance / yr
- $473 – $860
Fire risk 3/10 · Minor
- Est. fire insurance / yr
- $1,054 – $1,958
Heat risk 4/10 · Minor
- Hot days now (above 106°F)
- 7 days/yr
- Hot days in 30 yrs
- 16 days/yr
Wind risk 2/10 · Minimal
- Chance of severe wind over 30 yrs
- —
Air-quality risk 3/10 · Minor
- Unhealthy air days now
- 4 days/yr
- Unhealthy air days in 30 yrs
- 4 days/yr
Risk factors via First Street. Map © Google.
Why this score? — see what drove the C+ grade
The composite is a weighted blend of 9 inputs, each scored 0–100. Each bar is that input's sub-score; the figure is the points it added to the 100-point composite (weight × sub-score).
- Cash flow +26.8/30.0
- DSCR +9.2/10.0
- 1% rule +8.5/10.0
- ARV discount +7.5/15.0
- Schools +4.5/10.0
- Livability +3.4/5.0
- Rent growth +2.5/5.0
- Condition / age +2.5/5.0
- Appreciation +0.0/10.0
$100,000
🖨 Deal sheet (PDF) 📄 Offer letter ✓ Due diligence
Listing remarks MLS
Welcome to this charming three-bedroom home nestled on a tranquil dead-end street. As you enter the home you are greeted by a cozy, renovated living space with tons of natural lighting with new floor covering throughout. The adjacent kitchen features ample cabinet space and a breakfast nook perfect for enjoying your morning coffee, the basement features a cozy family room, full bath and laundry and a one car garage.
Key facts
- Large lot
- 0.32 acre lot
- Garage
Tags
Neighborhood map
What this means for you Summary
Snapshot
- This is a 3-bed/1.5-bath single-family listed at $100k.
Deal economics
- At list price, monthly cash flow is $275 ($3k/yr) — positive.
- The deal already cash-flows at list — no discount required.
- Meets the 1% rule at list price ($1k rent vs $100k).
- Recommended offer: $91k (9.0% below list) — sets the bar for market timing.
Location & tenants
- Location reads 67/100 on livability (#197 in MO) — a middle-class / working-renter tenant base. Strengths: crime A+, cost of living A+, housing A+; Watch: amenities F, commute F, health & safety F.
- Lawson R-Xiv (rural): math 46% / reading 55% proficiency, ranked #28 of 324 in MO (top 9%) — acceptable for families but not a draw, mixed tenant base, ~2y average lease.
- Zoned schools: Lawson High (math 42% / reading 62%, grade D+, #92 of 521 statewide, top 20%, 338 students, 23% FRL) — zoned schools at 23% FRL track the district average.
- Market conditions: 63 active listings in the ZIP; 56 units permitted in Ray County in 2024 (0 in 5+ unit buildings).
Forward outlook
- Local home prices are declining (-3.0%/yr); year-one equity from $691 of loan paydown is wiped out by about $3k of value loss. Plan a longer hold.
- Ray County population projected at -23% by 2050 — secular population decline; favor cash flow + early exit over multi-decade hold.
- At projected returns (-3.0% appreciation + 3.0% rent growth), your $28k cash investment doubles in ~10 years — after that, you're playing with house money.
Negotiation context
- It's been on market 94 days — a 9% lower offer ($91k) is reasonable based on typical stale-listing flexibility.
- 9 sale attempts since 18y ago; this cycle's ask has dropped $75k (43%) from the opening price — seller is motivated, your offer sets the floor, not the list.
Risks & watch-outs
- Watch-outs: property tax is 2.7% of price.
Questions for the listing agent
- It's been on market 94 days. Have you received any prior offers? Is the seller open to a 9% concession, seller financing, or rate buy-down credit?
- Built in 1974 — when were the roof, HVAC, electrical panel, plumbing, and water heater last replaced?
- Property tax is high relative to price — has the assessment been appealed recently, and will the sale trigger a re-assessment?
- Why hasn't it sold? Are there any deal-killer items the seller is aware of (foundation, flood, title, zoning, code violations)?
- Is there a deadline driving the sale (1031 exchange, divorce, estate, relocation)? That informs how much negotiation room exists.
- What's the average days-on-market for RENTAL listings here right now (not sales)? A rising rental-DOM trend means longer vacancies and softer asking-rent achievability than the comps imply.
- What's the recent tenant-quality profile in this submarket — average credit score on applications, eviction rate, late-payment / NSF rate, and stable-employment percentage? A property-management company in the area should have these aggregated.
- How much new for-sale + rental construction is in the pipeline within 1–3 miles? Heavy new supply typically softens prices + rents 12–24 months out; constrained supply supports both.
Investment metrics
- 1% rule
- 1.35% ✓
- Cap rate
- 9.59%
- Cash-on-cash
- 11.76%
- DSCR
- 1.52
- GRM
- 6.2
CMA / ARV
- ARV (on-the-fly)
- $225,940
- Comps found
- 12
Show comp detail 12 sales within ~0.75 mi
| Address | Dist | Beds/Ba | Sqft | Sold | Price | $/sf | Match |
|---|---|---|---|---|---|---|---|
| 106 S Doniphan St | 0.16mi | 3/1.0 | 1,505 (+5%) | 3mo | $229,000 | $152 | 79 |
| 242 S Raum St | 0.27mi | 3/1.0 | 1,464 (+2%) | 4mo | $128,000 | $87 | 78 |
| 210 E Moss St | 0.09mi | 3/2.0 | 1,568 (+10%) | 9mo | $249,900 | $159 | 70 |
| 160 Nolker Dr | 0.48mi | 3/1.5 | 1,475 (+3%) | 9mo | $234,000 | $159 | 65 |
| 154 Cardinal Cir | 0.57mi | 3/1.0 | 1,438 (+1%) | 7mo | $175,000 | $122 | 65 |
| 811 West St | 0.70mi | 3/1.5 | 1,450 (+1%) | 4mo | $239,900 | $165 | 61 |
| 124 S Doniphan St | 0.14mi | 3/1.0 | 1,225 (-14%) | 12mo | $170,000 | $139 | 58 |
| 113 W 8th Ter | 0.63mi | 4/2.0 (+1) | 1,500 (+5%) | 8mo | $235,000 | $157 | 49 |
| 522 E 3rd St | 0.32mi | 3/2.0 | 1,616 (+13%) | 15mo | $229,500 | $142 | 48 |
| 414 S Raum St | 0.31mi | 3/2.0 | 1,218 (-15%) | 14mo | $192,500 | $158 | 47 |
| 412 W Moss St | 0.46mi | 3/2.0 | 1,248 (-13%) | 14mo | $198,000 | $159 | 44 |
| 169 Nolker Dr | 0.51mi | 3/2.0 | 1,562 (+9%) | 22mo | $249,900 | $160 | 41 |
Match score weights: distance 35% · size 25% · config 20% · recency 20%. Top-matched comps best support the ARV.
Projected returns pro-forma
-3.0% appreciation · 3.0% rent growth · sell at horizon
- IRR
- 1.3%
- Equity multiple
- 1.05×
- Total profit
- $1,360
- Equity at exit
- $14,910
- IRR
- 11.0%
- Equity multiple
- 1.86×
- Total profit
- $24,024
- Equity at exit
- $8,646
Cash invested: $28,000 (down + closing). Projections, not guarantees.
Landlord ↔ Tenant lean methodology
- Overall (STATE)
- 81 Strongly Landlord-Friendly
- State Missouri
- 81 Strongly Landlord-Friendly · R+10
- County
- — inherits STATE
- City
- — inherits STATE
ZIP-level market 64062
- Home prices YoY
- -6.1%
- Active inventory
- 63
- Price-to-rent
- 6.2×
Monthly cashflow live
- Estimated rent
- $1,346 medium interval (Pro) →
- Mortgage (P&I)
- −$524
- Tax from tax record
- −$223 /mo · $2,677/yr
- Insurance
- −$42
- HOA
- −$0
- Vacancy / Maint / Mgmt
- −$283
- Net cashflow
- $275
Break-even live
Sensitivity live
| Price | -10% $331 | -5% $303 | +0% $275 | +5% $246 | +10% $218 |
|---|---|---|---|---|---|
| Rent | -10% $168 | -5% $221 | +0% $275 | +5% $328 | +10% $381 |
| Rate | -1.0pp $325 | -0.5pp $300 | base $275 | +0.5pp $249 | +1.0pp $222 |
UW: 25.0% down · 7.5% · 30yr · 1.5% tax · 5.0% vac · 8.0% maint · 8.0% mgmt
Financing live
Cash to close
- Down payment
- $25,000
- Closing costs
- $3,000
- Reserves months
- —
- Total cash needed
- —
Loan-product check · same deal, 3 products live
Conventional
25% down · 7.5% · 30yr
- Down + closing
- —
- Monthly P&I
- —
- Monthly cashflow
- —
- DSCR
- —
- Eligible?
- —
Personal DTI + credit; lowest rate.
DSCR
20% down · 8.5% · 30yr
- Down + closing
- —
- Monthly P&I
- —
- Monthly cashflow
- —
- DSCR
- —
- Eligible?
- —
No personal income docs; deal must DSCR.
Hard money
10% down · 12.0% · 12mo
- Down + closing
- —
- Monthly P&I
- —
- Monthly cashflow
- —
- DSCR
- —
- Eligible?
- —
Short-term bridge; refi at stabilization.
Listing history 25 events
-
2026-03-04status Pending
-
2026-02-24price $100,000
-
2026-02-21status Active
-
2026-02-07historical Active Under Contract
-
2026-01-30price $110,000
-
2026-01-17price $120,000
-
2025-12-28price $130,000
-
2025-12-02price $150,000
-
2025-11-30$175,000 Active
-
2025-10-23historical
-
2025-08-29$235,100 Active
-
2024-06-10soldstatus Closed 419-char remark
Show marketing remark (419 chars)
Welcome to this charming three-bedroom home nestled on a tranquil dead-end street. As you enter the home you are greeted by a cozy, renovated living space with tons of natural lighting with new floor covering throughout. The adjacent kitchen features ample cabinet space and a breakfast nook perfect for enjoying your morning coffee, the basement features a cozy family room, full bath and laundry and a one car garage.
-
2024-05-07status Pending 419-char remark
Show marketing remark (419 chars)
Welcome to this charming three-bedroom home nestled on a tranquil dead-end street. As you enter the home you are greeted by a cozy, renovated living space with tons of natural lighting with new floor covering throughout. The adjacent kitchen features ample cabinet space and a breakfast nook perfect for enjoying your morning coffee, the basement features a cozy family room, full bath and laundry and a one car garage.
-
2024-04-16$212,000 Active 419-char remark
Show marketing remark (419 chars)
Welcome to this charming three-bedroom home nestled on a tranquil dead-end street. As you enter the home you are greeted by a cozy, renovated living space with tons of natural lighting with new floor covering throughout. The adjacent kitchen features ample cabinet space and a breakfast nook perfect for enjoying your morning coffee, the basement features a cozy family room, full bath and laundry and a one car garage.
-
2024-04-12historical
-
2024-03-10status Active
-
2024-03-04status Pending
-
2024-02-10status Active
-
2024-02-02historical
-
2024-01-30$217,000 Active
-
2014-09-16soldstatus
-
2014-08-04$50,000
-
2008-12-15soldstatus
-
2008-11-05$107,000
-
2007-06-27soldstatus
ⓘ Source: listings_history table (triggers on properties + properties_extension) + one-shot
backfill from property_details.listing_events for pre-trigger history.
Tax reassessment forecast MO · Resets to sale price
- Current annual tax
- $2,677 · $223/mo
- Projected year-2 tax
- $2,677 · $223/mo
- Expected delta
- $0/yr ($0/mo · 0.0%)
ⓘ Screening estimate from a state-policy table — verify with the county assessor before closing.
Climate risk First Street
- Flood 1/10 Low FEMA zone X (unshaded) · 0% chance over 30 yrs
- Wildfire 3/10 Moderate
- Heat 4/10 Moderate 7 d/yr ≥106°F today · 16 d/yr by 30 yrs out
- Wind 2/10 Low
- Air quality 3/10 Moderate 4 unhealthy d/yr today · 4 by 30 yrs out
Nearby sold comps map
Loading sold comps map…
Walkable amenities ~0.75 mi
Loading nearby amenities…
Taxation est. · year 1
- Rental income
- $16,157
- − Mortgage interest
- −$5,602
- − Property taxes
- −$2,677
- − Insurance
- −$500
- − Repairs & maintenance
- −$1,293
- − Management
- −$1,293
- − Depreciation
- −$2,909
- Taxable income
- $1,884
- Est. tax owed @ 24.0%
- −$452
- After-tax cash flow
- $2,842/yr
For passive investors: Depreciation is non-cash, so a rental often shows a tax loss while cash-flowing — sheltering income. Rental losses are passive: they offset passive income freely, and up to $25,000/yr can offset ordinary (W-2) income if you actively participate and your MAGI is under $100k (phasing out to $0 by $150k); unused losses carry forward. On sale, claimed depreciation is recaptured at up to 25%, and gains may owe capital-gains tax (a 1031 exchange can defer both). Figures are a year-1 estimate at your 24.0% rate — not tax advice; consult a CPA.
Schools (NCES district)
- District
- Lawson R-Xiv
- NCES district ID
- 2918220
- Math proficiency
- 46% ▼ -8.00%
- Reading proficiency
- 55% ▲ 1.00%
- Median HH income
- $64,448
- Composite
- 44.55/100
- National rank
- #2787
- State rank
- #28 of 324 in MO
Livability — Lawson
- Score
- 67/100
- State rank
- #197
- US rank
- #10156
Category grades
Schools grade is shown separately in the Schools card above.
Census & demographics
- Census place
- Lawson, MO
- Population (ZIP)
- 6,752
Population outlook (Ray County) Hauer SSP2
- Today (2025)
- 21,420 people
- By 2030
- 20,507 · -4.3%
- By 2040
- 18,550 · -13.4%
- By 2050
- 16,516 · -22.9%
- By 2075
- 12,899 · -39.8%
- By 2100
- 10,413 · -51.4%
Race, ethnicity, and origin ACS 2023
- Neighborhood character
- Predominantly White (96%)
- Race & ethnicity
- White 96% Two or more races 3% Hispanic / Latino 2%
- Common ancestry
- Lithuanian 3% Slovak 3% Portuguese 2%
- Foreign-born
- 0%
- Languages at home
- 99% English-only · Spanish 1%
Political lean MEDSL · Ray
- 2024 margin
- Solid R (+48.7) · D 25.1% · R 73.8% · Other 1.1%
- 2008→2024 swing
- -45.5pp toward R · 2008: -3.2pp · 2024: -48.7pp
- All cycles
- 2024: R+48.7 2020: R+45.0 2016: R+37.1 2012: R+14.9 2008: R+3.2
Not yet ingested
- Civics
- —
Market trends
- HPI YoY
- ▼ -21.03%
- Current HPI
- 323.5321
- Rent YoY
- —
- Metro
- —
- State GDP YoY
- ▲ 1.84%
- F500 in state
- 20
Industry mix (Fortune 500 HQ in MO)
| Industry | F500 HQs | Revenue |
|---|---|---|
| Healthcare | 1 | $163B |
|
||
| Insurance | 1 | $21B |
|
||
| Industrial Technology | 1 | $17B |
|
||
| Retail | 1 | $16B |
|
||
| Industrial Distribution | 1 | $10B |
|
||
| Utilities | 1 | $9B |
|
||
Price history
-6.5% since first listed25 events — show timeline
- 2026-03-04 Pending — Heartland MLS as Distributed by MLS Grid
- 2026-02-24 Price Changed $100,000 Heartland MLS as Distributed by MLS Grid
- 2026-02-21 Relisted — Heartland MLS as Distributed by MLS Grid
- 2026-02-07 Contingent — Heartland MLS as Distributed by MLS Grid
- 2026-01-30 Price Changed $110,000 Heartland MLS as Distributed by MLS Grid
- 2026-01-17 Price Changed $120,000 Heartland MLS as Distributed by MLS Grid
- 2025-12-28 Price Changed $130,000 Heartland MLS as Distributed by MLS Grid
- 2025-12-02 Price Changed $150,000 Heartland MLS as Distributed by MLS Grid
- 2025-11-30 Listed $175,000 Heartland MLS as Distributed by MLS Grid
- 2025-10-23 Listing Removed — Heartland MLS as Distributed by MLS Grid
- 2025-08-29 Listed $235,100 Heartland MLS as Distributed by MLS Grid
- 2024-06-10 Sold (MLS) — Heartland MLS as Distributed by MLS Grid
- 2024-05-07 Pending — Heartland MLS as Distributed by MLS Grid
- 2024-04-16 Listed $212,000 Heartland MLS as Distributed by MLS Grid
- 2024-04-12 Listing Removed — Heartland MLS as Distributed by MLS Grid
- 2024-03-10 Relisted — Heartland MLS as Distributed by MLS Grid
- 2024-03-04 Pending — Heartland MLS as Distributed by MLS Grid
- 2024-02-10 Relisted — Heartland MLS as Distributed by MLS Grid
- 2024-02-02 Listing Removed — Heartland MLS as Distributed by MLS Grid
- 2024-01-30 Listed $217,000 Heartland MLS as Distributed by MLS Grid
- 2014-09-16 Sold (MLS) — Heartland MLS as Distributed by MLS Grid
- 2014-08-04 Listed $50,000 Heartland MLS as Distributed by MLS Grid
- 2008-12-15 Sold (MLS) — Heartland MLS as Distributed by MLS Grid
- 2008-11-05 Listed $107,000 Heartland MLS as Distributed by MLS Grid
- 2007-06-27 Sold (Public Records) — Public Records
Property tax history
+5.9%/yrLatest (2025): $2,677 · +4.7% YoY. Source: county tax records.
Cash-flow waterfall
monthlySold comps — $/sqft
last 12 mo · ≤1 miLoading sold comps…