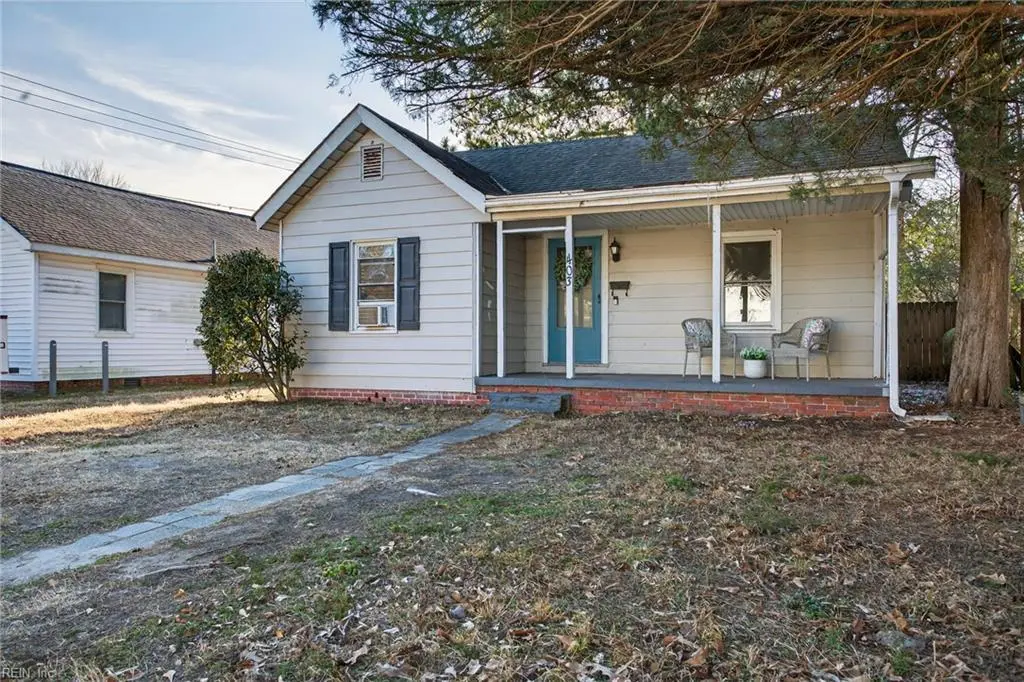
403 Elizabeth St · Suffolk, VA
Flood risk 1/10 · Minimal
- FEMA flood zone
- X (unshaded)
- Chance of flooding over 30 yrs
- 0.0%
- Est. flood insurance / yr
- $507 – $1,088
Fire risk 2/10 · Minimal
- Est. fire insurance / yr
- $666 – $1,236
Heat risk 9/10 · Severe
- Hot days now (above 107°F)
- 7 days/yr
- Hot days in 30 yrs
- 16 days/yr
Wind risk 8/10 · Major
- Chance of severe wind over 30 yrs
- 80.0%
Air-quality risk 2/10 · Minimal
- Unhealthy air days now
- 0 days/yr
- Unhealthy air days in 30 yrs
- 1 days/yr
Risk factors via First Street. Map © Google.
Why this score? — see what drove the C+ grade
The composite is a weighted blend of 9 inputs, each scored 0–100. Each bar is that input's sub-score; the figure is the points it added to the 100-point composite (weight × sub-score).
- Cash flow +22.5/30.0
- ARV discount +14.8/15.0
- DSCR +7.2/10.0
- 1% rule +5.3/10.0
- Schools +4.8/10.0
- Rent growth +4.0/5.0
- Livability +3.9/5.0
- Condition / age +2.5/5.0
- Appreciation +0.0/10.0
$164,500
🖨 Deal sheet 📄 Offer letter ✓ Due diligence
Listing remarks
Welcome home to this adorable two-bedroom, one bath bungalow with a spacious yard and an updated kitchen designed for everyday living. Luxury plank vinyl flooring throughout house. Enjoy comfortable, single-level living with plenty of outdoor space to relax, play, or host gatherings. Great for first time home buyers, investors, or those just looking to downsize. Convenient to shopping, dining, and interstates. Don't miss this one!
Key facts
- Spacious yard
- Single level living
- Updated kitchen
Tags
Property features AI
Finance
- HOA & community: No HOA
Exterior
- Parking: Driveway parking spaces; Street parking
- Utilities: City/County water; City/County sewer; Electric water heater
- Home design: Detached bungalow; Single-story; Crawl foundation; Simple ownership
- Construction: Asphalt shingle roof
- Exterior features: Aluminum siding; Back fenced yard; Porch
Interior
- Kitchen: Electric range; Refrigerator; Dishwasher; Breakfast area
- Bedrooms: 1st-floor bedroom with full bathroom
- Flooring: Laminate
- Bathrooms: 1 full bathroom
- Heating & cooling: Baseboard heating; Electric heating; Window/wall air conditioning
- Interior features: Pull-down attic stairs; Attic
- Laundry & utility: Washer hookup; Dryer hookup; Utility room
Neighborhood map
What this means for you Summary
Snapshot
- This is a 3-bed/1.0-bath single-family listed at $164k.
Deal economics
- At list price, monthly cash flow is $277 ($3k/yr) — positive.
- The deal already cash-flows at list — no discount required.
- Meets the 1% rule at list price ($2k rent vs $164k).
- Recommended offer: $162k (1.5% below list) — sets the bar for market timing.
- Cap rate 8.3% vs local median 3.5% in Suffolk — top-decile yield for the area; either an underpriced asset or a hidden risk that comps aren't pricing in. Stress-test before assuming the spread holds.
Location & tenants
- Location reads 77/100 on livability (#88 in VA, #2,896 nationally) — a middle-class / working-renter tenant base. Strengths: housing A+, health & safety A+, employment A-; Watch: crime C-, commute F.
- Suffolk City Public School District (suburban): math 41% / reading 69% proficiency, ranked #72 of 131 in VA (top 55%) — acceptable for families but not a draw, mixed tenant base, ~2y average lease.
- Zoned schools: Mack Benn Jr. Elementary (math 27% / reading 50%, grade F, #924 of 1,108 statewide, top 84%, 684 students, 66% FRL); King'S Fork High (math 44% / reading 77%, grade C+, #244 of 319 statewide, top 77%, 1,697 students, 63% FRL) — zoned schools average 64% FRL vs 39% district-wide (25 pts higher); higher-poverty schools than district average — tighter screening recommended.
- Market conditions: Rents rising fast (+5.8%/yr); 536 active listings in the ZIP; 10 comparable units currently listed for rent nearby; rentals lingering (median 44d on market — plan ~5-8 weeks vacancy on turnover, expect pricing pressure); 50% of comp listings sitting > 30 days — soft ceiling on asking rent; solid renter incomes; 680 units permitted in Suffolk city in 2024 (0 in 5+ unit buildings).
Forward outlook
- Local home prices are declining (-3.0%/yr); year-one equity from $1k of loan paydown is wiped out by about $5k of value loss. Plan a longer hold.
- Suffolk County population projected at +11% by 2050 — modest demand growth; plan on rents tracking national, not racing it.
- At projected returns (-3.0% appreciation + 5.8% rent growth), your $46k cash investment doubles in ~10 years — after that, you're playing with house money.
Negotiation context
- It's been on market 19 days — a 2% lower offer ($162k) is reasonable based on typical stale-listing flexibility.
- 4 sale attempts since 8y ago with the ask held roughly flat each time — persistent listings suggest the price (not the market) is what's stuck; bring a comps-based counter.
- Current owner paid $140k; 18% above their basis — modest negotiation headroom, anchor on the comps not their cost.
Risks & watch-outs
- Watch-outs: built in 1950 — expect roof / HVAC / electrical / plumbing capex.
- Climate carrying-cost: severe wind risk, 80% chance of damaging wind over 30y; extreme-heat days projected 7→16/yr by 2055 (HVAC capex compounding) — expect insurance premiums to compound above CPI over the hold.
Questions for the listing agent
- Built in 1950 — when were the roof, HVAC, electrical panel, plumbing, and water heater last replaced?
- Is there a deadline driving the sale (1031 exchange, divorce, estate, relocation)? That informs how much negotiation room exists.
- Schools are A-rated — typically a magnet for longer-tenancy family renters. What's the average tenant stay here, and is there a school-zone premium baked into asking?
- What's the average days-on-market for RENTAL listings here right now (not sales)? A rising rental-DOM trend means longer vacancies and softer asking-rent achievability than the comps imply.
- What's the recent tenant-quality profile in this submarket — average credit score on applications, eviction rate, late-payment / NSF rate, and stable-employment percentage? A property-management company in the area should have these aggregated.
- How much new for-sale + rental construction is in the pipeline within 1–3 miles? Heavy new supply typically softens prices + rents 12–24 months out; constrained supply supports both.
Investment metrics
- 1% rule
- 1.03% ✓
- Cap rate
- 8.32%
- Cash-on-cash
- 7.22%
- DSCR
- 1.32
- GRM
- 8.1
CMA / ARV
- ARV (median comp)
- $196,300
- List price
- $164,500
- Delta
- -16.20%
- Verdict
- UNDERPRICED
- Comps
- 18 within 1.0 mi
Show comp detail 7 sales within ~0.75 mi
| Address | Dist | Beds/Ba | Sqft | Sold | Price | $/sf | Match |
|---|---|---|---|---|---|---|---|
| 403 Elizabeth St | 0.00mi | 2/1.0 (-1) | 872 (+9%) | 1mo | $130,000 | $149 | 79 |
| 305 Elizabeth St | 0.06mi | 2/1.0 (-1) | 720 (-10%) | 5mo | $210,000 | $292 | 72 |
| 410 Constance Rd E | 0.03mi | 3/1.0 | 911 (+14%) | 8mo | $212,500 | $233 | 69 |
| 307 Central Ave | 0.62mi | 3/1.0 | 840 (+5%) | 4mo | $135,000 | $161 | 59 |
| 2129 Oregon Ave | 0.70mi | 2/1.0 (-1) | 745 (-7%) | 10mo | $189,000 | $254 | 43 |
| 326 Goodman St | 0.65mi | 2/1.0 (-1) | 858 (+8%) | 13mo | $195,000 | $227 | 41 |
| 309 N 5th St | 0.69mi | 2/1.0 (-1) | 702 (-12%) | 3mo | $165,000 | $235 | 40 |
Match score weights: distance 35% · size 25% · config 20% · recency 20%. Top-matched comps best support the ARV.
Projected returns pro-forma
-3.0% appreciation · 5.84% rent growth · sell at horizon
- IRR
- -2.3%
- Equity multiple
- 0.91×
- Total profit
- $-4,039
- Equity at exit
- $24,527
- IRR
- 10.2%
- Equity multiple
- 1.89×
- Total profit
- $40,796
- Equity at exit
- $14,223
Cash invested: $46,060 (down + closing). Projections, not guarantees.
Landlord ↔ Tenant lean methodology
- Overall (STATE)
- 55 Moderately Landlord-Leaning
- State Virginia
- 55 Moderately Landlord-Leaning · D+2
- County
- — inherits STATE
- City
- — inherits STATE
ZIP-level market 23434
- Rents YoY
- 5.8%
- Active inventory
- 536
- Price-to-rent
- 8.1×
Monthly cashflow live
- Estimated rent
- $1,694 high interval (Pro) →
- Mortgage (P&I)
- −$863
- Tax from tax record
- −$130 /mo · $1,562/yr
- Insurance
- −$69
- HOA
- −$0
- Vacancy / Maint / Mgmt
- −$356
- Net cashflow
- $277
Break-even live
UW: 25.0% down · 7.5% · 30yr · 1.5% tax · 5.0% vac · 8.0% maint · 8.0% mgmt
Financing live
Cash to close
- Down payment
- $41,125
- Closing costs
- $4,935
- Reserves months
- —
- Total cash needed
- —
Loan-product check · same deal, 3 products live
Conventional
25% down · 7.5% · 30yr
- Down + closing
- —
- Monthly P&I
- —
- Monthly cashflow
- —
- DSCR
- —
- Eligible?
- —
Personal DTI + credit; lowest rate.
DSCR
20% down · 8.5% · 30yr
- Down + closing
- —
- Monthly P&I
- —
- Monthly cashflow
- —
- DSCR
- —
- Eligible?
- —
No personal income docs; deal must DSCR.
Hard money
10% down · 12.0% · 12mo
- Down + closing
- —
- Monthly P&I
- —
- Monthly cashflow
- —
- DSCR
- —
- Eligible?
- —
Short-term bridge; refi at stabilization.
Rent comps 10 comps
| Address | Beds | Baths | Sqft | Rent | $/sqft | DOM | Units | Dist |
|---|---|---|---|---|---|---|---|---|
| 307 Central Ave Suffolk, VA | 3.0 | 1.0 | 840 | $1,700 | $2.02 | 43d | 1 | 0.64mi |
| 214 N 7th St Unit NA Suffolk, VA | 2.0 | 1.0 | 760 | $1,500 | $1.97 | 23d | 1 | 0.89mi |
| 181 N Main St Suffolk, VA | 2.0 | 1.0–2.0 | 804 | $1,885 | $2.34 | 1d | 15 | 0.93mi |
| 326 E Washington St Suffolk, VA | 2.0 | 2.0 | 839 | $1,629 | $1.94 | 3d | 1 | 0.95mi |
| 120 S 10th St Suffolk, VA | 2.0 | 1.0 | 736 | $1,250 | $1.70 | 43d | 1 | 1.05mi |
| 558 1st Ave Suffolk, VA | 2.0 | 1.5 | 1000 | $1,250 | $1.25 | 43d | 1 | 1.28mi |
| 564 1st Ave Suffolk, VA | 2.0 | 1.0 | 1000 | $1,100 | $1.10 | 43d | 1 | 1.29mi |
| 1000 Meridian Obici Way Suffolk, VA | 1.0–2.0 | 1.0–2.0 | 889 | $2,024 | $2.28 | 1d | 10 | 1.31mi |
| 1410 Blythewood Ln Suffolk, VA | 4.0 | 1.5 | 1056 | $1,800 | $1.70 | 43d | 1 | 1.39mi |
| 308 Saint James Ave Unit B Suffolk, VA | 2.0 | 1.0 | 936 | $1,295 | $1.38 | 23d | 1 | 1.46mi |
Listing history 15 events
-
2026-05-13status Under Contract 434-char remark
-
2026-05-06historical Active Under Contract 434-char remark
-
2026-04-24$164,500 Active 434-char remark
-
2026-04-23historical
-
2026-04-17status Active
-
2026-04-06historical Active Under Contract
-
2026-03-18price $179,000
-
2026-02-04$184,900 Active
-
2018-08-23soldstatus $112,000
-
2018-07-18status Under Contract
-
2018-05-29price $115,900
-
2018-04-24price $118,900
-
2018-02-22$119,900 Active
-
2008-05-30soldstatus $128,900
-
2003-10-17soldstatus $61,500
ⓘ Source: listings_history table (triggers on properties + properties_extension) + one-shot
backfill from property_details.listing_events for pre-trigger history.
Tax reassessment forecast VA · Resets to sale price
- Current annual tax
- $1,562 · $130/mo
- Projected year-2 tax
- $1,562 · $130/mo
- Expected delta
- $0/yr ($0/mo · 0.0%)
ⓘ Screening estimate from a state-policy table — verify with the county assessor before closing.
Climate risk First Street
- Flood 1/10 Low FEMA zone X (unshaded) · 0% chance over 30 yrs
- Wildfire 2/10 Low
- Heat 9/10 Extreme 7 d/yr ≥107°F today · 16 d/yr by 30 yrs out
- Wind 8/10 Severe 80% chance of damaging wind over 30 yrs
- Air quality 2/10 Low 0 unhealthy d/yr today · 1 by 30 yrs out
Nearby sold comps map
Loading sold comps map…
Walkable amenities ~0.75 mi
Loading nearby amenities…
Taxation est. · year 1
- Rental income
- $20,334
- − Mortgage interest
- −$9,215
- − Property taxes
- −$1,562
- − Insurance
- −$822
- − Repairs & maintenance
- −$1,627
- − Management
- −$1,627
- − Depreciation
- −$4,785
- Taxable income
- $696
- Est. tax owed @ 24.0%
- −$167
- After-tax cash flow
- $3,160/yr
For passive investors: Depreciation is non-cash, so a rental often shows a tax loss while cash-flowing — sheltering income. Rental losses are passive: they offset passive income freely, and up to $25,000/yr can offset ordinary (W-2) income if you actively participate and your MAGI is under $100k (phasing out to $0 by $150k); unused losses carry forward. On sale, claimed depreciation is recaptured at up to 25%, and gains may owe capital-gains tax (a 1031 exchange can defer both). Figures are a year-1 estimate at your 24.0% rate — not tax advice; consult a CPA.
Schools (NCES district)
- District
- Suffolk City Public School District
- NCES district ID
- 5103710
- Math proficiency
- 41% ▼ -43.00%
- Reading proficiency
- 69% ▼ -8.00%
- Median HH income
- $65,573
- Composite
- 48.31/100
- National rank
- #2151
- State rank
- #72 of 131 in VA
Livability — Suffolk
- Score
- 77/100
- State rank
- #88
- US rank
- #2896
Category grades
Schools grade is shown separately in the Schools card above.
Census & demographics
- Census place
- Suffolk, VA
- County
- Suffolk City · 88,108 people
- City population
- 88,108
- Metro
- Virginia Beach-Norfolk-Newport News, VA-NC
- Population (ZIP)
- 54,387
- Household income
- $79,877
- Rent vs Own
- Severe rent burden
- 1934.0
Population outlook (Suffolk County) Hauer SSP2
- Today (2025)
- 95,269 people
- By 2030
- 98,269 · +3.1%
- By 2040
- 103,177 · +8.3%
- By 2050
- 105,777 · +11.0%
- By 2075
- 110,963 · +16.5%
- By 2100
- 103,711 · +8.9%
Race, ethnicity, and origin ACS 2023
- Neighborhood character
- Diverse neighborhood (Simpson 0.58)
- Race & ethnicity
- Black 49% White 41% Two or more races 5% Hispanic / Latino 4% Asian 1%
- Common ancestry
- Lithuanian 1% Slovak 1% Italian 1%
- Foreign-born
- 3% · Canada
- Languages at home
- 96% English-only · Spanish 2%
Political lean MEDSL · Suffolk
- 2024 margin
- D (+15.9) · D 57.4% · R 41.5% · Other 1.2%
- 2008→2024 swing
- +2.7pp toward D · 2008: 13.2pp · 2024: 15.9pp
- All cycles
- 2024: D+15.9 2020: D+17.3 2016: D+13.8 2012: D+15.1 2008: D+13.2
Not yet ingested
- Civics
- —
Market trends
- HPI YoY
- ▼ -383.80%
- Current HPI
- 158.5866
- Rent YoY
- ▲ 5.84%
- Metro
- Virginia Beach-Norfolk-Newport News, VA-NC
- State GDP YoY
- ▲ 2.40%
- F500 in state
- 50
Industry mix (Fortune 500 HQ in VA)
| Industry | F500 HQs | Revenue |
|---|---|---|
| Aerospace / Defense | 4 | $236B |
|
||
| Technology / Defense | 3 | $32B |
|
||
| Financial Services | 2 | $176B |
|
||
| Utilities | 2 | $27B |
|
||
| Insurance | 2 | $25B |
|
||
| Technology | 2 | $15B |
|
||
Price history
+127.6% since first listed17 events — show timeline
- 2026-05-26 Sold (Public Records) $140,000 Public Records
- 2026-05-22 Sold (MLS) $130,000 REINMLS
- 2026-05-13 Pending — REINMLS
- 2026-05-06 Contingent — REINMLS
- 2026-04-24 Listed $164,500 REINMLS
- 2026-04-23 Listing Removed — REINMLS
- 2026-04-17 Relisted — REINMLS
- 2026-04-06 Contingent — REINMLS
- 2026-03-18 Price Changed $179,000 REINMLS
- 2026-02-04 Listed $184,900 REINMLS
- 2018-08-23 Sold (Public Records) $112,000 Public Records
- 2018-07-18 Pending — REINMLS
- 2018-05-29 Price Changed $115,900 REINMLS
- 2018-04-24 Price Changed $118,900 REINMLS
- 2018-02-22 Listed $119,900 REINMLS
- 2008-05-30 Sold (Public Records) $128,900 Public Records
- 2003-10-17 Sold (Public Records) $61,500 Public Records
Property tax history
+4.4%/yrLatest (2025): $1,562 · +8.9% YoY. Source: county tax records.
Cash-flow waterfall
monthlySold comps — $/sqft
last 12 mo · ≤1 miLoading sold comps…