1013-C Salem Pike · Cynthiana, KY
Flood risk 1/10 · Minimal
- FEMA flood zone
- X (unshaded)
- Chance of flooding over 30 yrs
- 0.0%
- Est. flood insurance / yr
- $507 – $1,088
Fire risk 4/10 · Minor
- Est. fire insurance / yr
- $839 – $1,559
Heat risk 4/10 · Minor
- Hot days now (above 102°F)
- 7 days/yr
- Hot days in 30 yrs
- 18 days/yr
Wind risk 2/10 · Minimal
- Chance of severe wind over 30 yrs
- 2.0%
Air-quality risk 2/10 · Minimal
- Unhealthy air days now
- 0 days/yr
- Unhealthy air days in 30 yrs
- 1 days/yr
Risk factors via First Street. Map © Google.
Why this score? — see what drove the C- grade
The composite is a weighted blend of 9 inputs, each scored 0–100. Each bar is that input's sub-score; the figure is the points it added to the 100-point composite (weight × sub-score).
- Cash flow +15.5/30.0
- Appreciation +10.0/10.0
- ARV discount +7.5/15.0
- DSCR +4.8/10.0
- 1% rule +4.3/10.0
- Livability +3.7/5.0
- Rent growth +2.5/5.0
- Schools +2.2/10.0
- Condition / age +1.0/5.0
$173,500
🖨 Deal sheet 📄 Offer letter ✓ Due diligence
Listing remarks MLS
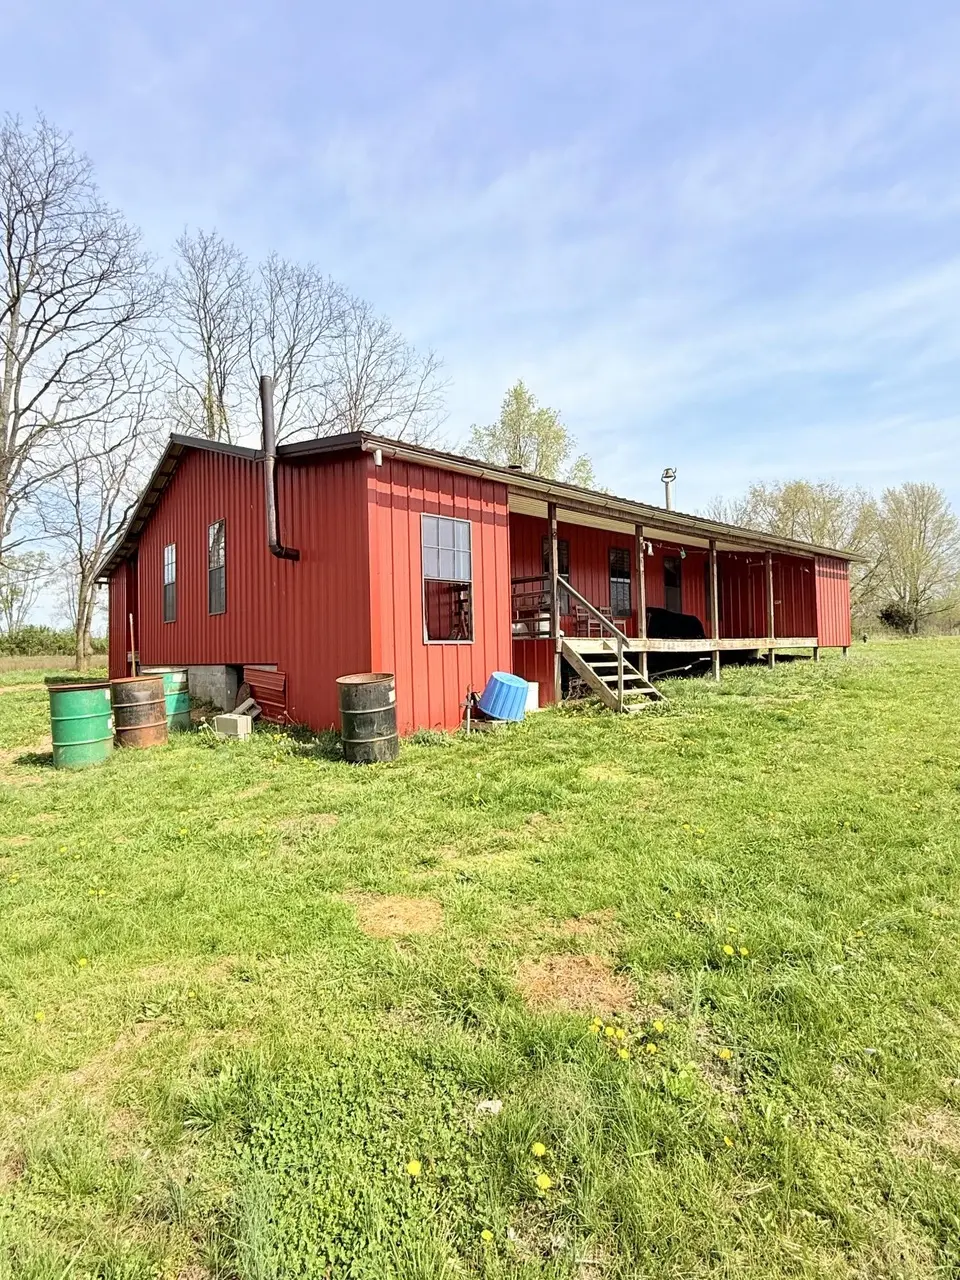
This is the one you have been waiting for!!! 44 +/- acres of crop ground - pasture with the opportunity for a beautiful home site with all the views. Property is fenced and has a good pond, Also a 72x32 barn with attached 72x21 shed / lean to for your hay or equipment storage needs.
Key facts
- 5 acre lot
- Built 2018
- Listed 77 days
Property features AI
Exterior
- Parking: Driveway
- Utilities: Electricity available; Cable available; Water available; No sewer
- Home design: Single-story house
- Construction: Aluminum siding; Block foundation; Metal roof; Building area approximately 1,152
- Exterior features: Barn(s) and stable(s) on the property; Partial wire fencing; Few trees on the lot; Public water available
Interior
- Flooring: Wood flooring
- Interior features: Five total rooms; Crawl space basement; No fireplace
Neighborhood map
What this means for you Summary
Snapshot
- This is a 3-bed/?-bath single-family listed at $174k. Condition is rated poor.
Deal economics
- At list price, monthly cash flow is $69 ($834/yr) — positive.
- The deal already cash-flows at list — no discount required.
- To meet the 1% rule (rent ≥ 1% of price), the offer needs to be $161k (7.5% below list).
- Recommended offer: $161k (7.5% below list) — sets the bar for 1% rule.
- Cap rate 6.8% vs local median 3.5% in Cynthiana — top-decile yield for the area; either an underpriced asset or a hidden risk that comps aren't pricing in. Stress-test before assuming the spread holds.
Location & tenants
- Location reads 74/100 on livability (#113 in KY, #4,911 nationally) — a middle-class / working-renter tenant base. Strengths: cost of living A+, housing A+, health & safety A+; Watch: amenities F, commute F, employment D-.
- Harrison County (town): math 21% / reading 32% proficiency, ranked #133 of 165 in KY (top 81%) — low school quality limits family demand, transient renter base, plan for 1-2y turnover.
- Zoned schools: Harrison County Middle School (math 19% / reading 35%, grade F, #172 of 217 statewide, top 80%, 607 students, 58% FRL); Harrison County High School (math 29% / reading 41%, grade F, #74 of 254 statewide, top 29%, 865 students, 46% FRL) — zoned schools at 52% FRL track the district average.
- Market conditions: 95 active listings in the ZIP; 69 units permitted in Harrison County in 2024 (0 in 5+ unit buildings).
Forward outlook
- In year one you build about $19k of equity ($1k loan paydown + $17k appreciation (10.0% local appreciation)).
- Harrison County population projected to shrink 10% by 2050 — rents likely to lag national; underwrite the cash flow, not the appreciation.
- At projected returns (10.0% appreciation + 3.0% rent growth), your $49k cash investment doubles in ~3 years — after that, you're playing with house money.
- By year 3, paydown + projected appreciation supports a ~$47k cash-out refi (75% LTV) — recoverable capital for the next deal without selling this one.
Negotiation context
- It's been on market 77 days — a 6% lower offer ($163k) is reasonable based on typical stale-listing flexibility.
- 2 sale attempts with the ask held roughly flat each time — persistent listings suggest the price (not the market) is what's stuck; bring a comps-based counter.
Questions for the listing agent
- It's been on market 77 days. Have you received any prior offers? Is the seller open to a 7% concession, seller financing, or rate buy-down credit?
- Have any recent inspections been done? Can we get a copy of the seller's disclosures and any deferred-maintenance estimates?
- Why hasn't it sold? Are there any deal-killer items the seller is aware of (foundation, flood, title, zoning, code violations)?
- Is there a deadline driving the sale (1031 exchange, divorce, estate, relocation)? That informs how much negotiation room exists.
- What's the average days-on-market for RENTAL listings here right now (not sales)? A rising rental-DOM trend means longer vacancies and softer asking-rent achievability than the comps imply.
- What's the recent tenant-quality profile in this submarket — average credit score on applications, eviction rate, late-payment / NSF rate, and stable-employment percentage? A property-management company in the area should have these aggregated.
- How much new for-sale + rental construction is in the pipeline within 1–3 miles? Heavy new supply typically softens prices + rents 12–24 months out; constrained supply supports both.
Investment metrics
- 1% rule
- 0.93% ✗
- Cap rate
- 6.77%
- Cash-on-cash
- 1.72%
- DSCR
- 1.08
- GRM
- 9.0
CMA / ARV
No comps found within radius.
Projected returns pro-forma
10.0% appreciation · 3.0% rent growth · sell at horizon
- IRR
- 25.5%
- Equity multiple
- 3.04×
- Total profit
- $98,943
- Equity at exit
- $156,303
- IRR
- 22.5%
- Equity multiple
- 6.93×
- Total profit
- $287,938
- Equity at exit
- $337,072
Cash invested: $48,580 (down + closing). Projections, not guarantees.
Landlord ↔ Tenant lean methodology
- Overall (STATE)
- 83 Strongly Landlord-Friendly
- State Kentucky
- 83 Strongly Landlord-Friendly · R+16
- County
- — inherits STATE
- City
- — inherits STATE
ZIP-level market 41031
- Home prices YoY
- 4.4%
- Active inventory
- 95
- Price-to-rent
- 9.0×
Monthly cashflow live
- Estimated rent
- $1,606 medium interval (Pro) →
- Mortgage (P&I)
- −$910
- Tax est. 1.5%
- −$217 /mo · $2,602/yr
- Insurance
- −$72
- HOA
- −$0
- Vacancy / Maint / Mgmt
- −$337
- Net cashflow
- $69
Break-even live
UW: 25.0% down · 7.5% · 30yr · 1.5% tax · 5.0% vac · 8.0% maint · 8.0% mgmt
Financing live
Cash to close
- Down payment
- $43,375
- Closing costs
- $5,205
- Reserves months
- —
- Total cash needed
- —
Loan-product check · same deal, 3 products live
Conventional
25% down · 7.5% · 30yr
- Down + closing
- —
- Monthly P&I
- —
- Monthly cashflow
- —
- DSCR
- —
- Eligible?
- —
Personal DTI + credit; lowest rate.
DSCR
20% down · 8.5% · 30yr
- Down + closing
- —
- Monthly P&I
- —
- Monthly cashflow
- —
- DSCR
- —
- Eligible?
- —
No personal income docs; deal must DSCR.
Hard money
10% down · 12.0% · 12mo
- Down + closing
- —
- Monthly P&I
- —
- Monthly cashflow
- —
- DSCR
- —
- Eligible?
- —
Short-term bridge; refi at stabilization.
Listing history 20 events
-
2026-06-18days on market $173,500 Active 77 DOM
-
2026-06-17days on market $173,500 Active 76 DOM
-
2026-06-16days on market $173,500 Active 75 DOM
-
2026-06-15days on market $173,500 Active 74 DOM
-
2026-06-14days on market $173,500 Active 72 DOM
-
2026-06-10days on market $173,500 Active 69 DOM
-
2026-06-09days on market $173,500 Active 68 DOM
-
2026-06-08days on market $173,500 Active 67 DOM
-
2026-06-07days on market $173,500 Active 66 DOM
-
2026-06-03days on market $173,500 Active 62 DOM
-
2026-06-02days on market $173,500 Active 61 DOM
-
2026-06-01days on market $173,500 Active 60 DOM
-
2026-05-31days on market $173,500 Active 59 DOM
-
2026-05-31days on market $173,500 Active 58 DOM
-
2026-05-18price $320,000 284-char remark
Show marketing remark (284 chars)
This is the one you have been waiting for!!! 44 +/- acres of crop ground - pasture with the opportunity for a beautiful home site with all the views. Property is fenced and has a good pond, Also a 72x32 barn with attached 72x21 shed / lean to for your hay or equipment storage needs.
-
2026-05-18price $173,500
Show marketing remark (284 chars)
This is the one you have been waiting for!!! 44 +/- acres of crop ground - pasture with the opportunity for a beautiful home site with all the views. Property is fenced and has a good pond, Also a 72x32 barn with attached 72x21 shed / lean to for your hay or equipment storage needs.
-
2026-04-02$180,000 Active
-
2026-03-31price $330,000 284-char remark
Show marketing remark (284 chars)
This is the one you have been waiting for!!! 44 +/- acres of crop ground - pasture with the opportunity for a beautiful home site with all the views. Property is fenced and has a good pond, Also a 72x32 barn with attached 72x21 shed / lean to for your hay or equipment storage needs.
-
2026-03-16price $347,600 284-char remark
Show marketing remark (284 chars)
This is the one you have been waiting for!!! 44 +/- acres of crop ground - pasture with the opportunity for a beautiful home site with all the views. Property is fenced and has a good pond, Also a 72x32 barn with attached 72x21 shed / lean to for your hay or equipment storage needs.
-
2025-12-04$374,000 Active 284-char remark
Show marketing remark (284 chars)
This is the one you have been waiting for!!! 44 +/- acres of crop ground - pasture with the opportunity for a beautiful home site with all the views. Property is fenced and has a good pond, Also a 72x32 barn with attached 72x21 shed / lean to for your hay or equipment storage needs.
ⓘ Source: listings_history table (triggers on properties + properties_extension) + one-shot
backfill from property_details.listing_events for pre-trigger history.
Climate risk First Street
- Flood 1/10 Low FEMA zone X (unshaded) · 0% chance over 30 yrs
- Wildfire 4/10 Moderate
- Heat 4/10 Moderate 7 d/yr ≥102°F today · 18 d/yr by 30 yrs out
- Wind 2/10 Low 2% chance of damaging wind over 30 yrs
- Air quality 2/10 Low 0 unhealthy d/yr today · 1 by 30 yrs out
Nearby sold comps map
Loading sold comps map…
Walkable amenities ~0.75 mi
Loading nearby amenities…
Taxation est. · year 1
- Rental income
- $19,269
- − Mortgage interest
- −$9,719
- − Property taxes
- −$2,602
- − Insurance
- −$868
- − Repairs & maintenance
- −$1,541
- − Management
- −$1,541
- − Depreciation
- −$5,047
- Taxable loss
- −$2,050
- Est. tax savings @ 24.0%
- +$492
- After-tax cash flow
- $1,326/yr
For passive investors: Depreciation is non-cash, so a rental often shows a tax loss while cash-flowing — sheltering income. Rental losses are passive: they offset passive income freely, and up to $25,000/yr can offset ordinary (W-2) income if you actively participate and your MAGI is under $100k (phasing out to $0 by $150k); unused losses carry forward. On sale, claimed depreciation is recaptured at up to 25%, and gains may owe capital-gains tax (a 1031 exchange can defer both). Figures are a year-1 estimate at your 24.0% rate — not tax advice; consult a CPA.
Condition & rehab AI · 12 photos
This property requires extensive renovations to bring it up to modern standards, significantly impacting its resale and rental value.
Repairs flagged
- Major kitchen cabinets — severely dated and worn
- Major bathroom fixtures — no visible fixtures
- Major roof shingles — visible wear
- Major exterior siding — rusty and exposed
- Major flooring — worn linoleum
- Major interior walls — peeling paint
- Major windows — broken panes
- Major foundation — visible settling
Value-add opportunities
- Resale kitchen renovation — modernizing the dated kitchen
- Resale bathroom renovation — installing new fixtures
- Resale roof replacement — improving the home's appearance and value
- Resale exterior siding repair — restoring the home's curb appeal
- Resale flooring replacement — modernizing the dated flooring
- Resale interior wall repair — restoring the home's interior condition
- Resale window replacement — improving the home's energy efficiency and appearance
- Both HVAC system replacement — improving comfort and energy efficiency
Renovation cost estimate screening
| Repair item | Severity | Est. cost |
|---|---|---|
| kitchen cabinets · severely dated and worn | Major | $15,000–50,000 |
| bathroom fixtures · no visible fixtures | Major | $15,000–50,000 |
| roof shingles · visible wear | Major | $15,000–50,000 |
| exterior siding · rusty and exposed | Major | $15,000–50,000 |
| flooring · worn linoleum | Major | $15,000–50,000 |
| interior walls · peeling paint | Major | $15,000–50,000 |
| windows · broken panes | Major | $15,000–50,000 |
| foundation · visible settling | Major | $15,000–50,000 |
| Total estimated repair cost · 8 items | $120,000–400,000 |
Value-add ROI direction
- Resale kitchen renovation — modernizing the dated kitchen ↑
- Resale bathroom renovation — installing new fixtures ↑
- Resale roof replacement — improving the home's appearance and value ↑
- Resale exterior siding repair — restoring the home's curb appeal ↑
- Resale flooring replacement — modernizing the dated flooring ↑
- Resale interior wall repair — restoring the home's interior condition ↑
- Resale window replacement — improving the home's energy efficiency and appearance ↑
- Both HVAC system replacement — improving comfort and energy efficiency ↑
ⓘ Cost ranges are severity-bucket heuristics (US national rule-of-thumb). Get contractor quotes + a written scope before underwriting a rehab budget.
Schools (NCES district)
- District
- Harrison County
- NCES district ID
- 2102580
- Math proficiency
- 21% ▼ -25.00%
- Reading proficiency
- 32% ▼ -19.00%
- Median HH income
- $39,744
- Composite
- 22.28/100
- National rank
- #8138
- State rank
- #133 of 165 in KY
Livability — Cynthiana
- Score
- 74/100
- State rank
- #113
- US rank
- #4911
Category grades
Schools grade is shown separately in the Schools card above.
Census & demographics
- Population (ZIP)
- 16,748
Population outlook (Harrison County) Hauer SSP2
- Today (2025)
- 18,605 people
- By 2030
- 18,361 · -1.3%
- By 2040
- 17,685 · -4.9%
- By 2050
- 16,845 · -9.5%
- By 2075
- 14,882 · -20.0%
- By 2100
- 12,314 · -33.8%
Race, ethnicity, and origin ACS 2023
- Neighborhood character
- Predominantly White (93%)
- Race & ethnicity
- White 93% Two or more races 4% Hispanic / Latino 2% Black 2%
- Common ancestry
- Slovak 2% Serbian 2% Italian 2%
- Foreign-born
- 1% · Canada
- Languages at home
- 97% English-only · Spanish 1% German/W. Germanic 1%
Political lean MEDSL · Harrison
- 2024 margin
- Solid R (+48.5) · D 25.1% · R 73.6% · Other 1.3%
- 2008→2024 swing
- -27.4pp toward R · 2008: -21.1pp · 2024: -48.5pp
- All cycles
- 2024: R+48.5 2020: R+44.4 2016: R+43.8 2012: R+29.1 2008: R+21.1
Not yet ingested
- Civics
- —
Market trends
- HPI YoY
- ▲ 14.31%
- Current HPI
- 339.482
- Rent YoY
- —
- Metro
- —
- State GDP YoY
- ▲ 1.81%
- F500 in state
- 4
Industry mix (Fortune 500 HQ in KY)
| Industry | F500 HQs | Revenue |
|---|---|---|
| Healthcare | 1 | $118B |
|
||
| Food / Beverage | 1 | $7B |
|
||
Price history
-14.4% since first listed6 events — show timeline
- 2026-05-18 Price Changed $320,000 ImagineMLS
- 2026-05-18 Price Changed $173,500 ImagineMLS
- 2026-04-02 Listed $180,000 ImagineMLS
- 2026-03-31 Price Changed $330,000 ImagineMLS
- 2026-03-16 Price Changed $347,600 ImagineMLS
- 2025-12-04 Listed $374,000 ImagineMLS
Cash-flow waterfall
monthlySold comps — $/sqft
last 12 mo · ≤1 miLoading sold comps…