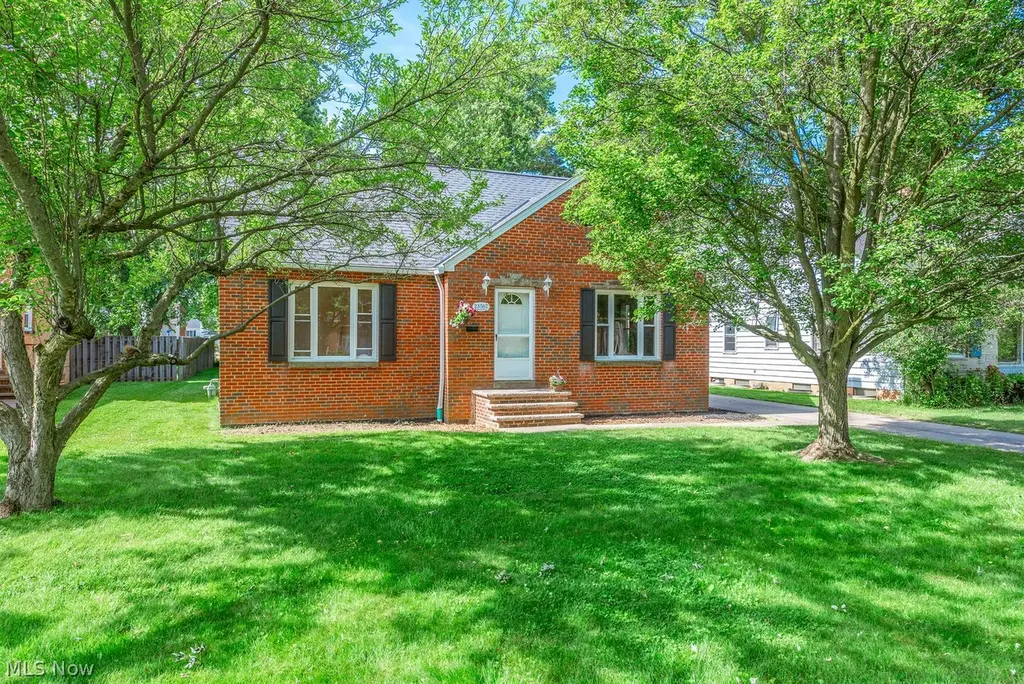
23567 Belmont Dr · Westlake, OH
Flood risk 1/10 · Minimal
- FEMA flood zone
- X (unshaded)
- Chance of flooding over 30 yrs
- 0.0%
- Est. flood insurance / yr
- $473 – $860
Fire risk 1/10 · Minimal
- Est. fire insurance / yr
- $713 – $1,323
Heat risk 3/10 · Minor
- Hot days now (above 95°F)
- 7 days/yr
- Hot days in 30 yrs
- 17 days/yr
Wind risk 1/10 · Minimal
- Chance of severe wind over 30 yrs
- —
Air-quality risk 2/10 · Minimal
- Unhealthy air days now
- 2 days/yr
- Unhealthy air days in 30 yrs
- 2 days/yr
Risk factors via First Street. Map © Google.
Why this score? — see what drove the C+ grade
The composite is a weighted blend of 9 inputs, each scored 0–100. Each bar is that input's sub-score; the figure is the points it added to the 100-point composite (weight × sub-score).
- Cash flow +19.7/30.0
- ARV discount +15.0/15.0
- Schools +6.6/10.0
- DSCR +6.2/10.0
- 1% rule +5.0/10.0
- Livability +4.1/5.0
- Rent growth +3.1/5.0
- Condition / age +2.5/5.0
- Appreciation +0.0/10.0
$280,000
🖨 Deal sheet (PDF) 📄 Offer letter ✓ Due diligence
Listing remarks
Ready for the next chapter! Original owner/family home that had loving care. Estate. Situated in a desirable, well-established neighborhood in eastern Westlake. Three bedroom, one bath all brick bungalow with newer windows, roof (2022), newer two car garage. Original hardwood floors in most of the house. Two wood-burning fireplaces. Glass block basement windows. Huge lower-level rec room. Waterproofing approximately 15 years ago. Wonderful y One block from Clague Park with its' exceptional pool complex. Minutes to Downtown or the Cleveland Hopkins Airport. Medical facilities nearby. Restaurants and shopping nearby.
Key facts
- 9,975 sq ft lot
- 2 garage spots
- Built 1951
Tags
Neighborhood map
What this means for you Summary
Snapshot
- This is a 3-bed/1.0-bath single-family listed at $280k.
Deal economics
- At list price, monthly cash flow is $327 ($4k/yr) — positive.
- The deal already cash-flows at list — no discount required.
- To meet the 1% rule (rent ≥ 1% of price), the offer needs to be $280k (0.1% below list).
- Recommended offer: $280k (0.1% below list) — sets the bar for 1% rule.
- Cap rate 7.7% vs local median 3.4% in Westlake — top-decile yield for the area; either an underpriced asset or a hidden risk that comps aren't pricing in. Stress-test before assuming the spread holds.
Location & tenants
- Location reads 82/100 on livability (#79 in OH, #1,202 nationally) — a professional / high-income tenant draw. Strengths: crime A+, employment A+, housing A+; Watch: amenities F, commute F.
- Westlake City (suburban): math 71% / reading 79% proficiency, ranked #76 of 656 in OH (top 12%) — strong family-tenant draw, lease renewals of 3-5y typical; only 15% free/reduced lunch — higher-income household profile.
- Zoned schools: Westlake Elementary School (math 80% / reading 75%, grade A, #213 of 1,584 statewide, top 14%, 1,217 students, 15% FRL); Lee Burneson Middle School (math 75% / reading 83%, grade A+, #54 of 654 statewide, top 9%, 498 students, 16% FRL); Westlake High School (math 56% / reading 81%, grade B, #130 of 781 statewide, top 17%, 1,066 students, 15% FRL) — zoned schools at 16% FRL track the district average.
- Market conditions: Rents rising (+2.3%/yr); 166 active listings in the ZIP; 6 comparable units currently listed for rent nearby; rentals at typical pace (median 21d on market — plan ~3-4 weeks tenant-placement turnaround); high-income renter base; 1,441 units permitted in Cuyahoga County in 2024 (700 in 5+ unit buildings).
Forward outlook
- Local home prices are declining (-3.0%/yr); year-one equity from $2k of loan paydown is wiped out by about $8k of value loss. Plan a longer hold.
- Cuyahoga County population projected to shrink 8% by 2050 — rents likely to lag national; underwrite the cash flow, not the appreciation.
Negotiation context
- Only 5 days on market — expect competitive offers; lowballing is unlikely to land.
Risks & watch-outs
- Watch-outs: built in 1951 — expect roof / HVAC / electrical / plumbing capex.
Questions for the listing agent
- Built in 1951 — when were the roof, HVAC, electrical panel, plumbing, and water heater last replaced?
- Is there a deadline driving the sale (1031 exchange, divorce, estate, relocation)? That informs how much negotiation room exists.
- Schools are A-rated — typically a magnet for longer-tenancy family renters. What's the average tenant stay here, and is there a school-zone premium baked into asking?
- What's the average days-on-market for RENTAL listings here right now (not sales)? A rising rental-DOM trend means longer vacancies and softer asking-rent achievability than the comps imply.
- What's the recent tenant-quality profile in this submarket — average credit score on applications, eviction rate, late-payment / NSF rate, and stable-employment percentage? A property-management company in the area should have these aggregated.
- How much new for-sale + rental construction is in the pipeline within 1–3 miles? Heavy new supply typically softens prices + rents 12–24 months out; constrained supply supports both.
Investment metrics
- 1% rule
- 1.00% ✗
- Cap rate
- 7.70%
- Cash-on-cash
- 5.01%
- DSCR
- 1.22
- GRM
- 8.3
CMA / ARV
- ARV (on-the-fly)
- $355,920
- Comps found
- 12
Show comp detail 12 sales within ~0.75 mi
| Address | Dist | Beds/Ba | Sqft | Sold | Price | $/sf | Match |
|---|---|---|---|---|---|---|---|
| 23380 Belmont Dr | 0.12mi | 3/1.5 | 1,456 (-2%) | 1mo | $430,000 | $295 | 88 |
| 23588 Belmont Dr | 0.04mi | 3/1.5 | 1,414 (-5%) | 7mo | $415,000 | $293 | 83 |
| 1301 Clague Rd | 0.06mi | 3/3.0 | 1,656 (+12%) | 7mo | $355,000 | $214 | 64 |
| 23322 Belmont Dr | 0.14mi | 3/3.0 | 1,347 (-9%) | 8mo | $315,000 | $234 | 64 |
| 1671 Westhill Blvd | 0.68mi | 3/1.5 | 1,461 (-2%) | 2mo | $335,000 | $229 | 62 |
| 1071 Orchard Park Dr | 0.65mi | 3/2.0 | 1,356 (-9%) | 5mo | $300,000 | $221 | 47 |
| 861 Orchard Park Dr | 0.70mi | 4/2.0 (+1) | 1,580 (+6%) | 2mo | $360,000 | $228 | 46 |
| 24024 E Oakland Rd | 0.75mi | 3/1.5 | 1,263 (-15%) | 1mo | $330,000 | $261 | 38 |
| 1101 Orchard Park Dr | 0.65mi | 3/2.5 | 1,272 (-14%) | 4mo | $436,000 | $343 | 37 |
| 23903 Wolf Rd | 0.75mi | 3/2.0 | 1,322 (-11%) | 8mo | $405,000 | $306 | 36 |
| 22495 Berry Dr | 0.72mi | 2/2.0 (-1) | 1,320 (-11%) | 4mo | $316,500 | $240 | 36 |
| 23821 Bonny Bank Dr | 0.67mi | 3/2.5 | 1,275 (-14%) | 14mo | $305,000 | $239 | 28 |
Match score weights: distance 35% · size 25% · config 20% · recency 20%. Top-matched comps best support the ARV.
Projected returns pro-forma
-3.0% appreciation · 2.32% rent growth · sell at horizon
- IRR
- -9.3%
- Equity multiple
- 0.66×
- Total profit
- $-26,420
- Equity at exit
- $41,749
- IRR
- -0.7%
- Equity multiple
- 0.95×
- Total profit
- $-3,821
- Equity at exit
- $24,209
Cash invested: $78,400 (down + closing). Projections, not guarantees.
Landlord ↔ Tenant lean methodology
- Overall (STATE)
- 73 Landlord-Friendly
- State Ohio
- 73 Landlord-Friendly · R+6
- County
- — inherits STATE
- City
- — inherits STATE
ZIP-level market 44145
- Rents YoY
- 2.3%
- Active inventory
- 166
- Price-to-rent
- 8.3×
Monthly cashflow live
- Estimated rent
- $2,797 high interval (Pro) →
- Mortgage (P&I)
- −$1,468
- Tax from tax record
- −$297 /mo · $3,568/yr
- Insurance
- −$117
- HOA
- −$0
- Vacancy / Maint / Mgmt
- −$587
- Net cashflow
- $327
Break-even live
Sensitivity live
| Price | -10% $486 | -5% $407 | +0% $327 | +5% $248 | +10% $169 |
|---|---|---|---|---|---|
| Rent | -10% $106 | -5% $217 | +0% $327 | +5% $438 | +10% $548 |
| Rate | -1.0pp $468 | -0.5pp $398 | base $327 | +0.5pp $255 | +1.0pp $181 |
UW: 25.0% down · 7.5% · 30yr · 1.5% tax · 5.0% vac · 8.0% maint · 8.0% mgmt
Financing live
Cash to close
- Down payment
- $70,000
- Closing costs
- $8,400
- Reserves months
- —
- Total cash needed
- —
Loan-product check · same deal, 3 products live
Conventional
25% down · 7.5% · 30yr
- Down + closing
- —
- Monthly P&I
- —
- Monthly cashflow
- —
- DSCR
- —
- Eligible?
- —
Personal DTI + credit; lowest rate.
DSCR
20% down · 8.5% · 30yr
- Down + closing
- —
- Monthly P&I
- —
- Monthly cashflow
- —
- DSCR
- —
- Eligible?
- —
No personal income docs; deal must DSCR.
Hard money
10% down · 12.0% · 12mo
- Down + closing
- —
- Monthly P&I
- —
- Monthly cashflow
- —
- DSCR
- —
- Eligible?
- —
Short-term bridge; refi at stabilization.
Rent comps 6 comps
| Address | Beds | Baths | Sqft | Rent | $/sqft | DOM | Units | Dist |
|---|---|---|---|---|---|---|---|---|
| 24000 Knickerbocker Rd Bay Village, OH | 3.0 | 1.0 | 1800 | $1,950 | $1.08 | 45d | 1 | 0.66mi |
| 22603 Center Ridge Rd Rocky River, OH | 1.0–3.0 | 1.0–2.5 | 2190 | $6,295 | $2.87 | 3d | 23 | 1.01mi |
| 1278 Columbia Rd Westlake, OH | 4.0 | 3.0 | 1638 | $2,599 | $1.59 | 3d | 1 | 1.10mi |
| 1278 Columbia Rd Westlake, OH | 4.0 | 3.0 | 1638 | $2,500 | $1.53 | 21d | 1 | 1.10mi |
| 25885 Kensington Dr Westlake, OH | 1.0–2.0 | 1.5–2.5 | 1075 | $2,099 | $1.95 | 3d | 6 | 1.34mi |
| 25316 Conover Dr Bay Village, OH | 3.0 | 2.0 | 1550 | $2,300 | $1.48 | 45d | 1 | 1.38mi |
Listing history 5 events
-
2026-06-13statusdays on market $280,000 Pending 5 DOM
-
2026-06-09days on market $280,000 Active 3 DOM
-
2026-06-08days on market $280,000 Active 2 DOM
-
2026-06-07remarks 624-char remark
-
2026-06-07$280,000 Active 1 DOM
ⓘ Source: listings_history table (triggers on properties + properties_extension) + one-shot
backfill from property_details.listing_events for pre-trigger history.
Tax reassessment forecast OH · Partial reset (capped growth)
- Current annual tax
- $3,568 · $297/mo
- Projected year-2 tax
- $3,968 · $331/mo
- Expected delta
- +$400/yr (+$33/mo · 11.2%)
ⓘ Screening estimate from a state-policy table — verify with the county assessor before closing.
Climate risk First Street
- Flood 1/10 Low FEMA zone X (unshaded) · 0% chance over 30 yrs
- Wildfire 1/10 Low
- Heat 3/10 Moderate 7 d/yr ≥95°F today · 17 d/yr by 30 yrs out
- Wind 1/10 Low
- Air quality 2/10 Low 2 unhealthy d/yr today · 2 by 30 yrs out
Nearby sold comps map
Loading sold comps map…
Walkable amenities ~0.75 mi
Loading nearby amenities…
Taxation est. · year 1
- Rental income
- $33,563
- − Mortgage interest
- −$15,684
- − Property taxes
- −$3,568
- − Insurance
- −$1,400
- − Repairs & maintenance
- −$2,685
- − Management
- −$2,685
- − Depreciation
- −$8,145
- Taxable loss
- −$604
- Est. tax savings @ 24.0%
- +$145
- After-tax cash flow
- $4,072/yr
For passive investors: Depreciation is non-cash, so a rental often shows a tax loss while cash-flowing — sheltering income. Rental losses are passive: they offset passive income freely, and up to $25,000/yr can offset ordinary (W-2) income if you actively participate and your MAGI is under $100k (phasing out to $0 by $150k); unused losses carry forward. On sale, claimed depreciation is recaptured at up to 25%, and gains may owe capital-gains tax (a 1031 exchange can defer both). Figures are a year-1 estimate at your 24.0% rate — not tax advice; consult a CPA.
Schools (NCES district)
- District
- Westlake City
- NCES district ID
- 3904506
- Math proficiency
- 71% ▼ -12.00%
- Reading proficiency
- 79% ▼ -7.00%
- Median HH income
- $74,709
- Composite
- 65.85/100
- National rank
- #451
- State rank
- #76 of 656 in OH
Livability — Westlake
- Score
- 82/100
- State rank
- #79
- US rank
- #1202
Category grades
Schools grade is shown separately in the Schools card above.
Census & demographics
- Census place
- Westlake, OH
- County
- Cuyahoga County · 1,090,369 people
- City population
- 34,104
- Metro
- Cleveland-Elyria, OH
- Population (ZIP)
- 34,104
- Household income
- $112,200
- Rent vs Own
- Severe rent burden
- 690.0
Population outlook (Cuyahoga County) Hauer SSP2
- Today (2025)
- 1,244,621 people
- By 2030
- 1,230,093 · -1.2%
- By 2040
- 1,189,108 · -4.5%
- By 2050
- 1,145,706 · -7.9%
- By 2075
- 1,076,557 · -13.5%
- By 2100
- 978,987 · -21.3%
Race, ethnicity, and origin ACS 2023
- Neighborhood character
- Predominantly White (85%)
- Race & ethnicity
- White 85% Asian 7% Two or more races 5% Hispanic / Latino 4% Black 2%
- Common ancestry
- Romanian 7% Lithuanian 3% Subsaharan African 2%
- Foreign-born
- 13% · Canada, China, South Korea
- Languages at home
- 84% English-only · Arabic 5% Other Indo-European 4% Russian/Polish/Slavic 2%
Political lean MEDSL · Cuyahoga
- 2024 margin
- Solid D (+31.5) · D 65.4% · R 33.9%
- 2008→2024 swing
- -7.4pp toward R · 2008: 38.9pp · 2024: 31.5pp
- All cycles
- 2024: D+31.5 2020: D+34.1 2016: D+35.0 2012: D+38.7 2008: D+38.9
Not yet ingested
- Civics
- —
Market trends
- HPI YoY
- ▼ -191.97%
- Current HPI
- 202.4805
- Rent YoY
- ▲ 2.32%
- Metro
- Cleveland-Elyria, OH
- State GDP YoY
- ▲ 1.98%
- F500 in state
- 48
Industry mix (Fortune 500 HQ in OH)
| Industry | F500 HQs | Revenue |
|---|---|---|
| Insurance | 3 | $145B |
|
||
| Industrial Machinery | 3 | $49B |
|
||
| Financial Services | 3 | $24B |
|
||
| Consumer Goods | 2 | $93B |
|
||
| Aerospace / Defense | 2 | $47B |
|
||
| Utilities | 2 | $33B |
|
||
Price history
1 event — show timeline
- 2026-06-06 Listed $280,000 MLSNOW
Property tax history
+3.3%/yrLatest (2025): $3,568 · -1.4% YoY. Source: county tax records.
Cash-flow waterfall
monthlySold comps — $/sqft
last 12 mo · ≤1 miLoading sold comps…