 5-Plex
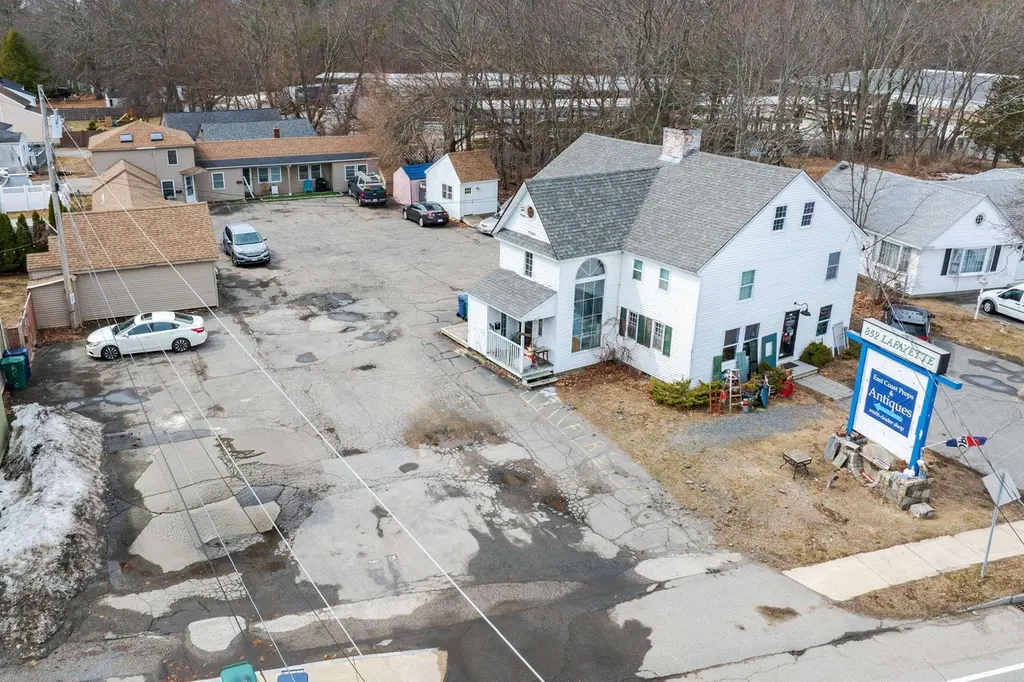
852 Lafayette Rd · Hampton, NH
Flood risk No data
- FEMA flood zone
- —
- Chance of flooding over 30 yrs
- —
- Est. flood insurance / yr
- —
Fire risk No data
- Est. fire insurance / yr
- —
Heat risk No data
- Hot days now (above threshold)
- —
- Hot days in 30 yrs
- —
Wind risk No data
- Chance of severe wind over 30 yrs
- —
Air-quality risk No data
- Unhealthy air days now
- —
- Unhealthy air days in 30 yrs
- —
Risk factors via First Street. Map © Google.
Why this score? — see what drove the C+ grade
The composite is a weighted blend of 9 inputs, each scored 0–100. Each bar is that input's sub-score; the figure is the points it added to the 100-point composite (weight × sub-score).
- Cash flow +25.7/30.0
- DSCR +8.6/10.0
- ARV discount +7.5/15.0
- 1% rule +6.8/10.0
- Schools +5.1/10.0
- Livability +4.0/5.0
- Rent growth +3.6/5.0
- Condition / age +2.5/5.0
- Appreciation +0.0/10.0
$989,900
🖨 Deal sheet 📄 Offer letter ✓ Due diligence
Multi-family units
County records classify this as Multi-Family (5+ Unit). Listing-text estimate: 5 units. confirmed
5+ unit building — per-unit beds/baths from public records are typically unavailable; the breakdown below (if shown) is an estimate from the listing text.
Listing remarks
Exceptional mixed-use opportunity in the heart of Hampton’s business district at 852 Lafayette Road. This well-located property features five units, including four residential apartments and one commercial space, offering strong income potential and versatility for investors or owner-operators. Positioned along a highly visible corridor with steady traffic flow, the property benefits from excellent exposure and accessibility. The residential units provide consistent rental demand, while the commercial space offers flexibility for a variety of business uses. Ample on-site parking and a convenient location near shopping, dining, and major routes enhance the appeal for both tenants and c
Key facts
- Excellent exposure
- Steady traffic flow
- 0.48 acre lot
Tags
Property features AI
Exterior
- Parking: Gravel driveway
- Utilities: Public water; Circuit breaker electrical system; Cable internet available / Cable at site
- Home design: Multi-unit property (5 units); Wood frame construction; Built in 1950
- Construction: Wood frame construction; Asphalt shingle roof; Built in 1950
- Exterior features: Level lot; Public sewer; Public road frontage (approximately 130 ft); Gravel driveway; Easements present
Interior
- Bedrooms: Five total units with three 2-bedroom units and one 3+ bedroom unit
- Heating & cooling: Natural gas heating; Electric heating
- Interior features: Modified architectural style; Existing structure; Tan exterior color
Neighborhood map
What this means for you Summary
Snapshot
- This is a 5 × 2-bed/1-bath units multifamily listed at $990k.
Deal economics
- At list price, monthly cash flow is $2k ($29k/yr) — positive. Per door: $476/mo.
- The deal already cash-flows at list — no discount required.
- Meets the 1% rule at list price ($12k rent vs $990k).
- Recommended offer: $931k (6.0% below list) — sets the bar for market timing.
- Cap rate 9.2% vs local median 1.7% in Hampton — top-decile yield for the area; either an underpriced asset or a hidden risk that comps aren't pricing in. Stress-test before assuming the spread holds.
Location & tenants
- Location reads 79/100 on livability (#19 in NH, #2,140 nationally) — a middle-class / working-renter tenant base. Strengths: schools A+, crime A+, employment A+; Watch: amenities D-, commute F, cost of living F.
- Hampton School District (suburban): math 49% / reading 66% proficiency, ranked #19 of 98 in NH (top 19%) — acceptable for families but not a draw, mixed tenant base, ~2y average lease; only 15% free/reduced lunch — higher-income household profile.
- Market conditions: Rents rising fast (+4.3%/yr); 113 active listings in the ZIP; solid renter incomes; 1,276 units permitted in Rockingham County in 2024 (593 in 5+ unit buildings).
- At $11,672/mo this rent would consume 147% of the median local household income ($95k/yr) (locally 544% of renters already pay >50% of income on rent) — very limited rent-growth headroom before tenants either downsize or default.
Forward outlook
- Local home prices are declining (-3.0%/yr); year-one equity from $7k of loan paydown is wiped out by about $30k of value loss. Plan a longer hold.
- At projected returns (-3.0% appreciation + 4.3% rent growth), your $277k cash investment doubles in ~9 years — after that, you're playing with house money.
Negotiation context
- It's been on market 73 days — a 6% lower offer ($931k) is reasonable based on typical stale-listing flexibility.
Risks & watch-outs
- Watch-outs: built in 1950 — expect roof / HVAC / electrical / plumbing capex.
Questions for the listing agent
- It's been on market 73 days. Have you received any prior offers? Is the seller open to a 6% concession, seller financing, or rate buy-down credit?
- Can we see the unit-by-unit rent roll, current vacancy, and any below-market leases? What's the average tenancy length?
- What capital expenditures (roof, boiler, parking lot, exteriors) have been made in the last 5 years, and what's planned in the next 2?
- Built in 1950 — when were the roof, HVAC, electrical panel, plumbing, and water heater last replaced?
- Why hasn't it sold? Are there any deal-killer items the seller is aware of (foundation, flood, title, zoning, code violations)?
- Is there a deadline driving the sale (1031 exchange, divorce, estate, relocation)? That informs how much negotiation room exists.
- Schools are A-rated — typically a magnet for longer-tenancy family renters. What's the average tenant stay here, and is there a school-zone premium baked into asking?
- What's the average days-on-market for RENTAL listings here right now (not sales)? A rising rental-DOM trend means longer vacancies and softer asking-rent achievability than the comps imply.
- What's the recent tenant-quality profile in this submarket — average credit score on applications, eviction rate, late-payment / NSF rate, and stable-employment percentage? A property-management company in the area should have these aggregated.
- How much new apartment / multifamily construction is in the pipeline within 1–3 miles? Heavy new supply (>2% of stock underway) typically softens rents 12–24 months out; light construction supports rent growth.
Investment metrics
- 1% rule
- 1.18% ✓
- Cap rate
- 9.18%
- Cash-on-cash
- 10.30%
- DSCR
- 1.46
- GRM
- 7.1
CMA / ARV
No comps found within radius.
Projected returns pro-forma
-3.0% appreciation · 4.35% rent growth · sell at horizon
- IRR
- 0.7%
- Equity multiple
- 1.03×
- Total profit
- $7,414
- Equity at exit
- $147,597
- IRR
- 11.7%
- Equity multiple
- 1.97×
- Total profit
- $270,122
- Equity at exit
- $85,588
Cash invested: $277,172 (down + closing). Projections, not guarantees.
Landlord ↔ Tenant lean methodology
- Overall (STATE)
- 56 Moderately Landlord-Leaning
- State New Hampshire
- 56 Moderately Landlord-Leaning · D+1
- County
- — inherits STATE
- City
- — inherits STATE
ZIP-level market 03842
- Rents YoY
- 4.3%
- Active inventory
- 113
- Price-to-rent
- 35.3×
Monthly cashflow live
- Estimated rent
- $11,672 medium interval (Pro) →
- Mortgage (P&I)
- −$5,191
- Tax est. 1.5%
- −$1,237 /mo · $14,848/yr
- Insurance
- −$412
- HOA
- −$0
- Vacancy / Maint / Mgmt
- −$2,451
- Net cashflow
- $2,380
Break-even live
5-unit breakdown (identical units grouped — click to expand)
| Units | Beds | Baths | Est. rent |
|---|---|---|---|
| 5× units | 2 | 1 | $11,670 |
| #1 | 2 | 1 | $2,334 |
| #2 | 2 | 1 | $2,334 |
| #3 | 2 | 1 | $2,334 |
| #4 | 2 | 1 | $2,334 |
| #5 | 2 | 1 | $2,334 |
| Total (5 units) | $11,672 | ||
UW: 25.0% down · 7.5% · 30yr · 1.5% tax · 5.0% vac · 8.0% maint · 8.0% mgmt
Financing live
Cash to close
- Down payment
- $247,475
- Closing costs
- $29,697
- Reserves months
- —
- Total cash needed
- —
Loan-product check · same deal, 3 products live
Conventional
25% down · 7.5% · 30yr
- Down + closing
- —
- Monthly P&I
- —
- Monthly cashflow
- —
- DSCR
- —
- Eligible?
- —
Personal DTI + credit; lowest rate.
DSCR
20% down · 8.5% · 30yr
- Down + closing
- —
- Monthly P&I
- —
- Monthly cashflow
- —
- DSCR
- —
- Eligible?
- —
No personal income docs; deal must DSCR.
Hard money
10% down · 12.0% · 12mo
- Down + closing
- —
- Monthly P&I
- —
- Monthly cashflow
- —
- DSCR
- —
- Eligible?
- —
Short-term bridge; refi at stabilization.
Listing history 14 events
-
2026-06-18days on market $989,900 Active 73 DOM
-
2026-06-17days on market $989,900 Active 72 DOM
-
2026-06-16days on market $989,900 Active 71 DOM
-
2026-06-15days on market $989,900 Active 70 DOM
-
2026-06-13days on market $989,900 Active 68 DOM
-
2026-06-09days on market $989,900 Active 64 DOM
-
2026-06-08days on market $989,900 Active 63 DOM
-
2026-06-07days on market $989,900 Active 62 DOM
-
2026-06-04days on market $989,900 Active 59 DOM
-
2026-06-03days on market $989,900 Active 58 DOM
-
2026-06-02days on market $989,900 Active 57 DOM
-
2026-06-01days on market $989,900 Active 56 DOM
-
2026-05-31days on market $989,900 Active 55 DOM
-
2026-04-06$989,900 Active
ⓘ Source: listings_history table (triggers on properties + properties_extension) + one-shot
backfill from property_details.listing_events for pre-trigger history.
Nearby sold comps map
Loading sold comps map…
Walkable amenities ~0.75 mi
Loading nearby amenities…
Taxation est. · year 1
- Rental income
- $140,064
- − Mortgage interest
- −$55,450
- − Property taxes
- −$14,848
- − Insurance
- −$4,950
- − Repairs & maintenance
- −$11,205
- − Management
- −$11,205
- − Depreciation
- −$28,797
- Taxable income
- $13,609
- Est. tax owed @ 24.0%
- −$3,266
- After-tax cash flow
- $25,293/yr
For passive investors: Depreciation is non-cash, so a rental often shows a tax loss while cash-flowing — sheltering income. Rental losses are passive: they offset passive income freely, and up to $25,000/yr can offset ordinary (W-2) income if you actively participate and your MAGI is under $100k (phasing out to $0 by $150k); unused losses carry forward. On sale, claimed depreciation is recaptured at up to 25%, and gains may owe capital-gains tax (a 1031 exchange can defer both). Figures are a year-1 estimate at your 24.0% rate — not tax advice; consult a CPA.
Schools (NCES district)
- District
- Hampton School District
- NCES district ID
- 3303510
- Math proficiency
- 49% ▼ -22.00%
- Reading proficiency
- 66% ▼ -9.00%
- Median HH income
- $71,924
- Composite
- 51.03/100
- National rank
- #1774
- State rank
- #19 of 98 in NH
Livability — Hampton
- Score
- 79/100
- State rank
- #19
- US rank
- #2140
Category grades
Schools grade is shown separately in the Schools card above.
Census & demographics
- Census place
- Hampton, NH
- County
- Rockingham County · 137,526 people
- City population
- 16,324
- Metro
- Boston-Cambridge-Newton, MA-NH
- Population (ZIP)
- 16,324
- Household income
- $95,422
- Rent vs Own
- Severe rent burden
- 544.0
Population outlook (Rockingham County) Hauer SSP2
- Today (2025)
- 316,118 people
- By 2030
- 320,929 · +1.5%
- By 2040
- 323,358 · +2.3%
- By 2050
- 314,977 · -0.4%
- By 2075
- 297,686 · -5.8%
- By 2100
- 256,363 · -18.9%
Race, ethnicity, and origin ACS 2023
- Neighborhood character
- Predominantly White (95%)
- Race & ethnicity
- White 95% Two or more races 2% Hispanic / Latino 1% Asian 1%
- Common ancestry
- Lithuanian 10% Romanian 6% Slovak 4%
- Foreign-born
- 3% · Canada
- Languages at home
- 97% English-only · Spanish 1%
Political lean MEDSL · Rockingham
- 2024 margin
- Toss-up / Even · D 48.3% · R 50.8%
- 2008→2024 swing
- -3.5pp toward R · 2008: 1.1pp · 2024: -2.4pp
- All cycles
- 2024: R+2.4 2020: D+2.1 2016: R+5.8 2012: R+4.5 2008: D+1.1
Not yet ingested
- Civics
- —
Market trends
- HPI YoY
- ▼ -219.75%
- Current HPI
- 339.3943
- Rent YoY
- ▲ 4.35%
- Metro
- Boston-Cambridge-Newton, MA-NH
- State GDP YoY
- —
- F500 in state
- 0
Price history
1 event — show timeline
- 2026-04-06 Listed $989,900 PrimeMLS
Cash-flow waterfall
monthlySold comps — $/sqft
last 12 mo · ≤1 miLoading sold comps…