 Triplex
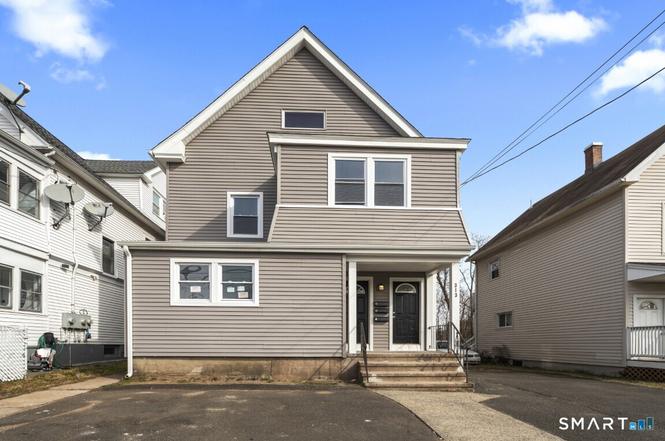
313 Washington Ave · West Haven, CT
Flood risk No data
- FEMA flood zone
- —
- Chance of flooding over 30 yrs
- —
- Est. flood insurance / yr
- —
Fire risk No data
- Est. fire insurance / yr
- —
Heat risk No data
- Hot days now (above threshold)
- —
- Hot days in 30 yrs
- —
Wind risk No data
- Chance of severe wind over 30 yrs
- —
Air-quality risk No data
- Unhealthy air days now
- —
- Unhealthy air days in 30 yrs
- —
Risk factors via First Street. Map © Google.
Why this score? — see what drove the D+ grade
The composite is a weighted blend of 9 inputs, each scored 0–100. Each bar is that input's sub-score; the figure is the points it added to the 100-point composite (weight × sub-score).
- Cash flow +21.8/30.0
- DSCR +7.0/10.0
- 1% rule +5.3/10.0
- Livability +4.2/5.0
- Rent growth +3.5/5.0
- Schools +2.8/10.0
- Condition / age +2.5/5.0
- ARV discount +0.0/15.0
- Appreciation +0.0/10.0
$649,000
🖨 Deal sheet 📄 Offer letter ✓ Due diligence
Multi-family units
County records classify this as Multi-Family (2-4 Unit). Listing-text estimate: 3 units. confirmed
Listing remarks MLS
HIGHEST AND BEST DUE TUESDAY JANUARY 31 BY 12:00PM Three Family with convenient location. Close to shops, as well as all major forms of transportation and in close proximity to major highways. This home needs a lot of work but has tons of potential as an income producing property or to live in one unit and rent out the other two units. With the right vision this can be an amazing house once again.
Key facts
- Fully renovated
- Short drive to yale
- Hardwood floors
Tags
Property features AI
Finance
- Financial info: Assessed value listed
Exterior
- Utilities: Public water connected; Public sewer connected; Electric and natural gas for heating fuel
- Home design: Multi-family property (3-family); Multi-family for sale
- Construction: Frame construction; Brick and stone foundation; Asphalt shingle roof; Vinyl siding
- Exterior features: Gutters; Garden area; Exterior lighting; Level lot
Interior
- Kitchen: No specific kitchen appliance details provided
- Bedrooms: 9 bedrooms (total)
- Bathrooms: 3 full bathrooms
- Heating & cooling: Baseboard heating; Hot air heating; Hot water system (other)
- Interior features: Total of 12 rooms; Full unfinished basement; Finished walk-up attic
- Laundry & utility: Coin‑operated laundry
Neighborhood map
What this means for you Summary
Snapshot
- This is a 3 × 3-bed/1.0-bath units multifamily listed at $649k.
Deal economics
- At list price, monthly cash flow is $1k ($12k/yr) — positive. Per door: $336/mo.
- The deal already cash-flows at list — no discount required.
- Meets the 1% rule at list price ($7k rent vs $649k).
- Cap rate 8.2% vs local median 4.3% in West Haven — top-decile yield for the area; either an underpriced asset or a hidden risk that comps aren't pricing in. Stress-test before assuming the spread holds.
Location & tenants
- Location reads 83/100 on livability (#6 in CT, #915 nationally) — a professional / high-income tenant draw. Strengths: commute A+, housing A+, health & safety A+; Watch: amenities D.
- West Haven School District (suburban): math 26% / reading 38% proficiency, ranked #121 of 153 in CT (top 79%) — families likely to look elsewhere, expect single-tenant / working-renter base with shorter leases.
- Zoned schools: West Haven High School (math 23% / reading 39%, grade F, #135 of 194 statewide, top 70%, 1,780 students, 53% FRL) — zoned schools at 53% FRL track the district average.
- Market conditions: Rents rising (+3.9%/yr); 146 active listings in the ZIP; 1 comparable units currently listed for rent nearby; 1,059 units permitted in South Central Connecticut Planning Region in 2024 (779 in 5+ unit buildings).
- At $6,662/mo this rent would consume 107% of the median local household income ($74k/yr) (locally 2671% of renters already pay >50% of income on rent) — very limited rent-growth headroom before tenants either downsize or default.
Forward outlook
- Local home prices are declining (-3.0%/yr); year-one equity from $4k of loan paydown is wiped out by about $19k of value loss. Plan a longer hold.
Negotiation context
- Only 2 days on market — expect competitive offers; lowballing is unlikely to land.
- 2 sale attempts since 3y ago with the ask held roughly flat each time — persistent listings suggest the price (not the market) is what's stuck; bring a comps-based counter.
- Current owner paid $210k; list at $649k implies a 209% gain — meaningful room to come down on a strong offer.
Risks & watch-outs
- Watch-outs: built in 1920 — expect roof / HVAC / electrical / plumbing capex.
Questions for the listing agent
- Can we see the unit-by-unit rent roll, current vacancy, and any below-market leases? What's the average tenancy length?
- What capital expenditures (roof, boiler, parking lot, exteriors) have been made in the last 5 years, and what's planned in the next 2?
- Built in 1920 — when were the roof, HVAC, electrical panel, plumbing, and water heater last replaced?
- Is there a deadline driving the sale (1031 exchange, divorce, estate, relocation)? That informs how much negotiation room exists.
- Schools are D-rated, which usually means shorter tenancies and higher turnover. Who's the typical renter profile here, and what's been the actual vacancy rate?
- The area grade is low — what's the realistic commute time and amenity access for the typical tenant pool here? Any planned neighborhood developments (good or bad) we should know about?
- What's the average days-on-market for RENTAL listings here right now (not sales)? A rising rental-DOM trend means longer vacancies and softer asking-rent achievability than the comps imply.
- What's the recent tenant-quality profile in this submarket — average credit score on applications, eviction rate, late-payment / NSF rate, and stable-employment percentage? A property-management company in the area should have these aggregated.
- How much new apartment / multifamily construction is in the pipeline within 1–3 miles? Heavy new supply (>2% of stock underway) typically softens rents 12–24 months out; light construction supports rent growth.
Investment metrics
- 1% rule
- 1.03% ✓
- Cap rate
- 8.16%
- Cash-on-cash
- 6.66%
- DSCR
- 1.30
- GRM
- 8.1
CMA / ARV
- ARV (on-the-fly)
- $554,961
- Comps found
- 12
Show comp detail 12 sales within ~0.75 mi
| Address | Dist | Beds/Ba | Sqft | Sold | Price | $/sf | Match |
|---|---|---|---|---|---|---|---|
| 626 Savin Ave | 0.33mi | 5/3.0 (-1) | 2,840 (+3%) | 7mo | $560,000 | $197 | 69 |
| 222-224 Washington Ave | 0.19mi | 5/4.0 (-1) | 2,962 (+7%) | 2mo | $630,000 | $213 | 68 |
| 327 Center St | 0.53mi | 6/4.0 | 2,683 (-3%) | 2mo | $450,000 | $168 | 65 |
| 8 Prospect Pl | 0.67mi | 5/3.0 (-1) | 2,729 (-1%) | 2mo | $629,900 | $231 | 60 |
| 201 Center St | 0.54mi | 6/4.0 | 2,710 (-2%) | 10mo | $560,000 | $207 | 60 |
| 440 Third Ave | 0.43mi | 6/3.0 | 2,482 (-10%) | 9mo | $500,000 | $201 | 56 |
| 100 Union Ave | 0.29mi | 7/3.0 (+1) | 3,084 (+12%) | 8mo | $570,000 | $185 | 56 |
| 9 Bayview Pl | 0.71mi | 6/4.0 | 2,796 (+1%) | 9mo | $875,000 | $313 | 54 |
| 248 Elm St | 0.64mi | 5/3.0 (-1) | 2,851 (+3%) | 9mo | $460,000 | $161 | 52 |
| 126 Richards Pl | 0.59mi | 6/3.0 | 3,098 (+12%) | 1mo | $420,000 | $136 | 51 |
| 3 Bayview Pl | 0.69mi | 7/3.0 (+1) | 2,508 (-9%) | 7mo | $770,000 | $307 | 41 |
| 634 Washington Ave | 0.61mi | 5/3.0 (-1) | 3,052 (+10%) | 10mo | $465,000 | $152 | 40 |
Match score weights: distance 35% · size 25% · config 20% · recency 20%. Top-matched comps best support the ARV.
Projected returns pro-forma
-3.0% appreciation · 3.9% rent growth · sell at horizon
- IRR
- -5.1%
- Equity multiple
- 0.81×
- Total profit
- $-34,854
- Equity at exit
- $96,768
- IRR
- 5.6%
- Equity multiple
- 1.43×
- Total profit
- $77,673
- Equity at exit
- $56,114
Cash invested: $181,720 (down + closing). Projections, not guarantees.
Landlord ↔ Tenant lean methodology
- Overall (STATE)
- 27 Tenant-Leaning
- State Connecticut
- 27 Tenant-Leaning · D+7
- County
- — inherits STATE
- City
- — inherits STATE
ZIP-level market 06516
- Rents YoY
- 3.9%
- Active inventory
- 146
- Price-to-rent
- 24.4×
Monthly cashflow live
- Estimated rent
- $6,662 high interval (Pro) →
- Mortgage (P&I)
- −$3,403
- Tax from tax record
- −$580 /mo · $6,961/yr
- Insurance
- −$270
- HOA
- −$0
- Vacancy / Maint / Mgmt
- −$1,399
- Net cashflow
- $1,009
Break-even live
3-unit breakdown (identical units grouped — click to expand)
| Units | Beds | Baths | Est. rent |
|---|---|---|---|
| 3× units | 3 | 1 | $6,663 |
| #1 | 3 | 1 | $2,221 |
| #2 | 3 | 1 | $2,221 |
| #3 | 3 | 1 | $2,221 |
| Total (3 units) | $6,662 | ||
UW: 25.0% down · 7.5% · 30yr · 1.5% tax · 5.0% vac · 8.0% maint · 8.0% mgmt
Financing live
Cash to close
- Down payment
- $162,250
- Closing costs
- $19,470
- Reserves months
- —
- Total cash needed
- —
Loan-product check · same deal, 3 products live
Conventional
25% down · 7.5% · 30yr
- Down + closing
- —
- Monthly P&I
- —
- Monthly cashflow
- —
- DSCR
- —
- Eligible?
- —
Personal DTI + credit; lowest rate.
DSCR
20% down · 8.5% · 30yr
- Down + closing
- —
- Monthly P&I
- —
- Monthly cashflow
- —
- DSCR
- —
- Eligible?
- —
No personal income docs; deal must DSCR.
Hard money
10% down · 12.0% · 12mo
- Down + closing
- —
- Monthly P&I
- —
- Monthly cashflow
- —
- DSCR
- —
- Eligible?
- —
Short-term bridge; refi at stabilization.
Rent comps 1 comps
| Address | Beds | Baths | Sqft | Rent | $/sqft | DOM | Units | Dist |
|---|---|---|---|---|---|---|---|---|
| 37 Center St Unit 2 West Haven, CT | 5.0 | 2.0 | 2500 | $3,300 | $1.32 | 2d | 1 | 0.78mi |
Listing history 3 events
-
2026-06-18days on market $649,000 Active 2 DOM
-
2026-06-16remarks 675-char remark
-
2026-06-16$649,000 Active 1 DOM
ⓘ Source: listings_history table (triggers on properties + properties_extension) + one-shot
backfill from property_details.listing_events for pre-trigger history.
Tax reassessment forecast CT · Partial reset (capped growth)
- Current annual tax
- $6,961 · $580/mo
- Projected year-2 tax
- $10,425 · $869/mo
- Expected delta
- +$3,464/yr (+$289/mo · 49.8%)
ⓘ Screening estimate from a state-policy table — verify with the county assessor before closing.
Nearby sold comps map
Loading sold comps map…
Walkable amenities ~0.75 mi
Loading nearby amenities…
Taxation est. · year 1
- Rental income
- $79,944
- − Mortgage interest
- −$36,354
- − Property taxes
- −$6,961
- − Insurance
- −$3,245
- − Repairs & maintenance
- −$6,396
- − Management
- −$6,396
- − Depreciation
- −$18,880
- Taxable income
- $1,713
- Est. tax owed @ 24.0%
- −$411
- After-tax cash flow
- $11,698/yr
For passive investors: Depreciation is non-cash, so a rental often shows a tax loss while cash-flowing — sheltering income. Rental losses are passive: they offset passive income freely, and up to $25,000/yr can offset ordinary (W-2) income if you actively participate and your MAGI is under $100k (phasing out to $0 by $150k); unused losses carry forward. On sale, claimed depreciation is recaptured at up to 25%, and gains may owe capital-gains tax (a 1031 exchange can defer both). Figures are a year-1 estimate at your 24.0% rate — not tax advice; consult a CPA.
Schools (NCES district)
- District
- West Haven School District
- NCES district ID
- 0904950
- Math proficiency
- 26% ▼ -13.00%
- Reading proficiency
- 38% ▼ -11.00%
- Median HH income
- $52,405
- Composite
- 28.05/100
- National rank
- #6840
- State rank
- #121 of 153 in CT
Livability — West Haven
- Score
- 83/100
- State rank
- #6
- US rank
- #915
Category grades
Schools grade is shown separately in the Schools card above.
Census & demographics
- Census place
- West Haven, CT
- County
- New Haven County · 688,236 people
- City population
- 55,351
- Metro
- New Haven-Milford, CT
- Population (ZIP)
- 55,351
- Household income
- $74,382
- Rent vs Own
- Severe rent burden
- 2671.0
Population outlook (South Central Connecticut County) Hauer SSP2
- By 2040
- 608,362
Race, ethnicity, and origin ACS 2023
- Neighborhood character
- Diverse neighborhood (Simpson 0.68)
- Race & ethnicity
- White 47% Hispanic / Latino 26% Black 18% Two or more races 10% Asian 5%
- Hispanic origin (detail)
- Mexican 3% Puerto Rican 11% Dominican 1%
- Common ancestry
- Romanian 4% Lithuanian 3% Russian 2%
- Foreign-born
- 21% · Canada, Jamaica, China
- Languages at home
- 70% English-only · Spanish 17% Other Indo-European 5% Arabic 3%
Political lean MEDSL · South Central Connecticut
- 2024 margin
- Strong D (+20.1) · D 59.0% · R 38.9% · Other 2.1%
- All cycles
- 2024: D+20.1
Not yet ingested
- Civics
- —
Market trends
- HPI YoY
- ▼ -312.86%
- Current HPI
- 307.0655
- Rent YoY
- ▲ 3.90%
- Metro
- New Haven-Milford, CT
- State GDP YoY
- ▲ 1.06%
- F500 in state
- 38
Industry mix (Fortune 500 HQ in CT)
| Industry | F500 HQs | Revenue |
|---|---|---|
| Industrial Machinery | 4 | $38B |
|
||
| Insurance | 3 | $71B |
|
||
| Financial Services | 2 | $25B |
|
||
| Transportation / Logistics | 2 | $18B |
|
||
| Healthcare | 1 | $247B |
|
||
| Telecommunications | 1 | $55B |
|
||
Price history
+332.7% since first listed6 events — show timeline
- 2026-06-16 Listed $649,000 Smart MLS
- 2023-03-14 Pending — Smart MLS
- 2023-03-10 Sold (MLS) $210,000 Smart MLS
- 2023-03-09 Sold (Public Records) $210,000 Public Records
- 2023-02-03 Contingent — Smart MLS
- 2023-01-26 Listed $150,000 Smart MLS
Property tax history
+1.6%/yrLatest (2023): $6,961 · +2.0% YoY. Source: county tax records.
Cash-flow waterfall
monthlySold comps — $/sqft
last 12 mo · ≤1 miLoading sold comps…