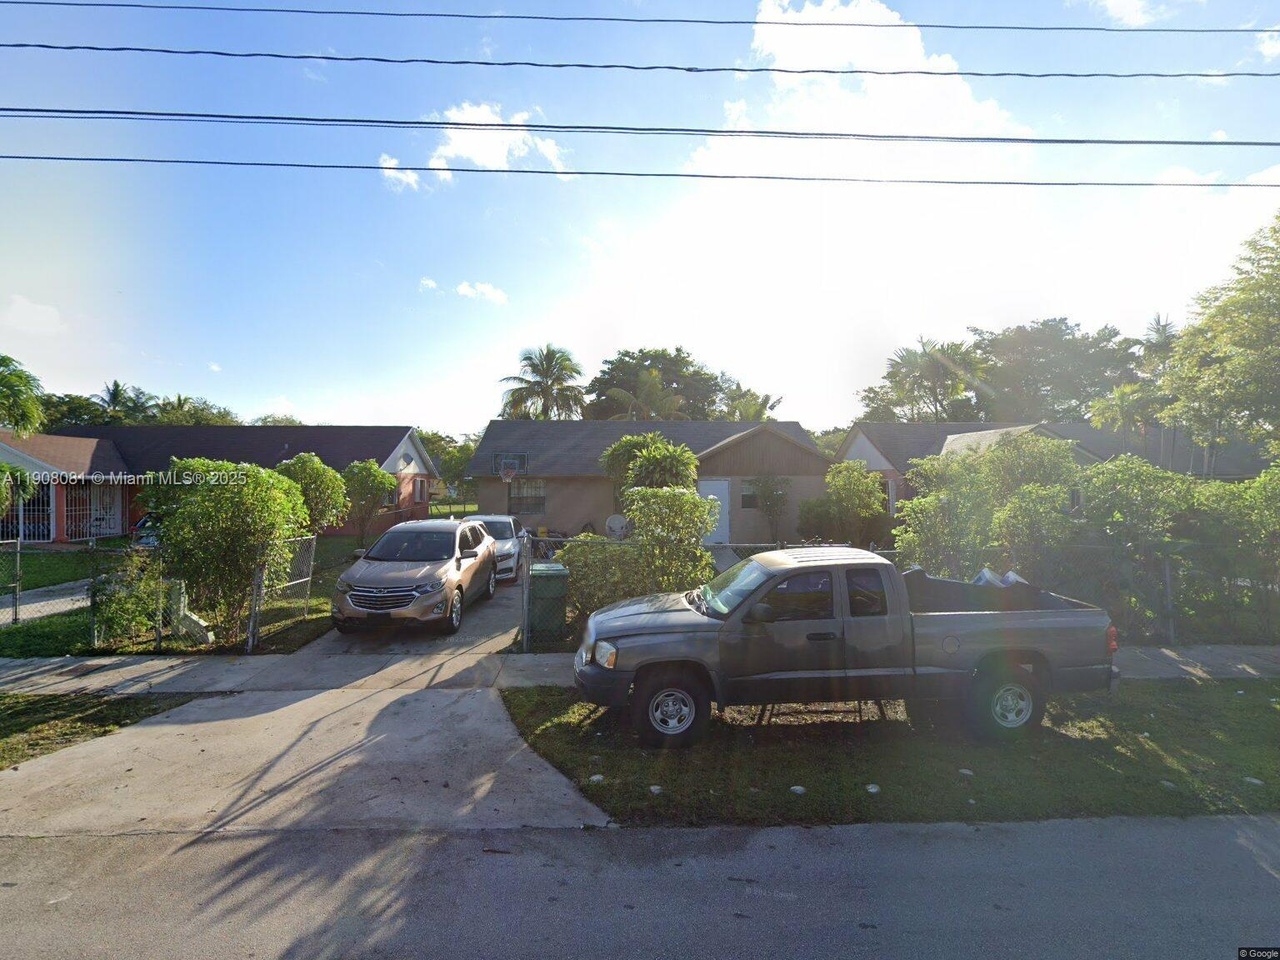
6101 NW 21st Ave · Brownsville, FL
Flood risk 1/10 · Minimal
- FEMA flood zone
- X (unshaded)
- Chance of flooding over 30 yrs
- 0.0%
- Est. flood insurance / yr
- $507 – $1,088
Fire risk 1/10 · Minimal
- Est. fire insurance / yr
- $947 – $1,759
Heat risk 10/10 · Severe
- Hot days now (above 104°F)
- 7 days/yr
- Hot days in 30 yrs
- 28 days/yr
Wind risk 10/10 · Severe
- Chance of severe wind over 30 yrs
- 99.0%
Air-quality risk 2/10 · Minimal
- Unhealthy air days now
- 1 days/yr
- Unhealthy air days in 30 yrs
- 1 days/yr
Risk factors via First Street. Map © Google.
Why this score? — see what drove the D+ grade
The composite is a weighted blend of 9 inputs, each scored 0–100. Each bar is that input's sub-score; the figure is the points it added to the 100-point composite (weight × sub-score).
- ARV discount +15.0/15.0
- Cash flow +14.3/30.0
- DSCR +4.3/10.0
- Schools +4.2/10.0
- Livability +3.8/5.0
- 1% rule +3.0/10.0
- Condition / age +2.5/5.0
- Rent growth +2.4/5.0
- Appreciation +0.0/10.0
$310,000
🖨 Deal sheet (PDF) 📄 Offer letter ✓ Due diligence
Listing remarks
3 Bed / 1 Bath Home — Prime Fixer Upper in Central Miami. This property is a builder’s playground! Sitting on a large lot, this 3-bedroom, 1-bath home offers endless potential to rebuild, expand, or add a pool. Perfect for investors, contractors, or visionaries looking to design their dream home in a sought-after central Miami location. PRICE IS FIRM. . NO OFFERS WILL BE ENTERTAINED IF LOWER THAN LISTED PRICE! INSPECTION MUST BE DONE PRIOR TO OFFER.
Key facts
- Large lot
- 7,089 sq ft lot
- 2 parking spots
Tags
Neighborhood map
What this means for you Summary
Snapshot
- This is a 3-bed/1.0-bath single-family listed at $310k.
Deal economics
- At list price, monthly cash flow is $56 ($671/yr) — positive.
- The deal already cash-flows at list — no discount required.
- To meet the 1% rule (rent ≥ 1% of price), the offer needs to be $247k (20.2% below list).
- Recommended offer: $247k (20.2% below list) — sets the bar for 1% rule.
Location & tenants
- Location reads 75/100 on livability (#246 in FL, #3,900 nationally) — a middle-class / working-renter tenant base. Strengths: commute A+, cost of living A+, health & safety B+; Watch: amenities F, employment F.
- Miami-Dade (suburban): math 45% / reading 54% proficiency, ranked #40 of 73 in FL (top 55%) — families likely to look elsewhere, expect single-tenant / working-renter base with shorter leases; 64% free/reduced lunch — lower-income household profile, screen leases tightly.
- Zoned schools: Charles R Drew K-8 Center (math 24% / reading 25%, grade F, #2,037 of 2,144 statewide, top 96%, 417 students, 82% FRL); Brownsville Middle School (math 13% / reading 19%, grade F, #565 of 571 statewide, top 99%, 487 students, 71% FRL); Miami Northwestern Senior High (math 11% / reading 27%, grade F, #565 of 667 statewide, top 85%, 1,429 students, 75% FRL).
- Zoned-school proficiency averages 20% at this address vs 50% district-wide (-30 pts) — the specific schools serving this property underperform the Miami-Dade average; the district grade overstates school quality for this exact location.
- Market conditions: Rents soft (-0.4%/yr); 271 active listings in the ZIP; lower-income renter base — watch delinquency; 10,051 units permitted in Miami-Dade County in 2024 (7,758 in 5+ unit buildings).
- At $2,473/mo this rent would consume 75% of the median local household income ($40k/yr) (locally 5748% of renters already pay >50% of income on rent) — very limited rent-growth headroom before tenants either downsize or default.
Forward outlook
- Local home prices are declining (-3.0%/yr); year-one equity from $2k of loan paydown is wiped out by about $9k of value loss. Plan a longer hold.
- Miami-Dade County population projected at +28% by 2050 — long-run rental-demand tailwind backs the buy-and-hold thesis.
Negotiation context
- It's been on market 123 days — a 12% lower offer ($273k) is reasonable based on typical stale-listing flexibility.
- 2 sale attempts; this cycle's ask has dropped $125k (29%) from the opening price — seller is motivated, your offer sets the floor, not the list.
- Current owner paid $69k; list at $310k implies a 351% gain — meaningful room to come down on a strong offer.
Risks & watch-outs
- Climate carrying-cost: severe wind risk, 99% chance of damaging wind over 30y; extreme-heat days projected 7→28/yr by 2055 (HVAC capex compounding) — expect insurance premiums to compound above CPI over the hold.
Questions for the listing agent
- It's been on market 123 days. Have you received any prior offers? Is the seller open to a 20% concession, seller financing, or rate buy-down credit?
- Why hasn't it sold? Are there any deal-killer items the seller is aware of (foundation, flood, title, zoning, code violations)?
- Is there a deadline driving the sale (1031 exchange, divorce, estate, relocation)? That informs how much negotiation room exists.
- Schools are A-rated — typically a magnet for longer-tenancy family renters. What's the average tenant stay here, and is there a school-zone premium baked into asking?
- The area grade is low — what's the realistic commute time and amenity access for the typical tenant pool here? Any planned neighborhood developments (good or bad) we should know about?
- What's the average days-on-market for RENTAL listings here right now (not sales)? A rising rental-DOM trend means longer vacancies and softer asking-rent achievability than the comps imply.
- What's the recent tenant-quality profile in this submarket — average credit score on applications, eviction rate, late-payment / NSF rate, and stable-employment percentage? A property-management company in the area should have these aggregated.
- How much new for-sale + rental construction is in the pipeline within 1–3 miles? Heavy new supply typically softens prices + rents 12–24 months out; constrained supply supports both.
Investment metrics
- 1% rule
- 0.80% ✗
- Cap rate
- 6.51%
- Cash-on-cash
- 0.77%
- DSCR
- 1.03
- GRM
- 10.4
CMA / ARV
- ARV (on-the-fly)
- $430,360
- Comps found
- 9
Show comp detail 9 sales within ~0.75 mi
| Address | Dist | Beds/Ba | Sqft | Sold | Price | $/sf | Match |
|---|---|---|---|---|---|---|---|
| 1950 NW 57th St | 0.26mi | 3/2.0 | 1,008 (-13%) | 3mo | $445,000 | $441 | 60 |
| 1420 NW 58th Ter | 0.61mi | 3/2.0 | 1,123 (-3%) | 6mo | $470,000 | $419 | 57 |
| 1491 NW 55th Ter | 0.61mi | 2/1.0 (-1) | 1,072 (-8%) | 2mo | $320,000 | $299 | 52 |
| 2116 NW 69th St | 0.42mi | 3/1.0 | 1,075 (-7%) | 24mo | $420,000 | $391 | 48 |
| 1531 NW 62nd Ter | 0.46mi | 4/1.0 (+1) | 1,323 (+14%) | 6mo | $300,000 | $227 | 45 |
| 1717 NW 70th St | 0.63mi | 3/2.0 | 1,300 (+12%) | 7mo | $475,000 | $365 | 41 |
| 1955 NW 51st Ter | 0.59mi | 4/2.0 (+1) | 1,268 (+9%) | 14mo | $470,000 | $371 | 36 |
| 1985 NW 49th St | 0.74mi | 3/2.0 | 1,318 (+14%) | 11mo | $402,500 | $305 | 30 |
| 7200 NW 19th Ave | 0.68mi | 3/2.0 | 1,051 (-9%) | 23mo | $420,000 | $400 | 30 |
Match score weights: distance 35% · size 25% · config 20% · recency 20%. Top-matched comps best support the ARV.
Projected returns pro-forma
-3.0% appreciation · 0.0% rent growth · sell at horizon
- IRR
- -18.2%
- Equity multiple
- 0.38×
- Total profit
- $-54,035
- Equity at exit
- $46,222
- IRR
- -16.8%
- Equity multiple
- 0.18×
- Total profit
- $-70,941
- Equity at exit
- $26,803
Cash invested: $86,800 (down + closing). Projections, not guarantees.
Landlord ↔ Tenant lean methodology
- Overall (STATE)
- 87 Strongly Landlord-Friendly
- State Florida
- 87 Strongly Landlord-Friendly · R+3
- County
- — inherits STATE
- City
- — inherits STATE
ZIP-level market 33142
- Home prices YoY
- -15.1%
- Rents YoY
- -0.4%
- Active inventory
- 271
- Price-to-rent
- 10.4×
Monthly cashflow live
- Estimated rent
- $2,473 medium interval (Pro) →
- Mortgage (P&I)
- −$1,626
- Tax from tax record
- −$143 /mo · $1,719/yr
- Insurance
- −$129
- HOA
- −$0
- Vacancy / Maint / Mgmt
- −$519
- Net cashflow
- $56
Break-even live
Sensitivity live
| Price | -10% $231 | -5% $144 | +0% $56 | +5% $-32 | +10% $-120 |
|---|---|---|---|---|---|
| Rent | -10% $-140 | -5% $-42 | +0% $56 | +5% $154 | +10% $251 |
| Rate | -1.0pp $212 | -0.5pp $135 | base $56 | +0.5pp $-24 | +1.0pp $-106 |
UW: 25.0% down · 7.5% · 30yr · 1.5% tax · 5.0% vac · 8.0% maint · 8.0% mgmt
Financing live
Cash to close
- Down payment
- $77,500
- Closing costs
- $9,300
- Reserves months
- —
- Total cash needed
- —
Loan-product check · same deal, 3 products live
Conventional
25% down · 7.5% · 30yr
- Down + closing
- —
- Monthly P&I
- —
- Monthly cashflow
- —
- DSCR
- —
- Eligible?
- —
Personal DTI + credit; lowest rate.
DSCR
20% down · 8.5% · 30yr
- Down + closing
- —
- Monthly P&I
- —
- Monthly cashflow
- —
- DSCR
- —
- Eligible?
- —
No personal income docs; deal must DSCR.
Hard money
10% down · 12.0% · 12mo
- Down + closing
- —
- Monthly P&I
- —
- Monthly cashflow
- —
- DSCR
- —
- Eligible?
- —
Short-term bridge; refi at stabilization.
Listing history 10 events
-
2026-04-13status Pending
-
2026-04-02status Active
-
2026-04-02price $310,000
-
2026-03-05historical Active Under Contract
-
2026-01-28status Pending
-
2026-01-28price $399,900
-
2025-11-04$435,000 Active
-
2001-01-26soldstatus $68,800
-
2000-09-21soldstatus $46,000
-
1994-10-07soldstatus $40,200
ⓘ Source: listings_history table (triggers on properties + properties_extension) + one-shot
backfill from property_details.listing_events for pre-trigger history.
Tax reassessment forecast FL · Resets to sale price
- Current annual tax
- $1,719 · $143/mo
- Projected year-2 tax
- $2,573 · $214/mo
- Expected delta
- +$854/yr (+$71/mo · 49.7%)
ⓘ Screening estimate from a state-policy table — verify with the county assessor before closing.
Climate risk First Street
- Flood 1/10 Low FEMA zone X (unshaded) · 0% chance over 30 yrs
- Wildfire 1/10 Low
- Heat 10/10 Extreme 7 d/yr ≥104°F today · 28 d/yr by 30 yrs out
- Wind 10/10 Extreme 99% chance of damaging wind over 30 yrs
- Air quality 2/10 Low 1 unhealthy d/yr today · 1 by 30 yrs out
Nearby sold comps map
Loading sold comps map…
Walkable amenities ~0.75 mi
Loading nearby amenities…
Taxation est. · year 1
- Rental income
- $29,680
- − Mortgage interest
- −$17,365
- − Property taxes
- −$1,719
- − Insurance
- −$1,550
- − Repairs & maintenance
- −$2,374
- − Management
- −$2,374
- − Depreciation
- −$9,018
- Taxable loss
- −$4,720
- Est. tax savings @ 24.0%
- +$1,133
- After-tax cash flow
- $1,803/yr
For passive investors: Depreciation is non-cash, so a rental often shows a tax loss while cash-flowing — sheltering income. Rental losses are passive: they offset passive income freely, and up to $25,000/yr can offset ordinary (W-2) income if you actively participate and your MAGI is under $100k (phasing out to $0 by $150k); unused losses carry forward. On sale, claimed depreciation is recaptured at up to 25%, and gains may owe capital-gains tax (a 1031 exchange can defer both). Figures are a year-1 estimate at your 24.0% rate — not tax advice; consult a CPA.
Schools (NCES district)
- District
- Miami-Dade
- NCES district ID
- 1200390
- Math proficiency
- 45% ▼ -16.00%
- Reading proficiency
- 54% ▼ -5.00%
- Median HH income
- $43,928
- Composite
- 41.76/100
- National rank
- #3397
- State rank
- #40 of 73 in FL
Livability — Brownsville
- Score
- 75/100
- State rank
- #246
- US rank
- #3900
Category grades
Schools grade is shown separately in the Schools card above.
Census & demographics
- Census place
- Brownsville, FL
- County
- Miami-Dade County · 2,697,751 people
- City population
- 58,908
- Metro
- Miami-Fort Lauderdale-Pompano Beach, FL
- Population (ZIP)
- 58,908
- Household income
- $39,608
- Rent vs Own
- Severe rent burden
- 5748.0
Population outlook (Miami-Dade County) Hauer SSP2
- Today (2025)
- 3,126,439 people
- By 2030
- 3,325,765 · +6.4%
- By 2040
- 3,697,561 · +18.3%
- By 2050
- 4,012,134 · +28.3%
- By 2075
- 4,605,612 · +47.3%
- By 2100
- 4,866,598 · +55.7%
Race, ethnicity, and origin ACS 2023
- Neighborhood character
- Predominantly Hispanic (68%)
- Race & ethnicity
- Hispanic / Latino 68% Two or more races 36% Black 28% White 3%
- Hispanic origin (detail)
- Mexican 2% Puerto Rican 3% Cuban 24% Dominican 7%
- Common ancestry
- Hispanic 2%
- Foreign-born
- 51% · Canada, Jamaica, Dominican Republic
- Languages at home
- 34% English-only · Spanish 64% French/Haitian/Cajun 1%
Political lean MEDSL · Miami-Dade
- 2024 margin
- R (+11.4) · D 43.9% · R 55.4%
- 2008→2024 swing
- -27.6pp toward R · 2008: 16.1pp · 2024: -11.4pp
- All cycles
- 2024: R+11.4 2020: D+7.3 2016: D+29.6 2012: D+23.7 2008: D+16.1
Not yet ingested
- Civics
- —
Market trends
- HPI YoY
- ▼ -102.31%
- Current HPI
- 574.9225
- Rent YoY
- ▼ -0.41%
- Metro
- Miami-Fort Lauderdale-Pompano Beach, FL
- State GDP YoY
- ▲ 3.28%
- F500 in state
- 36
Industry mix (Fortune 500 HQ in FL)
| Industry | F500 HQs | Revenue |
|---|---|---|
| Industrial Technology | 2 | $29B |
|
||
| Insurance | 2 | $17B |
|
||
| Retail | 1 | $60B |
|
||
| Technology Distribution | 1 | $58B |
|
||
| Homebuilding | 1 | $35B |
|
||
| Technology Manufacturing | 1 | $35B |
|
||
Price history
+671.1% since first listed10 events — show timeline
- 2026-04-13 Pending — MARMLS
- 2026-04-02 Relisted — MARMLS
- 2026-04-02 Price Changed $310,000 MARMLS
- 2026-03-05 Contingent — MARMLS
- 2026-01-28 Pending — MARMLS
- 2026-01-28 Price Changed $399,900 MARMLS
- 2025-11-04 Listed $435,000 MARMLS
- 2001-01-26 Sold (Public Records) $68,800 Public Records
- 2000-09-21 Sold (Public Records) $46,000 Public Records
- 1994-10-07 Sold (Public Records) $40,200 Public Records
Property tax history
+1.8%/yrLatest (2025): $1,719 · +2.7% YoY. Source: county tax records.
Cash-flow waterfall
monthlySold comps — $/sqft
last 12 mo · ≤1 miLoading sold comps…