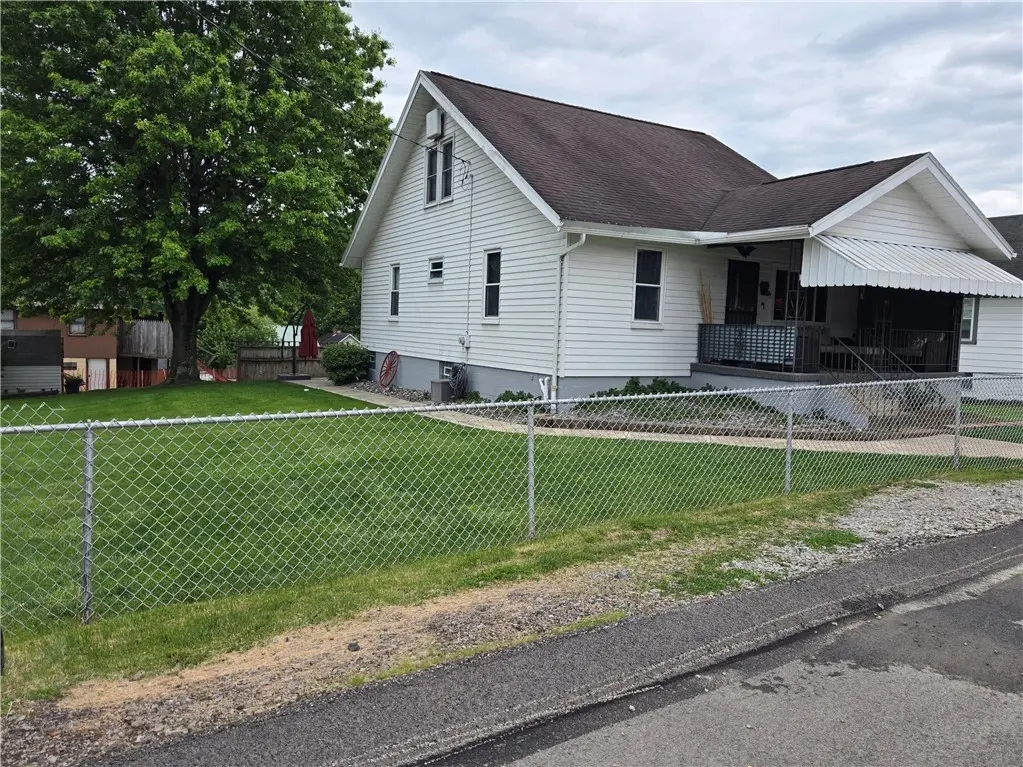
112 Fairview St · Elrama, PA
Flood risk 1/10 · Minimal
- FEMA flood zone
- X (unshaded)
- Chance of flooding over 30 yrs
- 0.0%
- Est. flood insurance / yr
- $473 – $860
Fire risk 1/10 · Minimal
- Est. fire insurance / yr
- $511 – $949
Heat risk 4/10 · Minor
- Hot days now (above 97°F)
- 7 days/yr
- Hot days in 30 yrs
- 19 days/yr
Wind risk 2/10 · Minimal
- Chance of severe wind over 30 yrs
- —
Air-quality risk 5/10 · Moderate
- Unhealthy air days now
- 8 days/yr
- Unhealthy air days in 30 yrs
- 8 days/yr
Risk factors via First Street. Map © Google.
Why this score? — see what drove the C grade
The composite is a weighted blend of 9 inputs, each scored 0–100. Each bar is that input's sub-score; the figure is the points it added to the 100-point composite (weight × sub-score).
- Cash flow +19.8/30.0
- ARV discount +15.0/15.0
- DSCR +6.3/10.0
- 1% rule +5.3/10.0
- Appreciation +3.1/10.0
- Livability +3.1/5.0
- Rent growth +2.5/5.0
- Condition / age +2.5/5.0
- Schools +2.4/10.0
$110,000
🖨 Deal sheet (PDF) 📄 Offer letter ✓ Due diligence
Listing remarks
Welcome home to this newly renovated, adorable ranch in a quiet neighborhood located in Elrama. You're greeted by your cozy living-room with a rustic/modern interior. Two bedrooms and one bathroom on the main floor, along with your homey kitchen that leads into the sunroom overlooking the spacious backyard and detached garage. The partially-finished basement comes equipped with a game room and laundry room, and plenty of room for storage. You don't have to wait for the perfect opportunity, it's right here!
Key facts
- Spacious backyard
- Sunroom
- Cozy living-room
Tags
Property features AI
Exterior
- Parking: Detached garage; On-street parking; Total of 1 parking space
- Utilities: Public water; Public sewer
- Home design: One-story home; Resale property; Asphalt roof
- Construction: Shingle/asphalt roof
- Exterior features: 75 x 100 lot dimensions
Interior
- Kitchen: Cooktop; Stove; Microwave; Refrigerator
- Bedrooms: Main-level bedroom (10 x 12)
- Flooring: Ceramic tile; Hardwood; Laminate
- Bathrooms: 1 full bathroom
- Heating & cooling: Gas heating; Central air conditioning
- Interior features: Finished basement with interior entry; 7 total rooms
- Laundry & utility: Basement laundry (9 x 5) with washer and dryer
Neighborhood map
What this means for you Summary
Snapshot
- This is a 2-bed/1.0-bath single-family listed at $110k.
Deal economics
- At list price, monthly cash flow is $131 ($2k/yr) — positive.
- The deal already cash-flows at list — no discount required.
- Meets the 1% rule at list price ($1k rent vs $110k).
Location & tenants
- Location reads 61/100 on livability (#1,385 in PA) — a middle-class / working-renter tenant base. Strengths: cost of living A+, employment B+, housing B+; Watch: crime C-, health & safety D, amenities F.
- Ringgold SD (suburban): math 19% / reading 36% proficiency, ranked #452 of 539 in PA (top 84%) — low school quality limits family demand, transient renter base, plan for 1-2y turnover.
- Zoned schools: Ringgold El Sch North (math 32% / reading 67%, grade D, #654 of 1,518 statewide, top 47%, 360 students, 100% FRL); Ringgold Ms (math 9% / reading 29%, grade F, #447 of 512 statewide, top 88%, 787 students, 100% FRL); Ringgold Shs (math 57% / reading 24%, grade F, #255 of 437 statewide, top 60%, 852 students, 82% FRL) — zoned schools average 94% FRL vs 41% district-wide (53 pts higher); higher-poverty schools than district average — tighter screening recommended.
- Market conditions: 3 active listings in the ZIP; 489 units permitted in Washington County in 2024 (30 in 5+ unit buildings).
Forward outlook
- Local home prices are declining (-3.0%/yr); year-one equity from $761 of loan paydown is wiped out by about $3k of value loss. Plan a longer hold.
- Washington County population projected to shrink 6% by 2050 — rents likely to lag national; underwrite the cash flow, not the appreciation.
Negotiation context
- Only 2 days on market — expect competitive offers; lowballing is unlikely to land.
Risks & watch-outs
- Watch-outs: built in 1919 — expect roof / HVAC / electrical / plumbing capex.
Questions for the listing agent
- Built in 1919 — when were the roof, HVAC, electrical panel, plumbing, and water heater last replaced?
- Is there a deadline driving the sale (1031 exchange, divorce, estate, relocation)? That informs how much negotiation room exists.
- Schools are D-rated, which usually means shorter tenancies and higher turnover. Who's the typical renter profile here, and what's been the actual vacancy rate?
- What's the average days-on-market for RENTAL listings here right now (not sales)? A rising rental-DOM trend means longer vacancies and softer asking-rent achievability than the comps imply.
- What's the recent tenant-quality profile in this submarket — average credit score on applications, eviction rate, late-payment / NSF rate, and stable-employment percentage? A property-management company in the area should have these aggregated.
- How much new for-sale + rental construction is in the pipeline within 1–3 miles? Heavy new supply typically softens prices + rents 12–24 months out; constrained supply supports both.
Investment metrics
- 1% rule
- 1.03% ✓
- Cap rate
- 7.72%
- Cash-on-cash
- 5.11%
- DSCR
- 1.23
- GRM
- 8.1
CMA / ARV
- ARV (on-the-fly)
- $138,600
- Comps found
- 2
Show comp detail 2 sales within ~0.75 mi
| Address | Dist | Beds/Ba | Sqft | Sold | Price | $/sf | Match |
|---|---|---|---|---|---|---|---|
| 1205 State St | 0.42mi | 3/1.0 (+1) | 1,560 (+1%) | 7mo | $140,000 | $90 | 67 |
| 29 Davidson Ave | 0.12mi | 3/2.0 (+1) | 1,376 (-11%) | 23mo | $70,000 | $51 | 49 |
Match score weights: distance 35% · size 25% · config 20% · recency 20%. Top-matched comps best support the ARV.
Projected returns pro-forma
-3.0% appreciation · 3.0% rent growth · sell at horizon
- IRR
- -8.3%
- Equity multiple
- 0.69×
- Total profit
- $-9,456
- Equity at exit
- $16,401
- IRR
- 1.2%
- Equity multiple
- 1.08×
- Total profit
- $2,595
- Equity at exit
- $9,511
Cash invested: $30,800 (down + closing). Projections, not guarantees.
Landlord ↔ Tenant lean methodology
- Overall (STATE)
- 62 Landlord-Friendly
- State Pennsylvania
- 62 Landlord-Friendly · EVEN
- County
- — inherits STATE
- City
- — inherits STATE
ZIP-level market 15038
- Home prices YoY
- -2.2%
- Active inventory
- 3
- Price-to-rent
- 8.1×
Monthly cashflow live
- Estimated rent
- $1,133 medium interval (Pro) →
- Mortgage (P&I)
- −$577
- Tax from tax record
- −$141 /mo · $1,695/yr
- Insurance
- −$46
- HOA
- −$0
- Vacancy / Maint / Mgmt
- −$238
- Net cashflow
- $131
Break-even live
Sensitivity live
| Price | -10% $193 | -5% $162 | +0% $131 | +5% $100 | +10% $69 |
|---|---|---|---|---|---|
| Rent | -10% $42 | -5% $86 | +0% $131 | +5% $176 | +10% $221 |
| Rate | -1.0pp $186 | -0.5pp $159 | base $131 | +0.5pp $103 | +1.0pp $74 |
UW: 25.0% down · 7.5% · 30yr · 1.5% tax · 5.0% vac · 8.0% maint · 8.0% mgmt
Financing live
Cash to close
- Down payment
- $27,500
- Closing costs
- $3,300
- Reserves months
- —
- Total cash needed
- —
Loan-product check · same deal, 3 products live
Conventional
25% down · 7.5% · 30yr
- Down + closing
- —
- Monthly P&I
- —
- Monthly cashflow
- —
- DSCR
- —
- Eligible?
- —
Personal DTI + credit; lowest rate.
DSCR
20% down · 8.5% · 30yr
- Down + closing
- —
- Monthly P&I
- —
- Monthly cashflow
- —
- DSCR
- —
- Eligible?
- —
No personal income docs; deal must DSCR.
Hard money
10% down · 12.0% · 12mo
- Down + closing
- —
- Monthly P&I
- —
- Monthly cashflow
- —
- DSCR
- —
- Eligible?
- —
Short-term bridge; refi at stabilization.
Listing history 2 events
-
2026-05-22status Pending
-
2026-05-19$110,000 Active
ⓘ Source: listings_history table (triggers on properties + properties_extension) + one-shot
backfill from property_details.listing_events for pre-trigger history.
Tax reassessment forecast PA · Partial reset (capped growth)
- Current annual tax
- $1,695 · $141/mo
- Projected year-2 tax
- $1,717 · $143/mo
- Expected delta
- +$21/yr (+$2/mo · 1.3%)
ⓘ Screening estimate from a state-policy table — verify with the county assessor before closing.
Climate risk First Street
- Flood 1/10 Low FEMA zone X (unshaded) · 0% chance over 30 yrs
- Wildfire 1/10 Low
- Heat 4/10 Moderate 7 d/yr ≥97°F today · 19 d/yr by 30 yrs out
- Wind 2/10 Low
- Air quality 5/10 Major 8 unhealthy d/yr today · 8 by 30 yrs out
Nearby sold comps map
Loading sold comps map…
Walkable amenities ~0.75 mi
Loading nearby amenities…
Taxation est. · year 1
- Rental income
- $13,596
- − Mortgage interest
- −$6,162
- − Property taxes
- −$1,695
- − Insurance
- −$550
- − Repairs & maintenance
- −$1,088
- − Management
- −$1,088
- − Depreciation
- −$3,200
- Taxable loss
- −$187
- Est. tax savings @ 24.0%
- +$45
- After-tax cash flow
- $1,618/yr
For passive investors: Depreciation is non-cash, so a rental often shows a tax loss while cash-flowing — sheltering income. Rental losses are passive: they offset passive income freely, and up to $25,000/yr can offset ordinary (W-2) income if you actively participate and your MAGI is under $100k (phasing out to $0 by $150k); unused losses carry forward. On sale, claimed depreciation is recaptured at up to 25%, and gains may owe capital-gains tax (a 1031 exchange can defer both). Figures are a year-1 estimate at your 24.0% rate — not tax advice; consult a CPA.
Schools (NCES district)
- District
- Ringgold SD
- NCES district ID
- 4220400
- Math proficiency
- 19% ▼ -20.00%
- Reading proficiency
- 36% ▼ -18.00%
- Median HH income
- $46,754
- Composite
- 23.75/100
- National rank
- #7819
- State rank
- #452 of 539 in PA
Livability — Elrama
- Score
- 61/100
- State rank
- #1385
- US rank
- #17450
Category grades
Schools grade is shown separately in the Schools card above.
Census & demographics
- Census place
- Elrama, PA
- City population
- 268
- Population (ZIP)
- 268
Population outlook (Washington County) Hauer SSP2
- Today (2025)
- 208,060 people
- By 2030
- 207,168 · -0.4%
- By 2040
- 202,738 · -2.6%
- By 2050
- 195,269 · -6.1%
- By 2075
- 175,588 · -15.6%
- By 2100
- 145,827 · -29.9%
Race, ethnicity, and origin ACS 2023
- Neighborhood character
- Predominantly White (100%)
- Race & ethnicity
- White 100%
Political lean MEDSL · Washington
- 2024 margin
- Strong R (+25.5) · D 36.9% · R 62.4%
- 2008→2024 swing
- -20.8pp toward R · 2008: -4.7pp · 2024: -25.5pp
- All cycles
- 2024: R+25.5 2020: R+22.8 2016: R+25.3 2012: R+13.3 2008: R+4.7
Not yet ingested
- Civics
- —
Market trends
- HPI YoY
- ▼ -3.83%
- Current HPI
- 167.1822
- Rent YoY
- —
- Metro
- —
- State GDP YoY
- ▲ 1.68%
- F500 in state
- 34
Industry mix (Fortune 500 HQ in PA)
| Industry | F500 HQs | Revenue |
|---|---|---|
| Healthcare | 2 | $309B |
|
||
| Insurance | 2 | $27B |
|
||
| Telecommunications / Media | 1 | $124B |
|
||
| Industrial Distribution | 1 | $22B |
|
||
| Financial Services | 1 | $20B |
|
||
| Chemicals / Materials | 1 | $18B |
|
||
Price history
2 events — show timeline
- 2026-05-22 Pending — West Penn MLS
- 2026-05-19 Listed $110,000 West Penn MLS
Property tax history
+3.4%/yrLatest (2026): $1,695 · +3.9% YoY. Source: county tax records.
Cash-flow waterfall
monthlySold comps — $/sqft
last 12 mo · ≤1 miLoading sold comps…