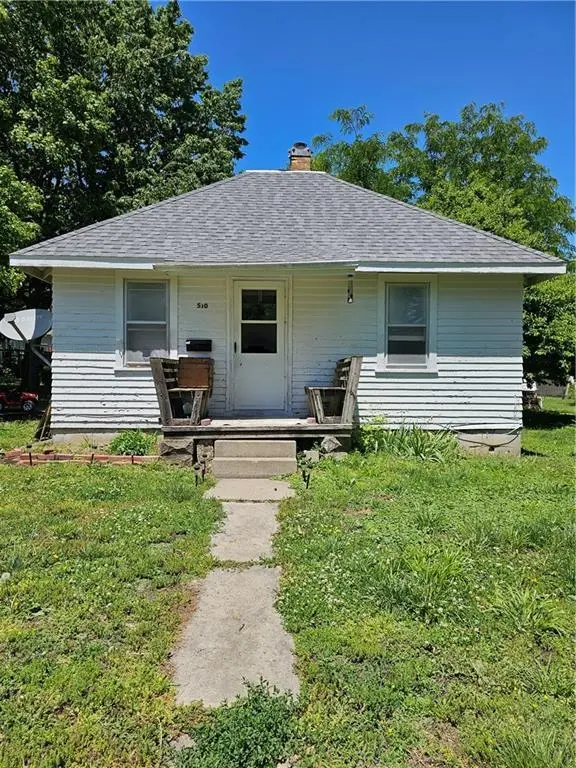
510 Pottawatomie St · Hiawatha, KS
Flood risk 1/10 · Minimal
- FEMA flood zone
- X (unshaded)
- Chance of flooding over 30 yrs
- 0.0%
- Est. flood insurance / yr
- $507 – $1,088
Fire risk 2/10 · Minimal
- Est. fire insurance / yr
- $1,154 – $2,142
Heat risk 3/10 · Minor
- Hot days now (above 107°F)
- 7 days/yr
- Hot days in 30 yrs
- 16 days/yr
Wind risk 2/10 · Minimal
- Chance of severe wind over 30 yrs
- —
Air-quality risk 2/10 · Minimal
- Unhealthy air days now
- 0 days/yr
- Unhealthy air days in 30 yrs
- 1 days/yr
Risk factors via First Street. Map © Google.
Why this score? — see what drove the B grade
The composite is a weighted blend of 9 inputs, each scored 0–100. Each bar is that input's sub-score; the figure is the points it added to the 100-point composite (weight × sub-score).
- Cash flow +29.7/30.0
- ARV discount +15.0/15.0
- DSCR +10.0/10.0
- 1% rule +7.6/10.0
- Livability +3.7/5.0
- Rent growth +2.5/5.0
- Schools +2.5/10.0
- Condition / age +2.5/5.0
- Appreciation +0.0/10.0
$65,000
🖨 Deal sheet (PDF) 📄 Offer letter ✓ Due diligence
Key facts
- 4,356 sq ft lot
- Garage
- Built 1910
Property features AI
Finance
- Other: Living area reported as 745 (source: public records); Property age reported as 101 years or more
- Financial info: Annual tax noted (information provided by listing)
- HOA & community: No association fees; No community-provided maintenance
Exterior
- Parking: Detached garage with garage door facing the front; 1 garage space
- Utilities: Public water; Public sewer
- Home design: Single-family residence; Residential property; Bungalow style; One story (main level living)
- Construction: Frame construction with shingle siding; Shake roof
- Exterior features: Lot approximately 4,356 square feet; Not in a flood plain
Interior
- Kitchen: Kitchen with linoleum flooring
- Bedrooms: 2 bedrooms on the main level
- Flooring: Carpet in living, dining, and bedrooms; Linoleum in kitchen and bathroom
- Bathrooms: 1 full bathroom on the main level
- Heating & cooling: Electric heating; Window air conditioning units and electric cooling
- Interior features: Bungalow floor plan; Crawl space basement
Neighborhood map
What this means for you Summary
Snapshot
- This is a 2-bed/1.0-bath single-family listed at $65k.
Deal economics
- At list price, monthly cash flow is $237 ($3k/yr) — positive.
- The deal already cash-flows at list — no discount required.
- Meets the 1% rule at list price ($817 rent vs $65k).
- Recommended offer: $64k (1.5% below list) — sets the bar for market timing.
Location & tenants
- Location reads 74/100 on livability (#90 in KS, #4,934 nationally) — a middle-class / working-renter tenant base. Strengths: cost of living A+, health & safety A+, housing A-; Watch: schools D, crime D-, commute F.
- Hiawatha (town): math 26% / reading 32% proficiency, ranked #112 of 169 in KS (top 66%) — low school quality limits family demand, transient renter base, plan for 1-2y turnover.
- Market conditions: 32 active listings in the ZIP; 2 units permitted in Brown County in 2024 (0 in 5+ unit buildings).
Forward outlook
- Local home prices are declining (-3.0%/yr); year-one equity from $449 of loan paydown is wiped out by about $2k of value loss. Plan a longer hold.
- Brown County population projected at -12% by 2050 — secular population decline; favor cash flow + early exit over multi-decade hold.
- At projected returns (-3.0% appreciation + 3.0% rent growth), your $18k cash investment doubles in ~8 years — after that, you're playing with house money.
Negotiation context
- It's been on market 28 days — a 2% lower offer ($64k) is reasonable based on typical stale-listing flexibility.
- Current owner paid $10k; list at $65k implies a 584% gain — meaningful room to come down on a strong offer.
Risks & watch-outs
- Watch-outs: built in 1910 — expect roof / HVAC / electrical / plumbing capex.
Questions for the listing agent
- Built in 1910 — when were the roof, HVAC, electrical panel, plumbing, and water heater last replaced?
- Is there a deadline driving the sale (1031 exchange, divorce, estate, relocation)? That informs how much negotiation room exists.
- Schools are D-rated, which usually means shorter tenancies and higher turnover. Who's the typical renter profile here, and what's been the actual vacancy rate?
- Crime grade is D in this area — have there been break-ins, vandalism, or insurance claims at this property in the last 3 years? What carrier currently insures it and at what premium?
- What's the average days-on-market for RENTAL listings here right now (not sales)? A rising rental-DOM trend means longer vacancies and softer asking-rent achievability than the comps imply.
- What's the recent tenant-quality profile in this submarket — average credit score on applications, eviction rate, late-payment / NSF rate, and stable-employment percentage? A property-management company in the area should have these aggregated.
- How much new for-sale + rental construction is in the pipeline within 1–3 miles? Heavy new supply typically softens prices + rents 12–24 months out; constrained supply supports both.
Investment metrics
- 1% rule
- 1.26% ✓
- Cap rate
- 10.67%
- Cash-on-cash
- 15.65%
- DSCR
- 1.70
- GRM
- 6.6
CMA / ARV
- ARV (on-the-fly)
- $104,300
- Comps found
- 3
Show comp detail 3 sales within ~0.75 mi
| Address | Dist | Beds/Ba | Sqft | Sold | Price | $/sf | Match |
|---|---|---|---|---|---|---|---|
| 404 Utah St | 0.19mi | 1/2.0 (-1) | 790 (+6%) | 11mo | $125,000 | $158 | 63 |
| 107 Osage Ave | 0.44mi | 2/1.0 | 824 (+11%) | 5mo | $94,500 | $115 | 58 |
| 1111 Miami St | 0.69mi | 1/1.0 (-1) | 810 (+9%) | 1mo | $113,500 | $140 | 48 |
Match score weights: distance 35% · size 25% · config 20% · recency 20%. Top-matched comps best support the ARV.
Projected returns pro-forma
-3.0% appreciation · 3.0% rent growth · sell at horizon
- IRR
- 6.4%
- Equity multiple
- 1.25×
- Total profit
- $4,568
- Equity at exit
- $9,692
- IRR
- 15.8%
- Equity multiple
- 2.28×
- Total profit
- $23,387
- Equity at exit
- $5,620
Cash invested: $18,200 (down + closing). Projections, not guarantees.
Landlord ↔ Tenant lean methodology
- Overall (STATE)
- 83 Strongly Landlord-Friendly
- State Kansas
- 83 Strongly Landlord-Friendly · R+10
- County
- — inherits STATE
- City
- — inherits STATE
ZIP-level market 66434
- Home prices YoY
- -19.1%
- Active inventory
- 32
- Price-to-rent
- 6.6×
Monthly cashflow live
- Estimated rent
- $817 medium interval (Pro) →
- Mortgage (P&I)
- −$341
- Tax from tax record
- −$40 /mo · $485/yr
- Insurance
- −$27
- HOA
- −$0
- Vacancy / Maint / Mgmt
- −$172
- Net cashflow
- $237
Break-even live
Sensitivity live
| Price | -10% $274 | -5% $256 | +0% $237 | +5% $219 | +10% $200 |
|---|---|---|---|---|---|
| Rent | -10% $173 | -5% $205 | +0% $237 | +5% $270 | +10% $302 |
| Rate | -1.0pp $270 | -0.5pp $254 | base $237 | +0.5pp $220 | +1.0pp $203 |
UW: 25.0% down · 7.5% · 30yr · 1.5% tax · 5.0% vac · 8.0% maint · 8.0% mgmt
Financing live
Cash to close
- Down payment
- $16,250
- Closing costs
- $1,950
- Reserves months
- —
- Total cash needed
- —
Loan-product check · same deal, 3 products live
Conventional
25% down · 7.5% · 30yr
- Down + closing
- —
- Monthly P&I
- —
- Monthly cashflow
- —
- DSCR
- —
- Eligible?
- —
Personal DTI + credit; lowest rate.
DSCR
20% down · 8.5% · 30yr
- Down + closing
- —
- Monthly P&I
- —
- Monthly cashflow
- —
- DSCR
- —
- Eligible?
- —
No personal income docs; deal must DSCR.
Hard money
10% down · 12.0% · 12mo
- Down + closing
- —
- Monthly P&I
- —
- Monthly cashflow
- —
- DSCR
- —
- Eligible?
- —
Short-term bridge; refi at stabilization.
Listing history 21 events
-
2026-06-21days on market $65,000 Active 28 DOM
-
2026-06-18days on market $65,000 Active 26 DOM
-
2026-06-17days on market $65,000 Active 25 DOM
-
2026-06-16days on market $65,000 Active 24 DOM
-
2026-06-15days on market $65,000 Active 23 DOM
-
2026-06-13days on market $65,000 Active 21 DOM
-
2026-06-12days on market $65,000 Active 20 DOM
-
2026-06-09days on market $65,000 Active 17 DOM
-
2026-06-08days on market $65,000 Active 16 DOM
-
2026-06-07days on market $65,000 Active 15 DOM
-
2026-06-05days on market $65,000 Active 13 DOM
-
2026-06-04days on market $65,000 Active 11 DOM
-
2026-06-02days on market $65,000 Active 10 DOM
-
2026-06-01days on market $65,000 Active 9 DOM
-
2026-05-31days on market $65,000 Active 8 DOM
-
2026-05-31days on market $65,000 Active 7 DOM
-
2026-05-23$65,000 Active
-
2022-01-31soldstatus
-
2012-06-15soldstatus
-
1995-10-01soldstatus $9,500
-
1991-09-01soldstatus
ⓘ Source: listings_history table (triggers on properties + properties_extension) + one-shot
backfill from property_details.listing_events for pre-trigger history.
Tax reassessment forecast KS · Resets to sale price
- Current annual tax
- $485 · $40/mo
- Projected year-2 tax
- $916 · $76/mo
- Expected delta
- +$431/yr (+$36/mo · 88.8%)
ⓘ Screening estimate from a state-policy table — verify with the county assessor before closing.
Climate risk First Street
- Flood 1/10 Low FEMA zone X (unshaded) · 0% chance over 30 yrs
- Wildfire 2/10 Low
- Heat 3/10 Moderate 7 d/yr ≥107°F today · 16 d/yr by 30 yrs out
- Wind 2/10 Low
- Air quality 2/10 Low 0 unhealthy d/yr today · 1 by 30 yrs out
Nearby sold comps map
Loading sold comps map…
Walkable amenities ~0.75 mi
Loading nearby amenities…
Taxation est. · year 1
- Rental income
- $9,808
- − Mortgage interest
- −$3,641
- − Property taxes
- −$485
- − Insurance
- −$325
- − Repairs & maintenance
- −$785
- − Management
- −$785
- − Depreciation
- −$1,891
- Taxable income
- $1,896
- Est. tax owed @ 24.0%
- −$455
- After-tax cash flow
- $2,392/yr
For passive investors: Depreciation is non-cash, so a rental often shows a tax loss while cash-flowing — sheltering income. Rental losses are passive: they offset passive income freely, and up to $25,000/yr can offset ordinary (W-2) income if you actively participate and your MAGI is under $100k (phasing out to $0 by $150k); unused losses carry forward. On sale, claimed depreciation is recaptured at up to 25%, and gains may owe capital-gains tax (a 1031 exchange can defer both). Figures are a year-1 estimate at your 24.0% rate — not tax advice; consult a CPA.
Schools (NCES district)
- District
- Hiawatha
- NCES district ID
- 2000006
- Math proficiency
- 26% ▼ -4.00%
- Reading proficiency
- 32% ▼ -11.00%
- Median HH income
- $41,098
- Composite
- 24.5/100
- National rank
- #7653
- State rank
- #112 of 169 in KS
Livability — Hiawatha
- Score
- 74/100
- State rank
- #90
- US rank
- #4934
Category grades
Schools grade is shown separately in the Schools card above.
Census & demographics
- Census place
- Hiawatha, KS
- Population (ZIP)
- 4,738
Population outlook (Brown County) Hauer SSP2
- Today (2025)
- 9,357 people
- By 2030
- 9,119 · -2.5%
- By 2040
- 8,629 · -7.8%
- By 2050
- 8,188 · -12.5%
- By 2075
- 7,138 · -23.7%
- By 2100
- 5,586 · -40.3%
Race, ethnicity, and origin ACS 2023
- Neighborhood character
- Predominantly White (88%)
- Race & ethnicity
- White 88% Two or more races 5% Hispanic / Latino 2% Native American 2% Black 2%
- Common ancestry
- Romanian 3% Iranian 3% Slovak 2%
- Foreign-born
- 2% · Canada, China
- Languages at home
- 98% English-only · Spanish 1%
Political lean MEDSL · Brown
- 2024 margin
- Solid R (+47.9) · D 25.0% · R 73.0% · Other 2.0%
- 2008→2024 swing
- -9.8pp toward R · 2008: -38.1pp · 2024: -47.9pp
- All cycles
- 2024: R+47.9 2020: R+48.2 2016: R+50.8 2012: R+44.0 2008: R+38.1
Not yet ingested
- Civics
- —
Market trends
- HPI YoY
- ▼ -55.16%
- Current HPI
- 233.9129
- Rent YoY
- —
- Metro
- —
- State GDP YoY
- —
- F500 in state
- 0
Price history
+584.2% since first listed5 events — show timeline
- 2026-05-23 Listed $65,000 Heartland MLS as Distributed by MLS Grid
- 2022-01-31 Sold (Public Records) — Public Records
- 2012-06-15 Sold (Public Records) — Public Records
- 1995-10-01 Sold (Public Records) $9,500 Public Records
- 1991-09-01 Sold (Public Records) — Public Records
Property tax history
+4.8%/yrLatest (2025): $485 · +9.8% YoY. Source: county tax records.
Cash-flow waterfall
monthlySold comps — $/sqft
last 12 mo · ≤1 miLoading sold comps…