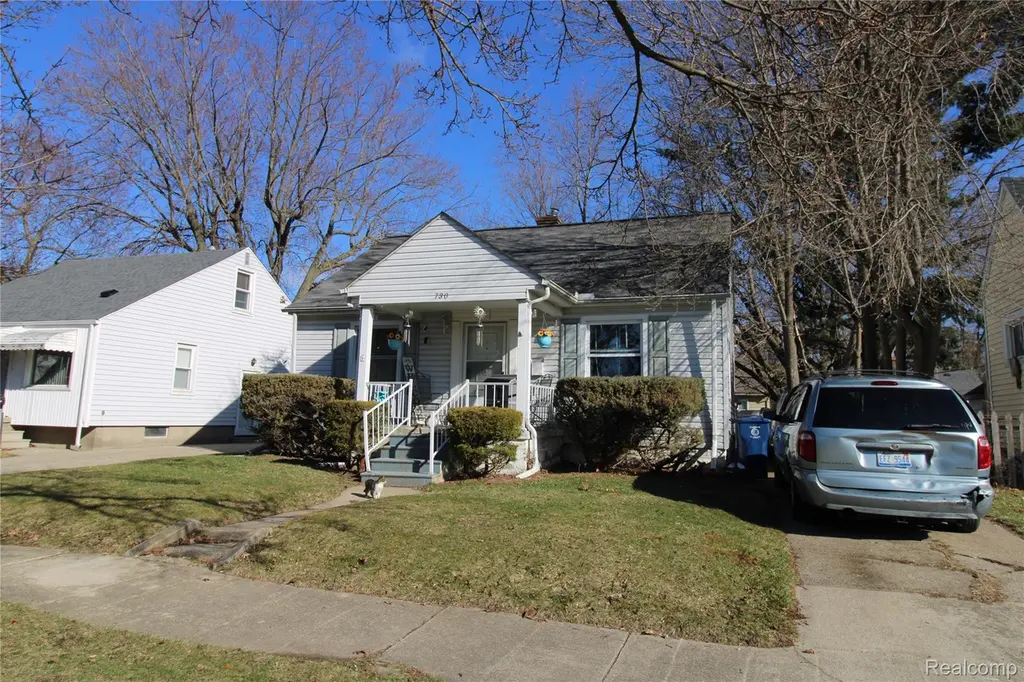
730 Alvord Ave · Flint, MI
Flood risk 1/10 · Minimal
- FEMA flood zone
- X (unshaded)
- Chance of flooding over 30 yrs
- 0.0%
- Est. flood insurance / yr
- $473 – $860
Fire risk 1/10 · Minimal
- Est. fire insurance / yr
- $784 – $1,456
Heat risk 2/10 · Minimal
- Hot days now (above 97°F)
- 7 days/yr
- Hot days in 30 yrs
- 15 days/yr
Wind risk 2/10 · Minimal
- Chance of severe wind over 30 yrs
- —
Air-quality risk 3/10 · Minor
- Unhealthy air days now
- 3 days/yr
- Unhealthy air days in 30 yrs
- 4 days/yr
Risk factors via First Street. Map © Google.
Why this score? — see what drove the B- grade
The composite is a weighted blend of 9 inputs, each scored 0–100. Each bar is that input's sub-score; the figure is the points it added to the 100-point composite (weight × sub-score).
- Cash flow +30.0/30.0
- 1% rule +10.0/10.0
- DSCR +10.0/10.0
- ARV discount +9.7/15.0
- Livability +3.7/5.0
- Condition / age +2.5/5.0
- Rent growth +2.2/5.0
- Schools +1.1/10.0
- Appreciation +0.0/10.0
$31,900
🖨 Deal sheet 📄 Offer letter ✓ Due diligence
Listing remarks MLS
Great investment or first time home near to 475. Be sure to check out this cozy home with great living space and unique nook area. Current tenant is on a month to month contract.
Key facts
- 4,356 sq ft lot
- Built 1936
- Listed 64 days
Property features AI
Finance
- Other: Directions: Fenton Rd North, turn right on Alvord. House on north side of road.; Cross streets: Alvord and Camden
- Financial info: No investor or income/expense information provided
- HOA & community: Subdivision: NEWCOMBE PLACE
Exterior
- Parking: No garage
- Security: No security features provided
- Utilities: Public water; Public sewer
- Home design: Single-family residence; One story; Ground-level entry with steps; Vinyl siding exterior
- Construction: Block foundation
- Exterior features: Asphalt roof; Paved road access; Lot roughly 0.1 acre (45 x 100)
Interior
- Kitchen: No specific kitchen appliance list provided
- Bedrooms: 4 total rooms (includes bedrooms and living spaces)
- Flooring: No flooring details provided
- Bathrooms: 1 full bathroom
- Heating & cooling: Forced air heating; Natural gas heating; No cooling
- Interior features: Gas water heater; Unfinished basement; Basement present
- Laundry & utility: No laundry details provided
Neighborhood map
What this means for you Summary
Snapshot
- This is a 2-bed/1.0-bath single-family listed at $32k.
Deal economics
- At list price, monthly cash flow is $446 ($5k/yr) — positive.
- The deal already cash-flows at list — no discount required.
- Meets the 1% rule at list price ($892 rent vs $32k).
- Recommended offer: $30k (6.0% below list) — sets the bar for market timing.
- Cap rate 23.1% vs local median 11.5% in Flint — top-decile yield for the area; either an underpriced asset or a hidden risk that comps aren't pricing in. Stress-test before assuming the spread holds.
Location & tenants
- Location reads 74/100 on livability (#196 in MI, #4,946 nationally) — a middle-class / working-renter tenant base. Strengths: commute A+, cost of living A+, housing A+; Watch: schools F, crime F, employment F.
- Flint School District (urban): math 7% / reading 13% proficiency, ranked #714 of 760 in MI (top 94%) — low school quality limits family demand, transient renter base, plan for 1-2y turnover; 83% free/reduced lunch — lower-income household profile, screen leases tightly.
- Market conditions: Rents soft (-1.0%/yr); 206 active listings in the ZIP; 7 comparable units currently listed for rent nearby; rentals leasing fast (median 14d on market — plan ~1-2 weeks tenant-placement turnaround); 419 units permitted in Genesee County in 2024 (68 in 5+ unit buildings).
Forward outlook
- Local home prices are declining (-3.0%/yr); year-one equity from $221 of loan paydown is wiped out by about $957 of value loss. Plan a longer hold.
- Genesee County population projected at -27% by 2050 — secular population decline; favor cash flow + early exit over multi-decade hold.
- At projected returns (-3.0% appreciation + 0.0% rent growth), your $9k cash investment doubles in ~2 years — after that, you're playing with house money.
Negotiation context
- It's been on market 64 days — a 6% lower offer ($30k) is reasonable based on typical stale-listing flexibility.
- 8 sale attempts since 17y ago; this cycle's ask has dropped $8k (20%) from the opening price — seller is motivated, your offer sets the floor, not the list.
- Current owner paid $6k; list at $32k implies a 391% gain — meaningful room to come down on a strong offer.
Risks & watch-outs
- Watch-outs: property tax is 3.0% of price; built in 1936 — expect roof / HVAC / electrical / plumbing capex.
Questions for the listing agent
- It's been on market 64 days. Have you received any prior offers? Is the seller open to a 6% concession, seller financing, or rate buy-down credit?
- Built in 1936 — when were the roof, HVAC, electrical panel, plumbing, and water heater last replaced?
- Property tax is high relative to price — has the assessment been appealed recently, and will the sale trigger a re-assessment?
- Why hasn't it sold? Are there any deal-killer items the seller is aware of (foundation, flood, title, zoning, code violations)?
- Is there a deadline driving the sale (1031 exchange, divorce, estate, relocation)? That informs how much negotiation room exists.
- Schools are F-rated, which usually means shorter tenancies and higher turnover. Who's the typical renter profile here, and what's been the actual vacancy rate?
- Crime grade is F in this area — have there been break-ins, vandalism, or insurance claims at this property in the last 3 years? What carrier currently insures it and at what premium?
- What's the average days-on-market for RENTAL listings here right now (not sales)? A rising rental-DOM trend means longer vacancies and softer asking-rent achievability than the comps imply.
- What's the recent tenant-quality profile in this submarket — average credit score on applications, eviction rate, late-payment / NSF rate, and stable-employment percentage? A property-management company in the area should have these aggregated.
- How much new for-sale + rental construction is in the pipeline within 1–3 miles? Heavy new supply typically softens prices + rents 12–24 months out; constrained supply supports both.
Investment metrics
- 1% rule
- 2.80% ✓
- Cap rate
- 23.07%
- Cash-on-cash
- 59.90%
- DSCR
- 3.67
- GRM
- 3.0
CMA / ARV
- ARV (on-the-fly)
- $33,540
- Comps found
- 12
Show comp detail 12 sales within ~0.75 mi
| Address | Dist | Beds/Ba | Sqft | Sold | Price | $/sf | Match |
|---|---|---|---|---|---|---|---|
| 4418 Brunswick Ave | 0.24mi | 2/1.0 | 755 (-3%) | 4mo | $55,000 | $73 | 80 |
| 1015 Alvord Ave | 0.34mi | 2/1.0 | 750 (-4%) | 3mo | $35,500 | $47 | 75 |
| 1125 Ingleside Ave | 0.46mi | 2/1.0 | 771 (-1%) | 2mo | $7,500 | $10 | 75 |
| 3116 Camden Ave | 0.49mi | 2/1.0 | 766 (-2%) | 5mo | $29,000 | $38 | 70 |
| 937 Barrie Ave | 0.66mi | 2/1.0 | 780 (0%) | 1mo | $29,000 | $37 | 69 |
| 839 Barrie Ave | 0.62mi | 2/1.0 | 816 (+5%) | 3mo | $35,000 | $43 | 61 |
| 730 Freeman Ave | 0.49mi | 2/1.0 | 836 (+7%) | 5mo | $27,000 | $32 | 61 |
| 1233 Carman St | 0.57mi | 2/1.0 | 720 (-8%) | 2mo | $82,500 | $115 | 59 |
| 1225 Vermilya Ave | 0.63mi | 2/1.0 | 831 (+6%) | 5mo | $15,000 | $18 | 55 |
| 1388 Carman St | 0.72mi | 2/1.0 | 723 (-7%) | 3mo | $84,650 | $117 | 52 |
| 1105 Lincoln Ave | 0.50mi | 2/1.0 | 896 (+15%) | 2mo | $38,000 | $42 | 51 |
| 1169 Carman St | 0.56mi | 3/1.0 (+1) | 680 (-13%) | 5mo | $85,900 | $126 | 43 |
Match score weights: distance 35% · size 25% · config 20% · recency 20%. Top-matched comps best support the ARV.
Projected returns pro-forma
-3.0% appreciation · 0.0% rent growth · sell at horizon
- IRR
- 55.0%
- Equity multiple
- 3.31×
- Total profit
- $20,650
- Equity at exit
- $4,756
- IRR
- 58.9%
- Equity multiple
- 5.99×
- Total profit
- $44,593
- Equity at exit
- $2,758
Cash invested: $8,932 (down + closing). Projections, not guarantees.
Landlord ↔ Tenant lean methodology
- Overall (STATE)
- 62 Landlord-Friendly
- State Michigan
- 62 Landlord-Friendly · EVEN
- County
- — inherits STATE
- City
- — inherits STATE
ZIP-level market 48507
- Rents YoY
- -1.0%
- Active inventory
- 206
- Price-to-rent
- 3.0×
Monthly cashflow live
- Estimated rent
- $892 high interval (Pro) →
- Mortgage (P&I)
- −$167
- Tax from tax record
- −$79 /mo · $942/yr
- Insurance
- −$13
- HOA
- −$0
- Vacancy / Maint / Mgmt
- −$187
- Net cashflow
- $446
Break-even live
UW: 25.0% down · 7.5% · 30yr · 1.5% tax · 5.0% vac · 8.0% maint · 8.0% mgmt
Financing live
Cash to close
- Down payment
- $7,975
- Closing costs
- $957
- Reserves months
- —
- Total cash needed
- —
Loan-product check · same deal, 3 products live
Conventional
25% down · 7.5% · 30yr
- Down + closing
- —
- Monthly P&I
- —
- Monthly cashflow
- —
- DSCR
- —
- Eligible?
- —
Personal DTI + credit; lowest rate.
DSCR
20% down · 8.5% · 30yr
- Down + closing
- —
- Monthly P&I
- —
- Monthly cashflow
- —
- DSCR
- —
- Eligible?
- —
No personal income docs; deal must DSCR.
Hard money
10% down · 12.0% · 12mo
- Down + closing
- —
- Monthly P&I
- —
- Monthly cashflow
- —
- DSCR
- —
- Eligible?
- —
Short-term bridge; refi at stabilization.
Rent comps 7 comps
| Address | Beds | Baths | Sqft | Rent | $/sqft | DOM | Units | Dist |
|---|---|---|---|---|---|---|---|---|
| 813 Alvord Ave Flint, MI | 2.0 | 1.0 | 724 | $850 | $1.17 | 13d | 1 | 0.09mi |
| 4400 Kings Ln Burton, MI | 1.0–2.0 | 1.0–2.0 | 666 | $960 | $1.44 | 13d | 19 | 0.46mi |
| 1023 Barrie Ave Flint, MI | 2.0 | 1.0 | 660 | $775 | $1.17 | 21d | 1 | 0.69mi |
| 1426 Pettibone Ave Flint, MI | 2.0 | 1.0 | 750 | $900 | $1.20 | 21d | 1 | 0.70mi |
| 3291 Glengary St Burton, MI | 2.0 | 1.0 | 972 | $1,075 | $1.11 | 43d | 1 | 1.33mi |
| 410 Lippincott Blvd Flint, MI | 2.0 | 1.0 | 800 | $695 | $0.87 | 13d | 1 | 1.36mi |
| 2266 Donovan St Burton, MI | 2.0 | 1.0 | 700 | $800 | $1.14 | 13d | 1 | 1.37mi |
Listing history 23 events
-
2026-06-05days on market $31,900 Active 64 DOM
-
2026-06-03days on market $31,900 Active 63 DOM
-
2026-06-02days on market $31,900 Active 62 DOM
-
2026-06-01days on market $31,900 Active 61 DOM
-
2026-05-31days on market $31,900 Active 60 DOM
-
2026-05-30days on market $31,900 Active 59 DOM
-
2026-04-25price $31,900 178-char remark
Show marketing remark (178 chars)
Great investment or first time home near to 475. Be sure to check out this cozy home with great living space and unique nook area. Current tenant is on a month to month contract.
-
2026-04-24price $31,900
-
2026-04-01$39,900 Active 178-char remark
Show marketing remark (178 chars)
Great investment or first time home near to 475. Be sure to check out this cozy home with great living space and unique nook area. Current tenant is on a month to month contract.
-
2026-04-01$39,900 Active
Show marketing remark (178 chars)
Great investment or first time home near to 475. Be sure to check out this cozy home with great living space and unique nook area. Current tenant is on a month to month contract.
-
2014-08-15soldstatus $6,500 55-char remark
Show marketing remark (55 chars)
Great Investment Or First Time Buyer, Lot's Of Updates.
-
2014-08-15soldstatus $6,500
Show marketing remark (55 chars)
Great Investment Or First Time Buyer, Lot's Of Updates.
-
2014-07-23historical
-
2013-12-23$7,900 55-char remark
Show marketing remark (55 chars)
Great Investment Or First Time Buyer, Lot's Of Updates.
-
2013-12-23$7,900
Show marketing remark (55 chars)
Great Investment Or First Time Buyer, Lot's Of Updates.
-
2010-06-30historical
-
2010-06-30historical
-
2010-05-20$19,900
-
2010-05-20$19,900
-
2010-02-01historical
-
2010-02-01historical
-
2009-11-23$12,500
-
2009-11-23$12,500
ⓘ Source: listings_history table (triggers on properties + properties_extension) + one-shot
backfill from property_details.listing_events for pre-trigger history.
Tax reassessment forecast MI · Partial reset (capped growth)
- Current annual tax
- $942 · $79/mo
- Projected year-2 tax
- $942 · $79/mo
- Expected delta
- $0/yr ($0/mo · 0.0%)
ⓘ Screening estimate from a state-policy table — verify with the county assessor before closing.
Climate risk First Street
- Flood 1/10 Low FEMA zone X (unshaded) · 0% chance over 30 yrs
- Wildfire 1/10 Low
- Heat 2/10 Low 7 d/yr ≥97°F today · 15 d/yr by 30 yrs out
- Wind 2/10 Low
- Air quality 3/10 Moderate 3 unhealthy d/yr today · 4 by 30 yrs out
Nearby sold comps map
Loading sold comps map…
Walkable amenities ~0.75 mi
Loading nearby amenities…
Taxation est. · year 1
- Rental income
- $10,709
- − Mortgage interest
- −$1,787
- − Property taxes
- −$942
- − Insurance
- −$160
- − Repairs & maintenance
- −$857
- − Management
- −$857
- − Depreciation
- −$928
- Taxable income
- $5,178
- Est. tax owed @ 24.0%
- −$1,243
- After-tax cash flow
- $4,108/yr
For passive investors: Depreciation is non-cash, so a rental often shows a tax loss while cash-flowing — sheltering income. Rental losses are passive: they offset passive income freely, and up to $25,000/yr can offset ordinary (W-2) income if you actively participate and your MAGI is under $100k (phasing out to $0 by $150k); unused losses carry forward. On sale, claimed depreciation is recaptured at up to 25%, and gains may owe capital-gains tax (a 1031 exchange can defer both). Figures are a year-1 estimate at your 24.0% rate — not tax advice; consult a CPA.
Schools (NCES district)
- District
- Flint School District
- NCES district ID
- 2614520
- Math proficiency
- 7% ▬ 0.00%
- Reading proficiency
- 13% ▲ 3.00%
- Median HH income
- $25,954
- Composite
- 10.97/100
- National rank
- #14642
- State rank
- #714 of 760 in MI
Livability — Flint
- Score
- 74/100
- State rank
- #196
- US rank
- #4946
Category grades
Schools grade is shown separately in the Schools card above.
Census & demographics
- Census place
- Flint, MI
- County
- Genesee County · 221,329 people
- City population
- 93,814
- Metro
- Flint, MI
- Population (ZIP)
- 28,723
- Household income
- $46,554
- Rent vs Own
- Severe rent burden
- 1534.0
Population outlook (Genesee County) Hauer SSP2
- Today (2025)
- 381,312 people
- By 2030
- 362,731 · -4.9%
- By 2040
- 321,550 · -15.7%
- By 2050
- 279,212 · -26.8%
- By 2075
- 193,336 · -49.3%
- By 2100
- 128,118 · -66.4%
Race, ethnicity, and origin ACS 2023
- Neighborhood character
- Diverse neighborhood (Simpson 0.57)
- Race & ethnicity
- White 59% Black 28% Two or more races 10% Hispanic / Latino 5%
- Common ancestry
- Lithuanian 4% Romanian 3% Slovak 2%
- Foreign-born
- 1% · Canada
- Languages at home
- 97% English-only · Spanish 1% Other Asian/Pacific 1%
Political lean MEDSL · Genesee
- 2024 margin
- Toss-up / Even · D 51.4% · R 47.2% · Other 1.4%
- 2008→2024 swing
- -28.3pp toward R · 2008: 32.5pp · 2024: 4.2pp
- All cycles
- 2024: D+4.2 2020: D+9.3 2016: D+9.5 2012: D+28.2 2008: D+32.5
Not yet ingested
- Civics
- —
Market trends
- HPI YoY
- ▼ -154.90%
- Current HPI
- 132.3632
- Rent YoY
- ▼ -1.04%
- Metro
- Flint, MI
- State GDP YoY
- ▲ 1.37%
- F500 in state
- 28
Industry mix (Fortune 500 HQ in MI)
| Industry | F500 HQs | Revenue |
|---|---|---|
| Automotive Parts | 3 | $48B |
|
||
| Automotive | 2 | $372B |
|
||
| Chemicals | 1 | $45B |
|
||
| Automotive Retail | 1 | $29B |
|
||
| Healthcare / Medical Devices | 1 | $23B |
|
||
| Automotive Technology | 1 | $20B |
|
||
Price history
+155.2% since first listed17 events — show timeline
- 2026-04-25 Price Changed $31,900 MiRealSource-MiMLS
- 2026-04-24 Price Changed $31,900 REALCOMP
- 2026-04-01 Listed $39,900 REALCOMP
- 2026-04-01 Listed $39,900 MiRealSource-MiMLS
- 2014-08-15 Sold (MLS) $6,500 MiRealSource-MiMLS
- 2014-08-15 Sold (MLS) $6,500 REALCOMP
- 2014-07-23 Listing Removed — MiRealSource-MiMLS
- 2013-12-23 Listed $7,900 MiRealSource-MiMLS
- 2013-12-23 Listed $7,900 REALCOMP
- 2010-06-30 Listing Removed — REALCOMP
- 2010-06-30 Listing Removed — MiRealSource-MiMLS
- 2010-05-20 Listed $19,900 REALCOMP
- 2010-05-20 Listed $19,900 MiRealSource-MiMLS
- 2010-02-01 Listing Removed — REALCOMP
- 2010-02-01 Listing Removed — MiRealSource-MiMLS
- 2009-11-23 Listed $12,500 REALCOMP
- 2009-11-23 Listed $12,500 MiRealSource-MiMLS
Property tax history
+2.0%/yrLatest (2025): $942 · +1.6% YoY. Source: county tax records.
Cash-flow waterfall
monthlySold comps — $/sqft
last 12 mo · ≤1 miLoading sold comps…