 Duplex
3621 NE 1st Ter · Oakland Park, FL
Flood risk 4/10 · Minor
- FEMA flood zone
- X (shaded)
- Chance of flooding over 30 yrs
- 0.22%
- Est. flood insurance / yr
- $507 – $1,088
Fire risk 1/10 · Minimal
- Est. fire insurance / yr
- $947 – $1,759
Heat risk 10/10 · Severe
- Hot days now (above 106°F)
- 7 days/yr
- Hot days in 30 yrs
- 26 days/yr
Wind risk 10/10 · Severe
- Chance of severe wind over 30 yrs
- 99.0%
Air-quality risk 2/10 · Minimal
- Unhealthy air days now
- 1 days/yr
- Unhealthy air days in 30 yrs
- 2 days/yr
Risk factors via First Street. Map © Google.
Why this score? — see what drove the C grade
The composite is a weighted blend of 9 inputs, each scored 0–100. Each bar is that input's sub-score; the figure is the points it added to the 100-point composite (weight × sub-score).
- Cash flow +23.6/30.0
- DSCR +7.6/10.0
- ARV discount +7.5/15.0
- 1% rule +6.4/10.0
- Schools +4.1/10.0
- Livability +3.9/5.0
- Rent growth +3.0/5.0
- Condition / age +2.5/5.0
- Appreciation +0.0/10.0
$618,000
🖨 Deal sheet 📄 Offer letter ✓ Due diligence
Multi-family units
County records classify this as Multi-Family (2-4 Unit). Listing-text estimate: 2 units. confirmed
Listing remarks MLS
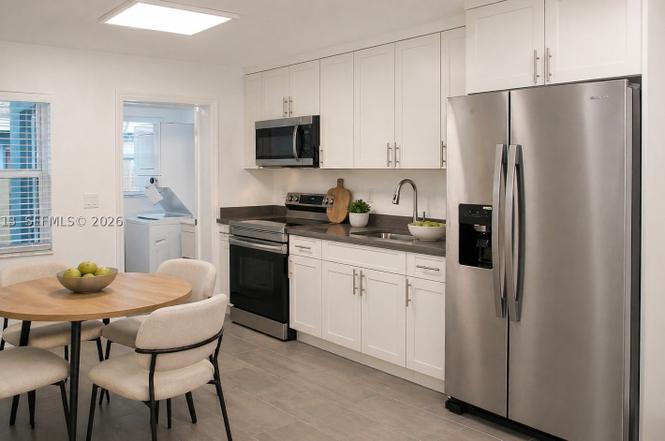
Opportunity is knocking for your investor to purchase this updated duplex with newer kitchens, electrical, a/c and laundry rooms with private backyards. Duplex is located East of US1 just East of Andrews. Both units are currently leased out, one is mont h to month. Yearly gross income of $22,200. Call agent to show. Please provide 24 hr notice.
Key facts
- New kitchen
- New bathroom
- Ss appliances
Tags
Property features AI
Finance
- Financial info: Rent reported: two units at $2,100 and two units at $1,950; Gardener service included in rent
Exterior
- Parking: Total of 4 parking spaces
- Utilities: Public water; Public sewer; Cable available
- Home design: Single-story building; Shingle roof; Block construction
- Construction: Block construction; Shingle roof; Resale property
- Exterior features: Fenced yard; Lot smaller than a quarter acre; Zoned RM-16
Interior
- Bedrooms: Four 2-bedroom units (two units reported in each unit type group)
- Flooring: Tile flooring
- Bathrooms: Each unit has 1 full bathroom
- Heating & cooling: Central air conditioning
- Interior features: Blinds; Impact glass windows
Neighborhood map
What this means for you Summary
Snapshot
- This is a 2 × 4-bed/2.0-bath units multifamily listed at $618k.
Deal economics
- At list price, monthly cash flow is $1k ($14k/yr) — positive. Per door: $581/mo.
- The deal already cash-flows at list — no discount required.
- Meets the 1% rule at list price ($7k rent vs $618k).
- Recommended offer: $544k (12.0% below list) — sets the bar for market timing.
- Cap rate 8.5% vs local median 3.8% in Oakland Park — top-decile yield for the area; either an underpriced asset or a hidden risk that comps aren't pricing in. Stress-test before assuming the spread holds.
Location & tenants
- Location reads 77/100 on livability (#193 in FL, #3,082 nationally) — a middle-class / working-renter tenant base. Strengths: commute A+, housing A+, health & safety A+; Watch: schools D, amenities F.
- Broward (suburban): math 42% / reading 53% proficiency, ranked #46 of 73 in FL (top 63%) — families likely to look elsewhere, expect single-tenant / working-renter base with shorter leases.
- Market conditions: Rents rising (+2.0%/yr); 355 active listings in the ZIP; 40 comparable units currently listed for rent nearby; rentals at typical pace (median 22d on market — plan ~3-4 weeks tenant-placement turnaround); solid renter incomes; 2,111 units permitted in Broward County in 2024 (1,265 in 5+ unit buildings).
- At $7,073/mo this rent would consume 113% of the median local household income ($75k/yr) (locally 1755% of renters already pay >50% of income on rent) — very limited rent-growth headroom before tenants either downsize or default.
Forward outlook
- Local home prices are declining (-3.0%/yr); year-one equity from $4k of loan paydown is wiped out by about $19k of value loss. Plan a longer hold.
- Broward County population projected at +34% by 2050 — long-run rental-demand tailwind backs the buy-and-hold thesis.
Negotiation context
- It's been on market 296 days — a 12% lower offer ($544k) is reasonable based on typical stale-listing flexibility.
- 5 sale attempts since 12y ago; this cycle's ask has dropped $102k (14%) from the opening price — seller is motivated, your offer sets the floor, not the list.
- Current owner paid $180k; list at $618k implies a 243% gain — meaningful room to come down on a strong offer.
Risks & watch-outs
- Climate carrying-cost: severe wind risk, 99% chance of damaging wind over 30y; extreme-heat days projected 7→26/yr by 2055 (HVAC capex compounding) — expect insurance premiums to compound above CPI over the hold.
Questions for the listing agent
- It's been on market 296 days. Have you received any prior offers? Is the seller open to a 12% concession, seller financing, or rate buy-down credit?
- Can we see the unit-by-unit rent roll, current vacancy, and any below-market leases? What's the average tenancy length?
- What capital expenditures (roof, boiler, parking lot, exteriors) have been made in the last 5 years, and what's planned in the next 2?
- Built in 1971 — when were the roof, HVAC, electrical panel, plumbing, and water heater last replaced?
- Why hasn't it sold? Are there any deal-killer items the seller is aware of (foundation, flood, title, zoning, code violations)?
- Is there a deadline driving the sale (1031 exchange, divorce, estate, relocation)? That informs how much negotiation room exists.
- Schools are D-rated, which usually means shorter tenancies and higher turnover. Who's the typical renter profile here, and what's been the actual vacancy rate?
- What's the average days-on-market for RENTAL listings here right now (not sales)? A rising rental-DOM trend means longer vacancies and softer asking-rent achievability than the comps imply.
- What's the recent tenant-quality profile in this submarket — average credit score on applications, eviction rate, late-payment / NSF rate, and stable-employment percentage? A property-management company in the area should have these aggregated.
- How much new apartment / multifamily construction is in the pipeline within 1–3 miles? Heavy new supply (>2% of stock underway) typically softens rents 12–24 months out; light construction supports rent growth.
Investment metrics
- 1% rule
- 1.14% ✓
- Cap rate
- 8.55%
- Cash-on-cash
- 8.06%
- DSCR
- 1.36
- GRM
- 7.3
CMA / ARV
No comps found within radius.
Projected returns pro-forma
-3.0% appreciation · 2.01% rent growth · sell at horizon
- IRR
- -5.2%
- Equity multiple
- 0.81×
- Total profit
- $-32,886
- Equity at exit
- $92,146
- IRR
- 3.3%
- Equity multiple
- 1.23×
- Total profit
- $39,447
- Equity at exit
- $53,433
Cash invested: $173,040 (down + closing). Projections, not guarantees.
Landlord ↔ Tenant lean methodology
- Overall (STATE)
- 87 Strongly Landlord-Friendly
- State Florida
- 87 Strongly Landlord-Friendly · R+3
- County
- — inherits STATE
- City
- — inherits STATE
ZIP-level market 33334
- Home prices YoY
- -34.6%
- Rents YoY
- 2.0%
- Active inventory
- 355
- Price-to-rent
- 14.6×
Monthly cashflow live
- Estimated rent
- $7,073 high interval (Pro) →
- Mortgage (P&I)
- −$3,241
- Tax from tax record
- −$927 /mo · $11,123/yr
- Insurance
- −$258
- HOA
- −$0
- Vacancy / Maint / Mgmt
- −$1,485
- Net cashflow
- $1,162
Break-even live
2-unit breakdown (identical units grouped — click to expand)
| Units | Beds | Baths | Est. rent |
|---|---|---|---|
| 2× units | 4 | 2 | $7,072 |
| #1 | 4 | 2 | $3,536 |
| #2 | 4 | 2 | $3,536 |
| Total (2 units) | $7,073 | ||
UW: 25.0% down · 7.5% · 30yr · 1.5% tax · 5.0% vac · 8.0% maint · 8.0% mgmt
Financing live
Cash to close
- Down payment
- $154,500
- Closing costs
- $18,540
- Reserves months
- —
- Total cash needed
- —
Loan-product check · same deal, 3 products live
Conventional
25% down · 7.5% · 30yr
- Down + closing
- —
- Monthly P&I
- —
- Monthly cashflow
- —
- DSCR
- —
- Eligible?
- —
Personal DTI + credit; lowest rate.
DSCR
20% down · 8.5% · 30yr
- Down + closing
- —
- Monthly P&I
- —
- Monthly cashflow
- —
- DSCR
- —
- Eligible?
- —
No personal income docs; deal must DSCR.
Hard money
10% down · 12.0% · 12mo
- Down + closing
- —
- Monthly P&I
- —
- Monthly cashflow
- —
- DSCR
- —
- Eligible?
- —
Short-term bridge; refi at stabilization.
Rent comps 40 comps
| Address | Beds | Baths | Sqft | Rent | $/sqft | DOM | Units | Dist |
|---|---|---|---|---|---|---|---|---|
| 116 NW 41st St Unit 104 Oakland Park, FL | 3.0 | 2.5 | 2025 | $3,500 | $1.73 | 24d | 1 | 0.34mi |
| 333 NW 41st St #337 Oakland Park, FL | 3.0 | 2.5 | 2000 | $3,950 | $1.98 | 15d | 1 | 0.41mi |
| 333 NW 41st St #331 Oakland Park, FL | 3.0 | 2.5 | 2000 | $3,700 | $1.85 | 24d | 1 | 0.41mi |
| 554 NW 40th Ct Oakland Park, FL | 5.0 | 2.0 | 1475 | $4,564 | $3.09 | 24d | 1 | 0.45mi |
| 719 NE 36th St Unit 719 Oakland Park, FL | 4.0 | 2.0 | 1840 | $4,800 | $2.61 | 4d | 1 | 0.49mi |
| 105 NE 30th Ct Unit 107 Wilton Manors, FL | 3.0 | 2.0 | 1325 | $3,500 | $2.64 | 10d | 1 | 0.50mi |
| 105 NE 30th Ct Unit 107 Wilton Manors, FL | 3.0 | 2.0 | 1325 | $3,700 | $2.79 | 15d | 1 | 0.50mi |
| 108 NE 30th St Wilton Manors, FL | 3.0 | 2.0 | 1228 | $8,000 | $6.51 | 5d | 1 | 0.51mi |
| 108 NE 30th St Wilton Manors, FL | 3.0 | 2.0 | 1228 | $8,500 | $6.92 | 24d | 1 | 0.51mi |
| 3061 NE 4th Ave Wilton Manors, FL | 5.0 | 2.0 | 1500 | $4,250 | $2.83 | 7d | 1 | 0.53mi |
| 682 NE 43rd St Oakland Park, FL | 3.0 | 2.5 | 1694 | $4,200 | $2.48 | 24d | 1 | 0.65mi |
| 50 NE 45th Ct Fort Lauderdale, FL | 4.0 | 2.0 | 1600 | $3,300 | $2.06 | 24d | 1 | 0.66mi |
| 417 NE 29th St Wilton Manors, FL | 3.0 | 2.0 | 1596 | $5,800 | $3.63 | 24d | 1 | 0.70mi |
| 4580 NE 3rd Ave Fort Lauderdale, FL | 3.0 | 2.0 | 1192 | $3,300 | $2.77 | 20d | 1 | 0.74mi |
| 1068 NE 35th St Oakland Park, FL | 3.0 | 3.5 | 1787 | $3,900 | $2.18 | 5d | 1 | 0.76mi |
| 4601 NE 4th Ave Unit 1261561P Fort Lauderdale, FL | 3.0 | 2.0 | 1097 | $4,430 | $4.04 | 24d | 1 | 0.77mi |
| 4650 NE 2nd Ave Fort Lauderdale, FL | 3.0 | 2.0 | 1356 | $3,950 | $2.91 | 24d | 1 | 0.79mi |
| 609 NE 28th St #1 Wilton Manors, FL | 3.0 | 3.5 | 1800 | $3,300 | $1.83 | 15d | 1 | 0.87mi |
| 4680 NE 5th Ave Fort Lauderdale, FL | 3.0 | 2.0 | 1300 | $3,800 | $2.92 | 7d | 1 | 0.87mi |
| 2809 NW 7th Ave Wilton Manors, FL | 3.0 | 2.0 | 1145 | $7,000 | $6.11 | 5d | 1 | 0.91mi |
| 2909 NW 9th Ave Wilton Manors, FL | 3.0 | 3.0 | 1605 | $3,700 | $2.31 | 24d | 1 | 0.92mi |
| 2909 NW 9th Ave Wilton Manors, FL | 3.0 | 3.0 | 1605 | $3,700 | $2.31 | 7d | 1 | 0.92mi |
| 240 NW 48th Ct Fort Lauderdale, FL | 3.0 | 2.0 | 1240 | $3,100 | $2.50 | 3d | 1 | 0.98mi |
| 2825 NW 9th Ave Wilton Manors, FL | 3.0 | 2.0 | 1205 | $5,500 | $4.56 | 24d | 1 | 0.99mi |
| 3438 NE 13th Ave Oakland Park, FL | 3.0 | 2.5 | 1888 | $3,500 | $1.85 | 15d | 1 | 1.01mi |
| 3320 NE 13th Ave Unit 3320 Oakland Park, FL | 3.0 | 2.5 | 1433 | $3,600 | $2.51 | 24d | 1 | 1.01mi |
| 425 NE 25th St Wilton Manors, FL | 3.0 | 2.0 | 1439 | $8,000 | $5.56 | 24d | 1 | 1.02mi |
| 4780 NE 8th Ter Oakland Park, FL | 3.0 | 2.0 | 1130 | $4,200 | $3.72 | 24d | 1 | 1.08mi |
| 4360 NE 13th Ave Oakland Park, FL | 3.0 | 2.0 | 1269 | $3,700 | $2.92 | 24d | 1 | 1.10mi |
| 4360 NE 13th Ave Unit Main Oakland Park, FL | 3.0 | 2.0 | 1269 | $4,500 | $3.55 | 22d | 1 | 1.10mi |
| 4360 NE 13th Ave Oakland Park, FL | 3.0 | 2.0 | 1459 | $3,700 | $2.54 | 5d | 1 | 1.10mi |
| 1547 NE 34th St Unit 1541793P Oakland Park, FL | 3.0 | 2.0 | 1689 | $5,071 | $3.00 | 7d | 1 | 1.11mi |
| 3705 NE 16th Ave Oakland Park, FL | 3.0 | 2.0 | 1940 | $4,900 | $2.53 | 24d | 1 | 1.15mi |
| 4511 NE 13th Ave Oakland Park, FL | 3.0 | 3.0 | 1416 | $4,300 | $3.04 | 4d | 1 | 1.17mi |
| 4511 NE 13th Ave Oakland Park, FL | 3.0 | 3.0 | 1416 | $4,300 | $3.04 | 24d | 1 | 1.17mi |
| 3680 NE 16th Ave Oakland Park, FL | 3.0 | 2.0 | 1560 | $4,200 | $2.69 | 14d | 1 | 1.18mi |
| 320 NW 51st Ct Fort Lauderdale, FL | 3.0 | 2.0 | 1396 | $3,500 | $2.51 | 24d | 1 | 1.19mi |
| 4100 NW 16th Ave Fort Lauderdale, FL | 2.0–3.0 | 1.5 | 1698 | $2,699 | $1.59 | 1d | 5 | 1.21mi |
| 1570 NE 30th Pl Oakland Park, FL | 3.0 | 2.0 | 1942 | $4,700 | $2.42 | 24d | 1 | 1.23mi |
| 2802 NE 15th Ave Wilton Manors, FL | 4.0 | 2.5 | 1921 | $4,000 | $2.08 | 17d | 1 | 1.25mi |
Listing history 34 events
-
2026-06-18days on market $618,000 Active 296 DOM
-
2026-06-17pricedays on market $618,000 Active 295 DOM
-
2026-06-16days on market $628,000 Active 294 DOM
-
2026-06-15days on market $628,000 Active 293 DOM
-
2026-06-13days on market $628,000 Active 291 DOM
-
2026-06-09days on market $628,000 Active 287 DOM
-
2026-06-07days on market $628,000 Active 285 DOM
-
2026-06-04days on market $628,000 Active 282 DOM
-
2026-06-03days on market $628,000 Active 281 DOM
-
2026-06-02days on market $628,000 Active 280 DOM
-
2026-06-01days on market $628,000 Active 279 DOM
-
2026-05-31days on market $628,000 Active 278 DOM
-
2026-02-12price $628,000
-
2026-01-27price $649,000
-
2026-01-01status Active
-
2025-12-31historical
-
2025-12-12price $669,000
-
2025-11-03status Active
-
2025-10-31historical
-
2025-10-03price $675,000
-
2025-09-16price $699,000
-
2025-08-22$720,000 Active
-
2020-03-19soldstatus $180,000
-
2015-07-10soldstatus $158,000 Sold 347-char remark
Show marketing remark (347 chars)
Opportunity is knocking for your investor to purchase this updated duplex with newer kitchens, electrical, a/c and laundry rooms with private backyards. Duplex is located East of US1 just East of Andrews. Both units are currently leased out, one is mont h to month. Yearly gross income of $22,200. Call agent to show. Please provide 24 hr notice.
-
2015-04-24soldstatus $158,000
-
2015-03-17status Pending 347-char remark
Show marketing remark (347 chars)
Opportunity is knocking for your investor to purchase this updated duplex with newer kitchens, electrical, a/c and laundry rooms with private backyards. Duplex is located East of US1 just East of Andrews. Both units are currently leased out, one is mont h to month. Yearly gross income of $22,200. Call agent to show. Please provide 24 hr notice.
-
2015-01-25$167,900 Active 347-char remark
Show marketing remark (347 chars)
Opportunity is knocking for your investor to purchase this updated duplex with newer kitchens, electrical, a/c and laundry rooms with private backyards. Duplex is located East of US1 just East of Andrews. Both units are currently leased out, one is mont h to month. Yearly gross income of $22,200. Call agent to show. Please provide 24 hr notice.
-
2015-01-15historical
-
2014-10-07price $174,900
-
2014-07-16$179,900 Active
-
2001-04-11soldstatus $121,000
-
1989-11-06soldstatus $73,500
-
1986-08-15soldstatus $70,000
-
1986-08-01soldstatus $70,000
ⓘ Source: listings_history table (triggers on properties + properties_extension) + one-shot
backfill from property_details.listing_events for pre-trigger history.
Tax reassessment forecast FL · Resets to sale price
- Current annual tax
- $11,123 · $927/mo
- Projected year-2 tax
- $11,123 · $927/mo
- Expected delta
- $0/yr ($0/mo · 0.0%)
ⓘ Screening estimate from a state-policy table — verify with the county assessor before closing.
Climate risk First Street
- Flood 4/10 Moderate FEMA zone X (shaded) · 22% chance over 30 yrs
- Wildfire 1/10 Low
- Heat 10/10 Extreme 7 d/yr ≥106°F today · 26 d/yr by 30 yrs out
- Wind 10/10 Extreme 99% chance of damaging wind over 30 yrs
- Air quality 2/10 Low 1 unhealthy d/yr today · 2 by 30 yrs out
Nearby sold comps map
Loading sold comps map…
Walkable amenities ~0.75 mi
Loading nearby amenities…
Taxation est. · year 1
- Rental income
- $84,876
- − Mortgage interest
- −$34,618
- − Property taxes
- −$11,123
- − Insurance
- −$3,090
- − Repairs & maintenance
- −$6,790
- − Management
- −$6,790
- − Depreciation
- −$17,978
- Taxable income
- $4,487
- Est. tax owed @ 24.0%
- −$1,077
- After-tax cash flow
- $12,872/yr
For passive investors: Depreciation is non-cash, so a rental often shows a tax loss while cash-flowing — sheltering income. Rental losses are passive: they offset passive income freely, and up to $25,000/yr can offset ordinary (W-2) income if you actively participate and your MAGI is under $100k (phasing out to $0 by $150k); unused losses carry forward. On sale, claimed depreciation is recaptured at up to 25%, and gains may owe capital-gains tax (a 1031 exchange can defer both). Figures are a year-1 estimate at your 24.0% rate — not tax advice; consult a CPA.
Schools (NCES district)
- District
- Broward
- NCES district ID
- 1200180
- Math proficiency
- 42% ▼ -18.00%
- Reading proficiency
- 53% ▼ -5.00%
- Median HH income
- $52,139
- Composite
- 40.88/100
- National rank
- #3621
- State rank
- #46 of 73 in FL
Livability — Oakland Park
- Score
- 77/100
- State rank
- #193
- US rank
- #3082
Category grades
Schools grade is shown separately in the Schools card above.
Census & demographics
- Census place
- Oakland Park, FL
- County
- Broward County · 1,963,430 people
- City population
- 68,410
- Metro
- Miami-Fort Lauderdale-Pompano Beach, FL
- Population (ZIP)
- 30,935
- Household income
- $75,361
- Rent vs Own
- Severe rent burden
- 1755.0
Population outlook (Broward County) Hauer SSP2
- Today (2025)
- 2,207,033 people
- By 2030
- 2,360,704 · +7.0%
- By 2040
- 2,661,208 · +20.6%
- By 2050
- 2,946,698 · +33.5%
- By 2075
- 3,602,273 · +63.2%
- By 2100
- 3,970,984 · +79.9%
Race, ethnicity, and origin ACS 2023
- Neighborhood character
- Diverse neighborhood (Simpson 0.68)
- Race & ethnicity
- White 43% Hispanic / Latino 32% Two or more races 25% Black 17% Asian 2%
- Hispanic origin (detail)
- Mexican 2% Puerto Rican 4% Cuban 4%
- Common ancestry
- Hispanic 5% Lithuanian 3% Romanian 2%
- Foreign-born
- 31% · Canada, Jamaica, Vietnam
- Languages at home
- 59% English-only · Spanish 28% Other Indo-European 5% French/Haitian/Cajun 5%
Political lean MEDSL · Broward
- 2024 margin
- D (+17.0) · D 58.0% · R 41.0%
- 2008→2024 swing
- -17.8pp toward R · 2008: 34.7pp · 2024: 17.0pp
- All cycles
- 2024: D+17.0 2020: D+29.8 2016: D+35.0 2012: D+34.9 2008: D+34.7
Not yet ingested
- Civics
- —
Market trends
- HPI YoY
- ▼ -208.58%
- Current HPI
- 394.9526
- Rent YoY
- ▲ 2.01%
- Metro
- Miami-Fort Lauderdale-Pompano Beach, FL
- State GDP YoY
- ▲ 3.28%
- F500 in state
- 36
Industry mix (Fortune 500 HQ in FL)
| Industry | F500 HQs | Revenue |
|---|---|---|
| Industrial Technology | 2 | $29B |
|
||
| Insurance | 2 | $17B |
|
||
| Retail | 1 | $60B |
|
||
| Technology Distribution | 1 | $58B |
|
||
| Homebuilding | 1 | $35B |
|
||
| Technology Manufacturing | 1 | $35B |
|
||
Price history
+797.1% since first listed22 events — show timeline
- 2026-02-12 Price Changed $628,000 MARMLS
- 2026-01-27 Price Changed $649,000 MARMLS
- 2026-01-01 Relisted — MARMLS
- 2025-12-31 Listing Removed — MARMLS
- 2025-12-12 Price Changed $669,000 MARMLS
- 2025-11-03 Relisted — MARMLS
- 2025-10-31 Listing Removed — MARMLS
- 2025-10-03 Price Changed $675,000 MARMLS
- 2025-09-16 Price Changed $699,000 MARMLS
- 2025-08-22 Listed $720,000 MARMLS
- 2020-03-19 Sold (Public Records) $180,000 Public Records
- 2015-07-10 Sold (MLS) $158,000 MARMLS
- 2015-04-24 Sold (Public Records) $158,000 Public Records
- 2015-03-17 Pending — MARMLS
- 2015-01-25 Listed $167,900 MARMLS
- 2015-01-15 Listing Removed — MARMLS
- 2014-10-07 Price Changed $174,900 MARMLS
- 2014-07-16 Listed $179,900 MARMLS
- 2001-04-11 Sold (Public Records) $121,000 Public Records
- 1989-11-06 Sold (Public Records) $73,500 Public Records
- 1986-08-15 Sold (Public Records) $70,000 Public Records
- 1986-08-01 Sold (Public Records) $70,000 Public Records
Property tax history
+10.7%/yrLatest (2025): $11,123 · +8.4% YoY. Source: county tax records.
Cash-flow waterfall
monthlySold comps — $/sqft
last 12 mo · ≤1 miLoading sold comps…