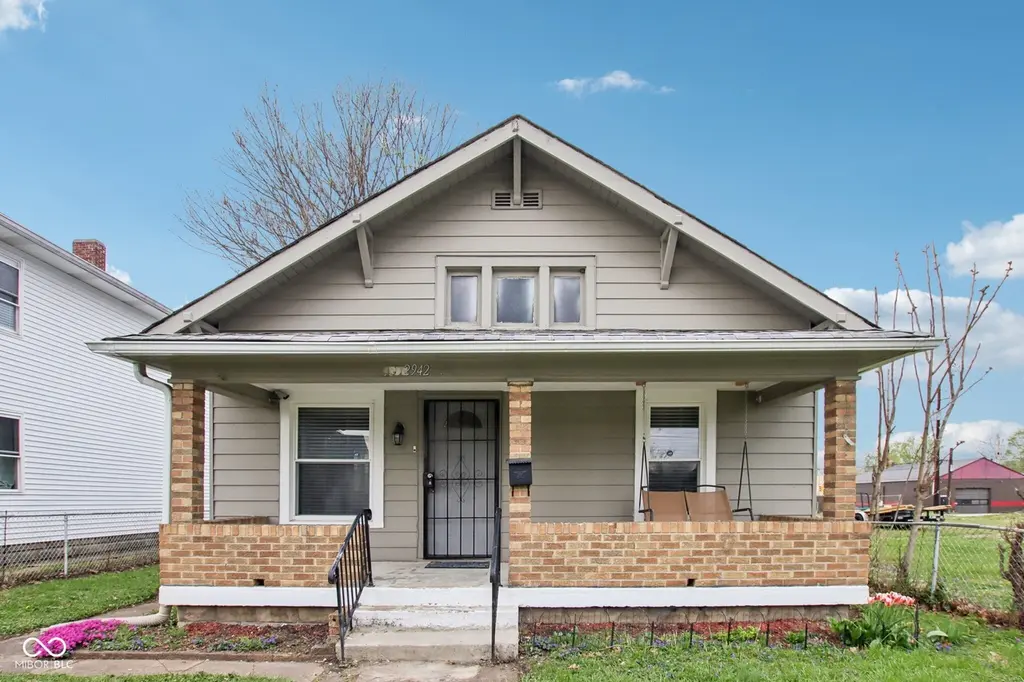
2942 Mac Pherson Ave · Indianapolis city (balance), IN
Flood risk 1/10 · Minimal
- FEMA flood zone
- X (unshaded)
- Chance of flooding over 30 yrs
- 0.0%
- Est. flood insurance / yr
- $473 – $860
Fire risk 1/10 · Minimal
- Est. fire insurance / yr
- $717 – $1,331
Heat risk 4/10 · Minor
- Hot days now (above 102°F)
- 7 days/yr
- Hot days in 30 yrs
- 19 days/yr
Wind risk 2/10 · Minimal
- Chance of severe wind over 30 yrs
- 0.0%
Air-quality risk 4/10 · Minor
- Unhealthy air days now
- 5 days/yr
- Unhealthy air days in 30 yrs
- 7 days/yr
Risk factors via First Street. Map © Google.
Why this score? — see what drove the D+ grade
The composite is a weighted blend of 9 inputs, each scored 0–100. Each bar is that input's sub-score; the figure is the points it added to the 100-point composite (weight × sub-score).
- ARV discount +15.0/15.0
- Cash flow +12.6/30.0
- Rent growth +4.1/5.0
- DSCR +3.7/10.0
- 1% rule +3.5/10.0
- Livability +2.5/5.0
- Condition / age +2.5/5.0
- Schools +1.4/10.0
- Appreciation +0.0/10.0
$179,900
🖨 Deal sheet (PDF) 📄 Offer letter ✓ Due diligence
Listing remarks MLS
Back on market! This charming, renovated three-bedroom house is ready for its new owner! Well-situated just one block from the Monon Trail, the property offers easy access to both downtown Indianapolis and Broad Ripple. This bungalow features 10-foot ceilings, gorgeous hardwood floors, and tile throughout the main level. Key updates including the roof, HVAC, water heater, windows, garage door, and stainless steel appliances are all only six years old. The basement provides ample storage space and laundry. Outdoor features include a welcoming covered front porch and a generously sized fully fenced in yard with a detached two-car garage. Come visit this turn-key property today!
Key facts
- Covered front porch
- Monon trail access
- Fully fenced yard
Tags
Neighborhood map
What this means for you Summary
Snapshot
- This is a 2-bed/1.0-bath single-family listed at $180k.
Deal economics
- At list price, monthly cash flow is $-25 ($-296/yr) — negative.
- To cash-flow at today's rent, offer at most $176k (2.4% below list).
- To meet the 1% rule (rent ≥ 1% of price), the offer needs to be $152k (15.3% below list).
- Recommended offer: $152k (15.3% below list) — sets the bar for 1% rule.
- Cap rate 6.1% vs local median 4.4% in Indianapolis city (balance) — top-decile yield for the area; either an underpriced asset or a hidden risk that comps aren't pricing in. Stress-test before assuming the spread holds.
Location & tenants
- Location reads: area grade D — affects rentability + tenant quality, not the cash-flow math above.
- Indianapolis Public Schools (urban): math 14% / reading 20% proficiency, ranked #286 of 301 in IN (top 95%) — low school quality limits family demand, transient renter base, plan for 1-2y turnover; 77% free/reduced lunch — lower-income household profile, screen leases tightly.
- Zoned schools: Center For Inquiry School 27 (math 25% / reading 29%, grade F, #737 of 994 statewide, top 76%, 525 students, 51% FRL); H L Harshman Middle School (math 3% / reading 16%, grade F, #316 of 330 statewide, top 96%, 549 students, 84% FRL); Arsenal Technical High School (math 6% / reading 27%, grade F, #353 of 369 statewide, top 96%, 2,366 students, 74% FRL).
- Market conditions: Rents rising fast (+6.2%/yr); 317 active listings in the ZIP; 40 comparable units currently listed for rent nearby; rentals at typical pace (median 26d on market — plan ~3-4 weeks tenant-placement turnaround); 1,906 units permitted in Marion County in 2024 (621 in 5+ unit buildings).
Forward outlook
- Local home prices are declining (-3.0%/yr); year-one equity from $1k of loan paydown is wiped out by about $5k of value loss. Plan a longer hold.
- Marion County population projected at +18% by 2050 — long-run rental-demand tailwind backs the buy-and-hold thesis.
Negotiation context
- It's been on market 21 days — a 2% lower offer ($177k) is reasonable based on typical stale-listing flexibility.
- 7 sale attempts since 8y ago with the ask held roughly flat each time — persistent listings suggest the price (not the market) is what's stuck; bring a comps-based counter.
- Current owner paid $118k; list at $180k implies a 53% gain — meaningful room to come down on a strong offer.
Risks & watch-outs
- Watch-outs: built in 1920 — expect roof / HVAC / electrical / plumbing capex.
Questions for the listing agent
- What do current leases actually rent for vs. the listed asking? Can we see a recent rent roll and the last 12 months of T-12 income?
- Built in 1920 — when were the roof, HVAC, electrical panel, plumbing, and water heater last replaced?
- Is there a deadline driving the sale (1031 exchange, divorce, estate, relocation)? That informs how much negotiation room exists.
- The area grade is low — what's the realistic commute time and amenity access for the typical tenant pool here? Any planned neighborhood developments (good or bad) we should know about?
- What's the average days-on-market for RENTAL listings here right now (not sales)? A rising rental-DOM trend means longer vacancies and softer asking-rent achievability than the comps imply.
- What's the recent tenant-quality profile in this submarket — average credit score on applications, eviction rate, late-payment / NSF rate, and stable-employment percentage? A property-management company in the area should have these aggregated.
- How much new for-sale + rental construction is in the pipeline within 1–3 miles? Heavy new supply typically softens prices + rents 12–24 months out; constrained supply supports both.
Investment metrics
- 1% rule
- 0.85% ✗
- Cap rate
- 6.13%
- Cash-on-cash
- -0.59%
- DSCR
- 0.97
- GRM
- 9.8
CMA / ARV
- ARV (median comp)
- $243,794
- List price
- $179,900
- Delta
- -26.21%
- Verdict
- UNDERPRICED
- Comps
- 20 within 1.0 mi
Show comp detail 12 sales within ~0.75 mi
| Address | Dist | Beds/Ba | Sqft | Sold | Price | $/sf | Match |
|---|---|---|---|---|---|---|---|
| 2808 Sangster Ave | 0.56mi | 3/1.0 (+1) | 1,028 (0%) | 3mo | $100,000 | $97 | 66 |
| 2848 Schofield Ave | 0.48mi | 3/1.0 (+1) | 1,102 (+7%) | 2mo | $72,000 | $65 | 59 |
| 2931 Sangster Ave | 0.56mi | 3/1.0 (+1) | 1,064 (+4%) | 6mo | $117,000 | $110 | 58 |
| 2445 Guilford Ave | 0.53mi | 3/1.0 (+1) | 1,104 (+7%) | 3mo | $120,000 | $109 | 55 |
| 2753 Sangster Ave | 0.60mi | 3/1.0 (+1) | 1,088 (+6%) | 3mo | $162,000 | $149 | 54 |
| 2429 N Arsenal Ave | 0.59mi | 3/1.0 (+1) | 1,008 (-2%) | 12mo | $93,500 | $93 | 54 |
| 2929 Manlove Ave | 0.62mi | 3/1.0 (+1) | 960 (-7%) | 2mo | $139,000 | $145 | 53 |
| 2701 Sangster Ave | 0.65mi | 3/1.0 (+1) | 1,064 (+4%) | 9mo | $180,000 | $169 | 52 |
| 2601 Manlove Ave | 0.73mi | 3/1.0 (+1) | 972 (-5%) | 1mo | $174,900 | $180 | 51 |
| 3038 Baltimore Ave | 0.69mi | 2/1.0 | 924 (-10%) | 4mo | $98,500 | $107 | 48 |
| 2813 Baltimore Ave | 0.71mi | 3/1.0 (+1) | 1,139 (+11%) | 11mo | $133,000 | $117 | 35 |
| 2437 Ralston Ave | 0.68mi | 3/2.0 (+1) | 1,160 (+13%) | 10mo | $87,500 | $75 | 29 |
Match score weights: distance 35% · size 25% · config 20% · recency 20%. Top-matched comps best support the ARV.
Projected returns pro-forma
-3.0% appreciation · 6.21% rent growth · sell at horizon
- IRR
- -13.8%
- Equity multiple
- 0.49×
- Total profit
- $-25,630
- Equity at exit
- $26,824
- IRR
- -0.5%
- Equity multiple
- 0.96×
- Total profit
- $-2,028
- Equity at exit
- $15,554
Cash invested: $50,372 (down + closing). Projections, not guarantees.
Landlord ↔ Tenant lean methodology
- Overall (STATE)
- 90 Strongly Landlord-Friendly
- State Indiana
- 90 Strongly Landlord-Friendly · R+11
- County
- — inherits STATE
- City
- — inherits STATE
ZIP-level market 46205
- Rents YoY
- 6.2%
- Active inventory
- 317
- Price-to-rent
- 9.8×
Monthly cashflow live
- Estimated rent
- $1,523 high interval (Pro) →
- Mortgage (P&I)
- −$943
- Tax from tax record
- −$209 /mo · $2,514/yr
- Insurance
- −$75
- HOA
- −$0
- Vacancy / Maint / Mgmt
- −$320
- Net cashflow
- $-25
Break-even live
Sensitivity live
| Price | -10% $77 | -5% $26 | +0% $-25 | +5% $-76 | +10% $-126 |
|---|---|---|---|---|---|
| Rent | -10% $-145 | -5% $-85 | +0% $-25 | +5% $36 | +10% $96 |
| Rate | -1.0pp $66 | -0.5pp $21 | base $-25 | +0.5pp $-71 | +1.0pp $-119 |
UW: 25.0% down · 7.5% · 30yr · 1.5% tax · 5.0% vac · 8.0% maint · 8.0% mgmt
Financing live
Cash to close
- Down payment
- $44,975
- Closing costs
- $5,397
- Reserves months
- —
- Total cash needed
- —
Loan-product check · same deal, 3 products live
Conventional
25% down · 7.5% · 30yr
- Down + closing
- —
- Monthly P&I
- —
- Monthly cashflow
- —
- DSCR
- —
- Eligible?
- —
Personal DTI + credit; lowest rate.
DSCR
20% down · 8.5% · 30yr
- Down + closing
- —
- Monthly P&I
- —
- Monthly cashflow
- —
- DSCR
- —
- Eligible?
- —
No personal income docs; deal must DSCR.
Hard money
10% down · 12.0% · 12mo
- Down + closing
- —
- Monthly P&I
- —
- Monthly cashflow
- —
- DSCR
- —
- Eligible?
- —
Short-term bridge; refi at stabilization.
Rent comps 40 comps
| Address | Beds | Baths | Sqft | Rent | $/sqft | DOM | Units | Dist |
|---|---|---|---|---|---|---|---|---|
| 2950 Winthrop Ave Indianapolis, IN | 3.0 | 2.0 | 1224 | $1,449 | $1.18 | 46d | 1 | 0.06mi |
| 3110 Guilford Ave Indianapolis, IN | 3.0 | 1.5 | 1250 | $1,295 | $1.04 | 26d | 1 | 0.17mi |
| 3139 Guilford Ave Indianapolis, IN | 3.0 | 1.0 | 1068 | $1,345 | $1.26 | 46d | 1 | 0.21mi |
| 2751 Guilford Ave Unit B Indianapolis, IN | 3.0 | 2.0 | 1250 | $1,750 | $1.40 | 16d | 1 | 0.25mi |
| 2751 Guilford Ave Unit A Indianapolis, IN | 3.0 | 2.0 | 1250 | $1,750 | $1.40 | 0d | 1 | 0.25mi |
| 2751 Guilford Ave Unit Aunit Indianapolis, IN | 3.0 | 2.0 | 1250 | $1,750 | $1.40 | 46d | 1 | 0.25mi |
| 2757 Columbia Ave Unit 2757-B Indianapolis, IN | 3.0 | 2.0 | 1350 | $1,525 | $1.13 | 46d | 1 | 0.25mi |
| 3203 Sutherland Ave Unit 1310761P Indianapolis, IN | 2.0 | 1.0 | 1097 | $3,668 | $3.34 | 4d | 1 | 0.25mi |
| 3132 Dr Andrew J Brown Ave Indianapolis, IN | 2.0 | 1.0–2.0 | 791 | $2,120 | $2.68 | 4d | 46 | 0.26mi |
| 2711 Guilford Ave Indianapolis, IN | 3.0 | 2.0 | 1250 | $1,695 | $1.36 | 26d | 1 | 0.32mi |
| 3207 N Arsenal Ave Indianapolis, IN | 3.0 | 1.0 | 994 | $1,195 | $1.20 | 0d | 1 | 0.37mi |
| 3207 N Arsenal Ave Indianapolis, IN | 3.0 | 1.0 | 994 | $1,195 | $1.20 | 26d | 1 | 0.37mi |
| 2553 Columbia Ave Unit 2553-B Indianapolis, IN | 3.0 | 2.0 | 1350 | $1,525 | $1.13 | 46d | 1 | 0.37mi |
| 3106 N College Ave Indianapolis, IN | 3.0 | 1.5 | 1400 | $1,700 | $1.21 | 9d | 1 | 0.37mi |
| 2549 Columbia Ave Unit 1332865P Indianapolis, IN | 3.0 | 2.0 | 893 | $2,252 | $2.52 | 0d | 1 | 0.38mi |
| 2614 Guilford Ave Unit 2614 Indianapolis, IN | 3.0 | 1.0 | 1176 | $1,645 | $1.40 | 0d | 1 | 0.41mi |
| 2707 N College Ave Indianapolis, IN | 3.0 | 2.0 | 1500 | $2,200 | $1.47 | 20d | 1 | 0.41mi |
| 2709 N College Ave Indianapolis, IN | 3.0 | 2.0 | 1500 | $2,200 | $1.47 | 26d | 1 | 0.42mi |
| 717 E 27th St Indianapolis, IN | 1.0 | 1.5 | 1322 | $2,600 | $1.97 | 46d | 1 | 0.43mi |
| 2529 Guilford Ave Unit A Indianapolis, IN | 2.0 | 1.5 | 1000 | $1,495 | $1.50 | 46d | 1 | 0.44mi |
| 2960 N Park Ave Indianapolis, IN | 3.0 | 1.5 | 1400 | $1,550 | $1.11 | 0d | 1 | 0.45mi |
| 2960 N Park Ave Indianapolis, IN | 3.0 | 1.5 | 1400 | $1,550 | $1.11 | 26d | 1 | 0.45mi |
| 2960 N Park Ave Indianapolis, IN | 3.0 | 2.0 | 1400 | $1,595 | $1.14 | 46d | 1 | 0.45mi |
| 2958 N Park Ave Unit 2958 Indianapolis, IN | 3.0 | 1.5 | 1350 | $1,450 | $1.07 | 5d | 1 | 0.45mi |
| 2830 N Park Ave Indianapolis, IN | 2.0 | 3.0 | 1500 | $1,600 | $1.07 | 46d | 1 | 0.47mi |
| 3141 N Park Ave Indianapolis, IN | 3.0 | 1.0 | 1390 | $1,000 | $0.72 | 46d | 1 | 0.49mi |
| 2950 Ruckle St Indianapolis, IN | 3.0 | 1.0 | 1450 | $1,300 | $0.90 | 46d | 1 | 0.52mi |
| 2920 Ruckle St Indianapolis, IN | 3.0 | 1.5 | 1272 | $1,700 | $1.34 | 0d | 1 | 0.52mi |
| 2920 Ruckle St Indianapolis, IN | 3.0 | 1.5 | 1272 | $1,700 | $1.34 | 9d | 1 | 0.52mi |
| 2519 N College Ave Unit 1 Indianapolis, IN | 3.0 | 2.5 | 1416 | $1,850 | $1.31 | 46d | 1 | 0.52mi |
| 3359 N College Ave Unit 3359 Indianapolis, IN | 2.0 | 1.5 | 1082 | $1,895 | $1.75 | 26d | 1 | 0.59mi |
| 3359 N College Ave Indianapolis, IN | 2.0 | 1.5 | 1450 | $1,795 | $1.24 | 12d | 1 | 0.59mi |
| 728 E 34th St Indianapolis, IN | 3.0 | 1.0 | 1491 | $1,400 | $0.94 | 6d | 1 | 0.60mi |
| 728 E 34th St Indianapolis, IN | 3.0 | 1.0 | 1491 | $1,400 | $0.94 | 22d | 1 | 0.60mi |
| 3365 Broadway St Indianapolis, IN | 3.0 | 2.0 | 1300 | $1,700 | $1.31 | 46d | 1 | 0.63mi |
| 2340 Columbia Ave Unit 2340-B Indianapolis, IN | 3.0 | 2.0 | 1350 | $1,650 | $1.22 | 46d | 1 | 0.66mi |
| 321 E 31st St Indianapolis, IN | 3.0 | 1.0 | 1390 | $1,400 | $1.01 | 46d | 1 | 0.67mi |
| 514 E 33rd St Indianapolis, IN | 3.0 | 1.0 | 1208 | $1,200 | $0.99 | 26d | 1 | 0.68mi |
| 512 E 33rd St Indianapolis, IN | 3.0 | 1.0 | 1208 | $1,200 | $0.99 | 26d | 1 | 0.68mi |
| 3476 Birchwood Ave Indianapolis, IN | 3.0 | 1.5 | 1420 | $1,625 | $1.14 | 26d | 1 | 0.69mi |
Listing history 17 events
-
2026-05-13status Active 685-char remark
Show marketing remark (685 chars)
Back on market! This charming, renovated three-bedroom house is ready for its new owner! Well-situated just one block from the Monon Trail, the property offers easy access to both downtown Indianapolis and Broad Ripple. This bungalow features 10-foot ceilings, gorgeous hardwood floors, and tile throughout the main level. Key updates including the roof, HVAC, water heater, windows, garage door, and stainless steel appliances are all only six years old. The basement provides ample storage space and laundry. Outdoor features include a welcoming covered front porch and a generously sized fully fenced in yard with a detached two-car garage. Come visit this turn-key property today!
-
2026-04-17status Pending 685-char remark
Show marketing remark (685 chars)
Back on market! This charming, renovated three-bedroom house is ready for its new owner! Well-situated just one block from the Monon Trail, the property offers easy access to both downtown Indianapolis and Broad Ripple. This bungalow features 10-foot ceilings, gorgeous hardwood floors, and tile throughout the main level. Key updates including the roof, HVAC, water heater, windows, garage door, and stainless steel appliances are all only six years old. The basement provides ample storage space and laundry. Outdoor features include a welcoming covered front porch and a generously sized fully fenced in yard with a detached two-car garage. Come visit this turn-key property today!
-
2026-04-10$179,900 Active 685-char remark
Show marketing remark (685 chars)
Back on market! This charming, renovated three-bedroom house is ready for its new owner! Well-situated just one block from the Monon Trail, the property offers easy access to both downtown Indianapolis and Broad Ripple. This bungalow features 10-foot ceilings, gorgeous hardwood floors, and tile throughout the main level. Key updates including the roof, HVAC, water heater, windows, garage door, and stainless steel appliances are all only six years old. The basement provides ample storage space and laundry. Outdoor features include a welcoming covered front porch and a generously sized fully fenced in yard with a detached two-car garage. Come visit this turn-key property today!
-
2020-06-02soldstatus $117,500 Sold 757-char remark
Show marketing remark (757 chars)
This charming, fully renovated 3BR 1BA home ready for immediate occupancy. Excellent location minutes to Indy downtown, Broad Ripple, & one block away from Monon Trail. Top quality solid hdwd floor & tile throughout 1st floor, top brand new windows throughout, new paint in & out. 10-ft ceiling, Completely remodeled kitchen with brand new set of SS appliances, granite counter top, cabinet, faucet, & garbage disposal. Brand new bathroom with window. New HVAC system, new plumping system, water heater, new electricity system. 2-car garage with new garage door. New 2-inch faux wood window blinds throughout. Landscaping with fenced yard. Well maintained & newly painted covered porch for outdoor enjoyment. With permit to build duplex!
-
2020-04-26status Pending 757-char remark
Show marketing remark (757 chars)
This charming, fully renovated 3BR 1BA home ready for immediate occupancy. Excellent location minutes to Indy downtown, Broad Ripple, & one block away from Monon Trail. Top quality solid hdwd floor & tile throughout 1st floor, top brand new windows throughout, new paint in & out. 10-ft ceiling, Completely remodeled kitchen with brand new set of SS appliances, granite counter top, cabinet, faucet, & garbage disposal. Brand new bathroom with window. New HVAC system, new plumping system, water heater, new electricity system. 2-car garage with new garage door. New 2-inch faux wood window blinds throughout. Landscaping with fenced yard. Well maintained & newly painted covered porch for outdoor enjoyment. With permit to build duplex!
-
2020-03-12$118,880 Active 757-char remark
Show marketing remark (757 chars)
This charming, fully renovated 3BR 1BA home ready for immediate occupancy. Excellent location minutes to Indy downtown, Broad Ripple, & one block away from Monon Trail. Top quality solid hdwd floor & tile throughout 1st floor, top brand new windows throughout, new paint in & out. 10-ft ceiling, Completely remodeled kitchen with brand new set of SS appliances, granite counter top, cabinet, faucet, & garbage disposal. Brand new bathroom with window. New HVAC system, new plumping system, water heater, new electricity system. 2-car garage with new garage door. New 2-inch faux wood window blinds throughout. Landscaping with fenced yard. Well maintained & newly painted covered porch for outdoor enjoyment. With permit to build duplex!
-
2019-10-08historical
-
2019-08-23price $129,800
-
2019-08-03price $139,800
-
2019-08-03status Active
-
2019-07-30historical
-
2019-07-25$144,800 Active
-
2019-03-05soldstatus $55,000 Sold
-
2019-02-19status Pending
-
2019-01-02status Active
-
2018-12-21historical
-
2018-06-23$65,000 Active
ⓘ Source: listings_history table (triggers on properties + properties_extension) + one-shot
backfill from property_details.listing_events for pre-trigger history.
Tax reassessment forecast IN · Partial reset (capped growth)
- Current annual tax
- $2,514 · $209/mo
- Projected year-2 tax
- $2,514 · $209/mo
- Expected delta
- $0/yr ($0/mo · 0.0%)
ⓘ Screening estimate from a state-policy table — verify with the county assessor before closing.
Climate risk First Street
- Flood 1/10 Low FEMA zone X (unshaded) · 0% chance over 30 yrs
- Wildfire 1/10 Low
- Heat 4/10 Moderate 7 d/yr ≥102°F today · 19 d/yr by 30 yrs out
- Wind 2/10 Low 0% chance of damaging wind over 30 yrs
- Air quality 4/10 Moderate 5 unhealthy d/yr today · 7 by 30 yrs out
Nearby sold comps map
Loading sold comps map…
Walkable amenities ~0.75 mi
Loading nearby amenities…
Taxation est. · year 1
- Rental income
- $18,277
- − Mortgage interest
- −$10,077
- − Property taxes
- −$2,514
- − Insurance
- −$900
- − Repairs & maintenance
- −$1,462
- − Management
- −$1,462
- − Depreciation
- −$5,233
- Taxable loss
- −$3,371
- Est. tax savings @ 24.0%
- +$809
- After-tax cash flow
- $514/yr
For passive investors: Depreciation is non-cash, so a rental often shows a tax loss while cash-flowing — sheltering income. Rental losses are passive: they offset passive income freely, and up to $25,000/yr can offset ordinary (W-2) income if you actively participate and your MAGI is under $100k (phasing out to $0 by $150k); unused losses carry forward. On sale, claimed depreciation is recaptured at up to 25%, and gains may owe capital-gains tax (a 1031 exchange can defer both). Figures are a year-1 estimate at your 24.0% rate — not tax advice; consult a CPA.
Schools (NCES district)
- District
- Indianapolis Public Schools
- NCES district ID
- 1804770
- Math proficiency
- 14% ▼ -7.00%
- Reading proficiency
- 20% ▼ -3.00%
- Median HH income
- $32,034
- Composite
- 13.69/100
- National rank
- #9499
- State rank
- #286 of 301 in IN
Livability — Indianapolis city (balance)
No livability data for this city. (Only ~50 U.S. cities are tracked.)
Census & demographics
- Census place
- Indianapolis city (balance), IN
- County
- Marion County · 998,460 people
- City population
- 881,119
- Metro
- Indianapolis-Carmel-Anderson, IN
- Population (ZIP)
- 28,259
- Household income
- $72,417
- Rent vs Own
- Severe rent burden
- 1149.0
Population outlook (Marion County) Hauer SSP2
- Today (2025)
- 1,025,572 people
- By 2030
- 1,065,727 · +3.9%
- By 2040
- 1,141,577 · +11.3%
- By 2050
- 1,208,920 · +17.9%
- By 2075
- 1,367,288 · +33.3%
- By 2100
- 1,438,201 · +40.2%
Race, ethnicity, and origin ACS 2023
- Neighborhood character
- Diverse neighborhood (Simpson 0.64)
- Race & ethnicity
- White 50% Black 32% Two or more races 10% Hispanic / Latino 7% Asian 3%
- Hispanic origin (detail)
- Mexican 4%
- Common ancestry
- Italian 3% Slovak 2% Romanian 2%
- Foreign-born
- 5% · Canada
- Languages at home
- 89% English-only · Spanish 6% Other Indo-European 2% German/W. Germanic 1%
Political lean MEDSL · Marion
- 2024 margin
- Strong D (+27.7) · D 63.0% · R 35.3% · Other 1.7%
- 2008→2024 swing
- -0.7pp no change · 2008: 28.4pp · 2024: 27.7pp
- All cycles
- 2024: D+27.7 2020: D+29.1 2016: D+22.8 2012: D+22.2 2008: D+28.4
Not yet ingested
- Civics
- —
Market trends
- HPI YoY
- ▼ -322.77%
- Current HPI
- 380.5407
- Rent YoY
- ▲ 6.21%
- Metro
- Indianapolis-Carmel-Anderson, IN
- State GDP YoY
- ▲ 2.90%
- F500 in state
- 18
Industry mix (Fortune 500 HQ in IN)
| Industry | F500 HQs | Revenue |
|---|---|---|
| Industrial Machinery | 2 | $37B |
|
||
| Healthcare | 1 | $177B |
|
||
| Pharmaceuticals | 1 | $45B |
|
||
| Metals / Steel | 1 | $18B |
|
||
| Agriculture | 1 | $17B |
|
||
| Packaging | 1 | $12B |
|
||
Price history
+176.8% since first listed17 events — show timeline
- 2026-05-13 Relisted — MIBOR as Distributed by MLS Grid
- 2026-04-17 Pending — MIBOR as Distributed by MLS Grid
- 2026-04-10 Listed $179,900 MIBOR as Distributed by MLS Grid
- 2020-06-02 Sold (MLS) $117,500 MIBOR as Distributed by MLS Grid
- 2020-04-26 Pending — MIBOR as Distributed by MLS Grid
- 2020-03-12 Listed $118,880 MIBOR as Distributed by MLS Grid
- 2019-10-08 Listing Removed — MIBOR as Distributed by MLS Grid
- 2019-08-23 Price Changed $129,800 MIBOR as Distributed by MLS Grid
- 2019-08-03 Price Changed $139,800 MIBOR as Distributed by MLS Grid
- 2019-08-03 Relisted — MIBOR as Distributed by MLS Grid
- 2019-07-30 Listing Removed — MIBOR as Distributed by MLS Grid
- 2019-07-25 Listed $144,800 MIBOR as Distributed by MLS Grid
- 2019-03-05 Sold (MLS) $55,000 MIBOR as Distributed by MLS Grid
- 2019-02-19 Pending — MIBOR as Distributed by MLS Grid
- 2019-01-02 Relisted — MIBOR as Distributed by MLS Grid
- 2018-12-21 Listing Removed — MIBOR as Distributed by MLS Grid
- 2018-06-23 Listed $65,000 MIBOR as Distributed by MLS Grid
Property tax history
+7.2%/yrLatest (2025): $2,514 · -6.9% YoY. Source: county tax records.
Cash-flow waterfall
monthlySold comps — $/sqft
last 12 mo · ≤1 miLoading sold comps…